IWM trade ideas

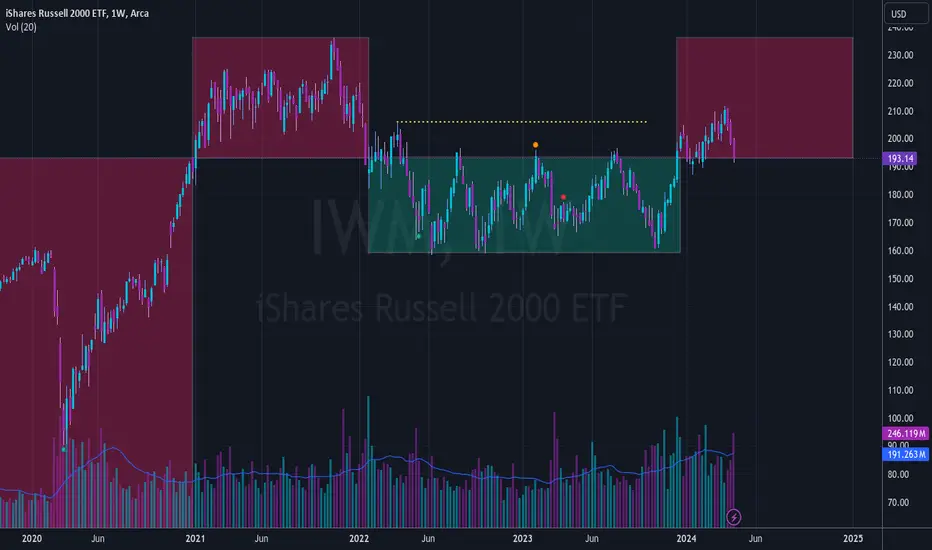
Think inside the boxLooking at weekly, IWM spent its history up thru 2020 in big, red box. Then it spent exactly one year in the upper box. Two years in the green box. And 2024 went back in the upper box. It's now at the bottom of the upper box.
The implication being that, although it has strayed outside the boxes for a few weeks at a time, it seems to have returned, and mostly stayed inside each box for an entire year.
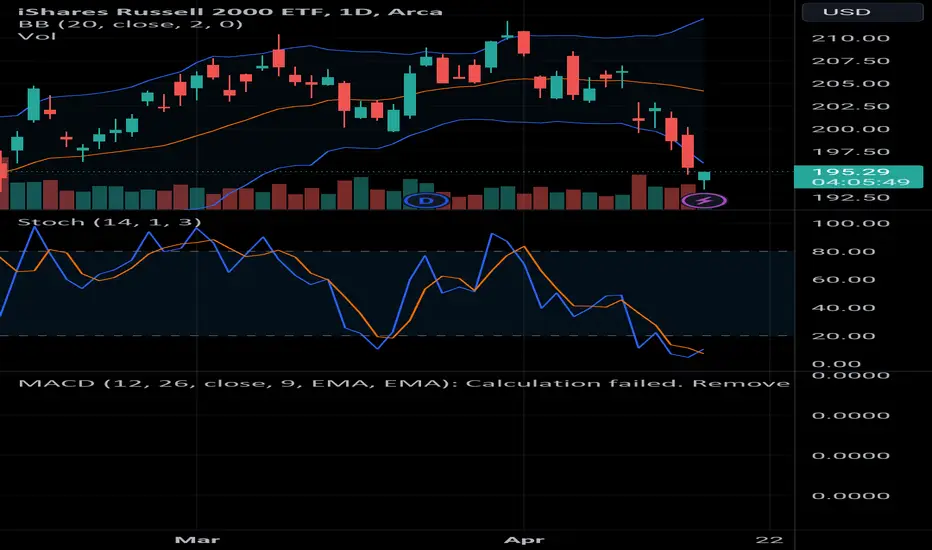
$IWM - Can we see a relieve bounce soon?AMEX:IWM hits the first support area of $192. It is the October 2023 pivot VWAP (Volume Weighted Average Price), which has provided support before. 👀 The RSI (Relative Strength Index) is close to oversold, so we could see a bounce soon.

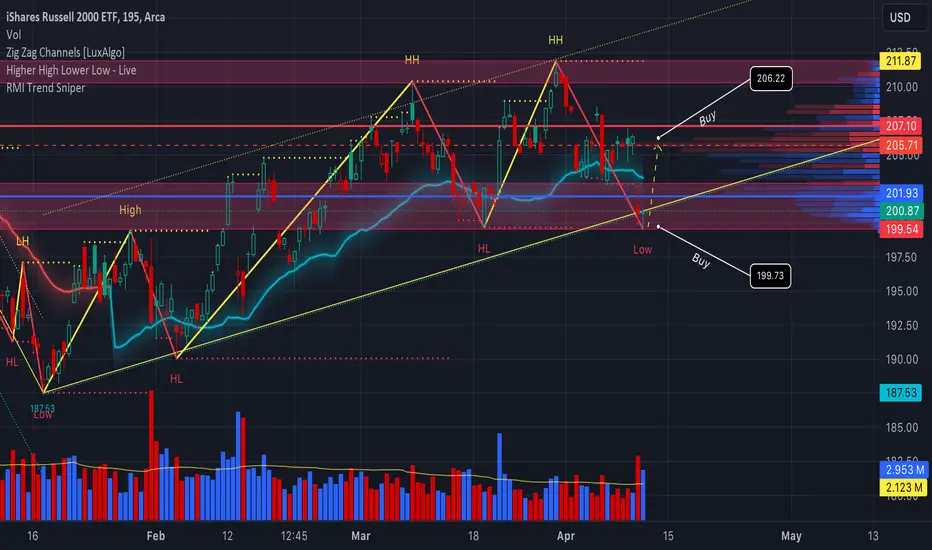
IWM - buy at the key supporthi Traders
IWM looks kinda bearish and we're seeing a lot of selling pressure on both on daily , weekly and monthly timeframe.
Our strategy is to play the bounce from the key support level which is shown on the chart.
If this key support level fails, most likely we will see more downside on IWM.
Entry, target and stop loss are shown on the chart.
Good luck

Long Small Caps via TNATok a small long position on small caps by buying shares of TNA. Very small position.
IWM/SPY, high probability resistance, 26.decIn 26th dec, there was a high probability weakness in IWM based on this graph.
Top of BB's and impulse has no potential, yet important resistance/break out.
//rising TNX is bad for cyclicals or small caps.

Watching for IWM to bounce off support
IWM is currently in a strong accumulation area based on the volume profile delta. The indexes were a bit oversold after yesterday's CPI report and FOMC minutes, leading to a bounce in the afternoon. I am skeptical as to whether today's PPI report and fed speakers will have the same effect so I closed my puts. Here is my reasoning:
VIX keeps rejecting above $16.25. If it does not move up sharply at market open, I expect it to reject again and move back down towards $13.00.
The 10y bonds chart looks like yields have topped out for the week after hitting the R3 fib pivot point. I see it retracing down the channel until next week.
Same situation with the Dollar.
I expect a small rally into the weekend or early next week. Timing will depend on the reaction to today's PPI report. I'd like to see a dip in the morning so I can minimize risk in case there is not enough momentum to get to $206. I expect some choppiness there so we can either continue moving up next week or head for new lows.
Also thinking this looks like another bullish wedge on NYSE..
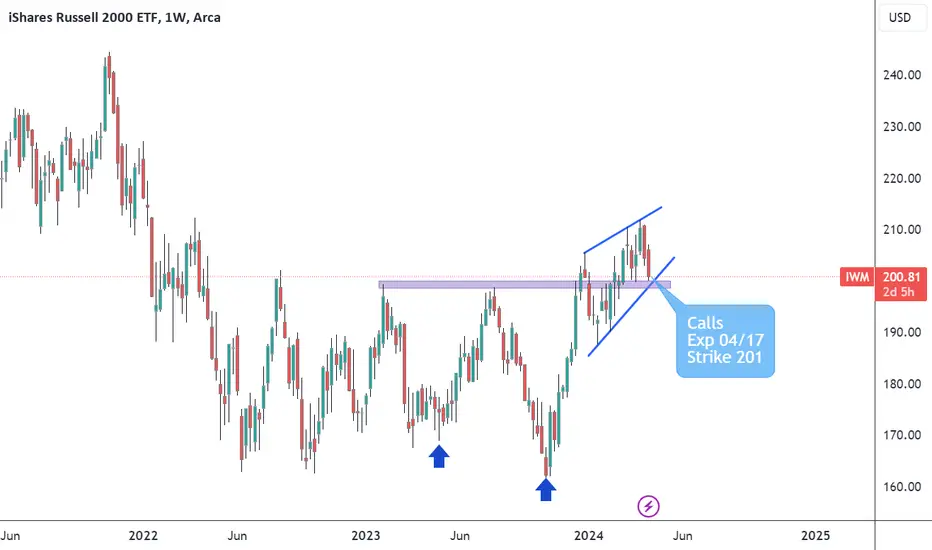
Calls Russel 2000Price is landing on an important support zone, weekly support. I'm buying calls as shown. I think the double bottom pattern still active, and this is just a test of the broken resistance at 200.
Timing the market. IWMWhat we know? Oil is likely bullish in 2nd Half (24'). BTC leads the small caps. TNX usually works as a head wind (and has took a pause). Rate cuts are very bullish for small caps and financials benefit in this environment?
technically; the 20dma works as a driver. 50dma and 200dma just gives you context. You can add MACD to confirm things.
Im speculating that small caps breaks out in mid April.
U can fact check using IWM/SPX.

Small Caps take the lead. 50% gains ahead for $IWMCredit to Mr. Tom Lee for this one. Small caps are at a multi-decade low in value relative to the S&P. The Fed beginning to cut will be the catalyst for a huge move in the Russell over the next 12-18 months
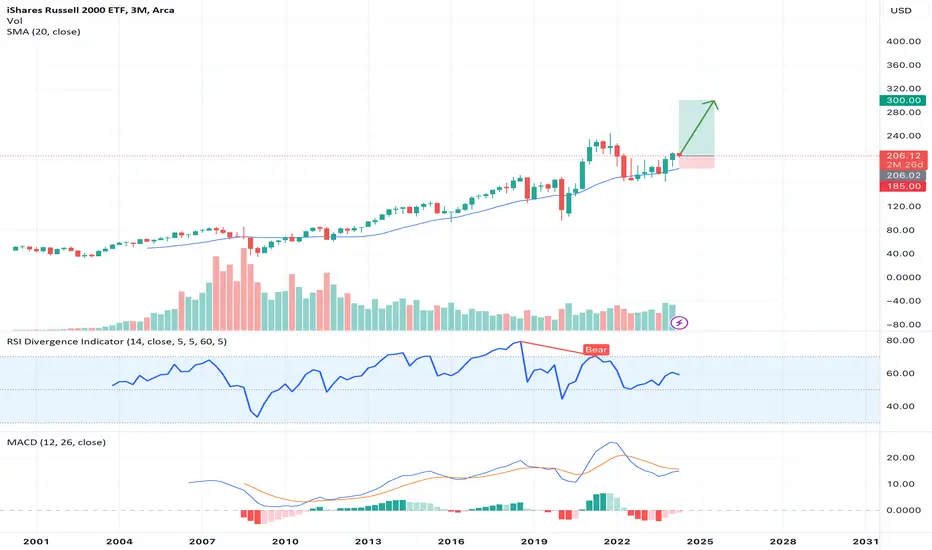
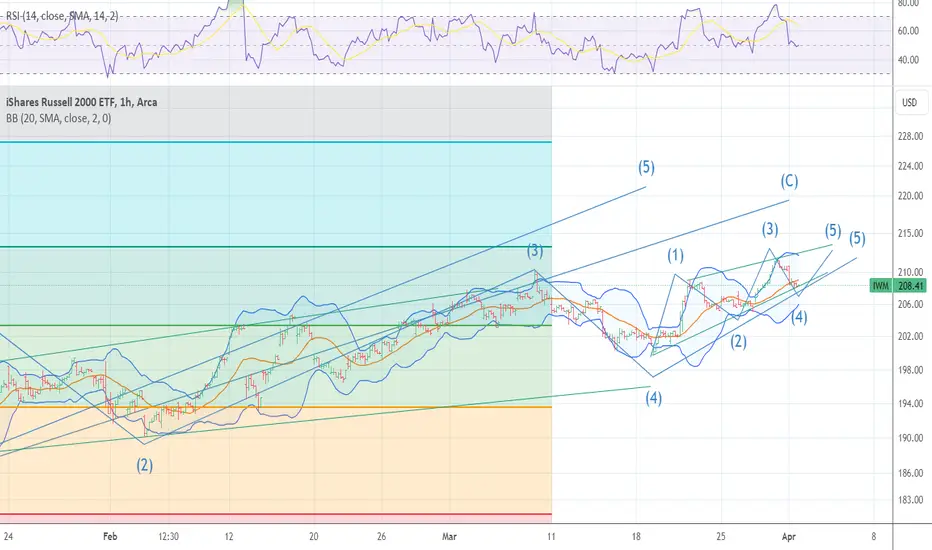
IWM 5of 5 of 5 to .618 213.2 /212.9 Panic is nearing The chart posted is the IWM since the late oct 2023 low at that time my work and models calle for a 5 wave rally in wave C up since that low we have had more and more talking of an UPSIDE MELTUP and that the place to be loading up long is the IWM with some many talking a gain of 50% and to see 300 . Well I can tell you that has a 2 % chance . We are fast approaching the 5th of 5 in what is a diagonal and into the target of .618 .I personal thing we are going well below 131 and are already in recession what has been happening in the MACRO side is the monetizing of the treasury debt to fund it thru T bill markets and to add Liquidity >I am moving to a 100 % full short in IWM in in the money puts if we have any new high this week
$IWM - Breaking out!AMEX:IWM is breaking out. It is heading towards $230!
Stocks in the Russell 2000, like NASDAQ:RKLB and NASDAQ:SOFI , have yet to see IWM gains. But soon, they will get their time in the spotlight.


Opening (IRA): IWM June 21st 180 Short Put... for a 1.82 credit.
Comments: Targeting the shortest duration <16 delta strike paying around 1% of the strike price in credit to emulate dollar cost averaging into the broad market. There is no July contract yet, but June is still paying at <16 delta ... .

More downside needed for small capsAMEX:IWM TVC:RUT CAPITALCOM:RTY small caps hit major resistance (the yellow zone) and finished the day with a shooting star candle. More downside is needed. This syncs with other indices NASDAQ:QQQ AMEX:SPY

IWM Russell2000 11% UP ?Russell 2000 index - exit from channel towards long, above average 150, depends on the drop in interest rates in the US, potential increase 11% & more.
Only an idea and not a recommendation for trading!

IWM liking this chart alot, leaning towards downside but in this market gotta be prepared for anything. entry sl on the chart hopefully itll pay both ways

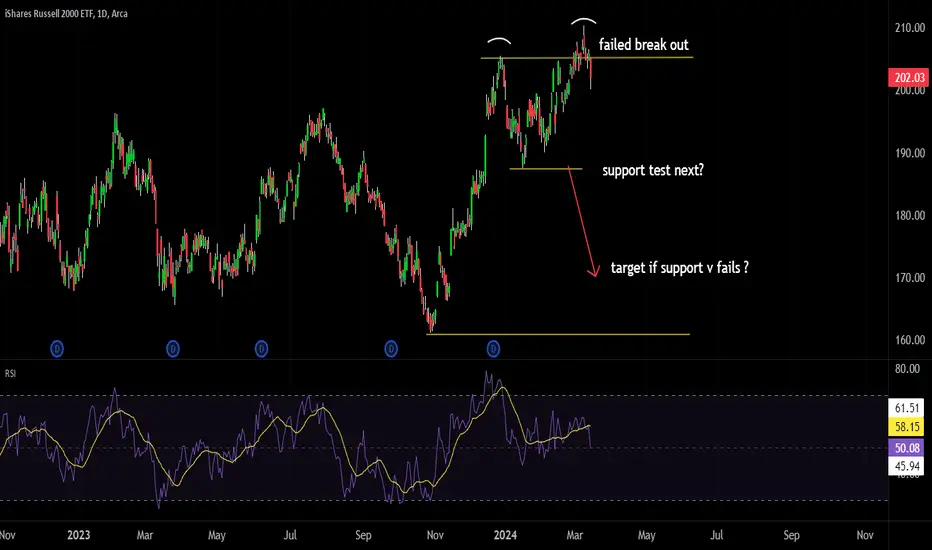
IWM Russell showing double top, support tests next?double top pattern in play after IWM and RUT failed to breakout higher with the rest of the large cap indices.
patterns alone can be deceiving, but fundamental risks support this double top thesis.
banks risks, higher costs from supply chain constrains and or inflationary costs in play.
Higher rates may be finally hitting consumers and businesses as an extra cost in all forms of funding.
6 month to 1 year bear spreads make sense hear, so do deep in the money puts. For long positions, I would consider stops to protects down side in case it continues.
IWM Canary in the coalmine 5th wave diagonal still formingTOPThe iwm the index most quoted this year to move up %50% by most of the Talking wall cnbc well now trick and trap is now setup to take the $

Opening (IRA): IWM June 21st 169 Short Put... for a 1.63 credit.
Comments: Laddering out at intervals, targeting the <16 delta strike paying around 1% of the strike price in credit to emulate dollar cost averaging into the broad market.
Will start looking at adding in shorter duration if I can get in at strikes better than what I currently have on.

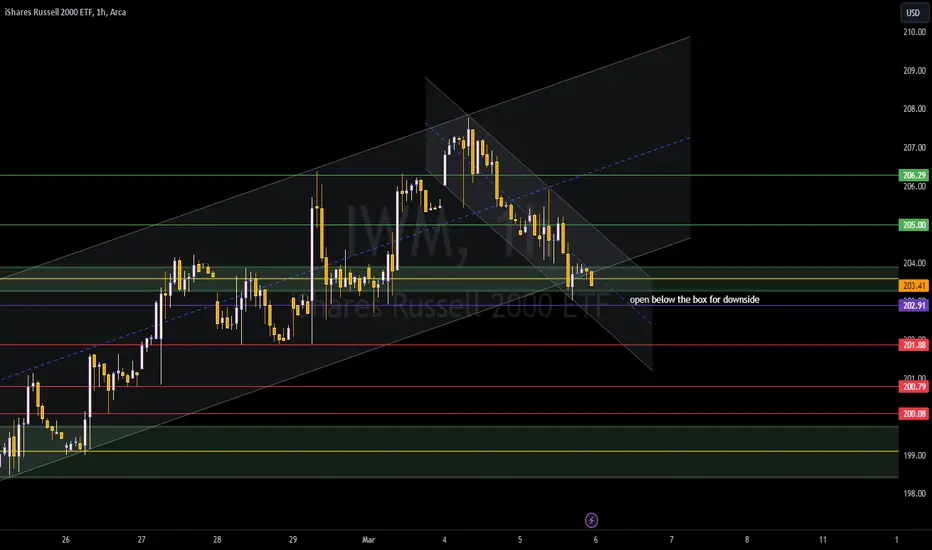
IWM looking bearish?below the box we fall, in the box we range, above the box we reclaim the trend. am new to this style of trading. if you see something i dont, feel free to let me know.
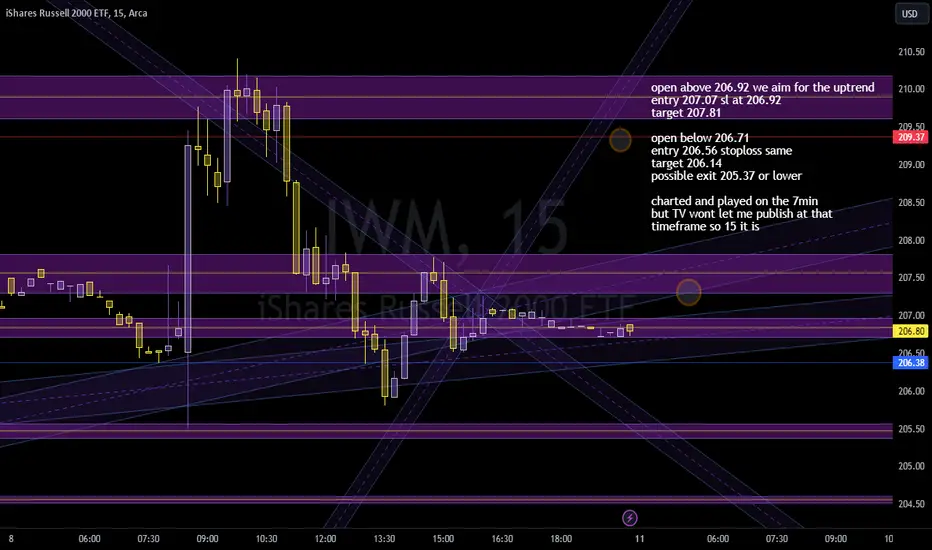
IWM looking for empty spaceview the chart on the 7 min and it makes more sense, at least to me. smaller timeframe channels like to respect each other. maybe its a new thing maybe its not but its new to me. really interested in how this plays out. premarket tells all
IWM IWM, the ETF tracking the Russell 2000 index, is exhibiting a noteworthy alignment with the parabolic SAR indicator, indicating a potential momentum shift or trend continuation. Given this alignment, investors should maintain a keen focus on IWM's price action and behavior. Moreover, the upcoming release of the Consumer Price Index (CPI) data may serve as a significant catalyst, potentially influencing market sentiment and driving further movement in IWM. As such, market participants should closely monitor both technical indicators and fundamental data to anticipate and respond effectively to potential price movements in IWM.
