Calculating Options Expected Move I had a request to go over how to calculate the expected move from options.
As well, I posted my own indicator that does the calculations for you.
So, I decided to go over both, the theory and process for calculating the expected move from options and also the indicator and how to use it.
Hope you find it helpful!
Safe trades everyone!
IWM trade ideas

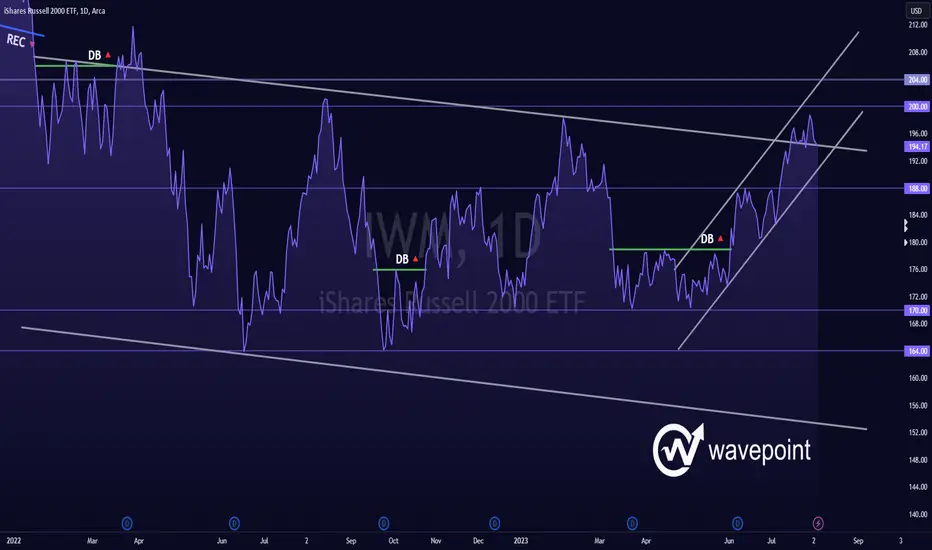
IWM - Rising Trend Channel [MID-TERM]🔹Breakout resistance 179 in double bottom formation.
🔹Approaches resistance at 198 potential NEGATIVE reaction; upward break POSITIVE.
🔹Technically NEUTRAL for medium long term.
Chart Pattern;
🔹DT - Double Top | BEARISH | 🔴
🔹DB - Double Bottom | BULLISH | 🟢
🔹HNS - Head & Shoulder | BEARISH | 🔴
🔹REC - Rectangle | 🔵
🔹iHNS - inverse head & Shoulder | BULLISH | 🟢
Verify it first and believe later.
WavePoint ❤️
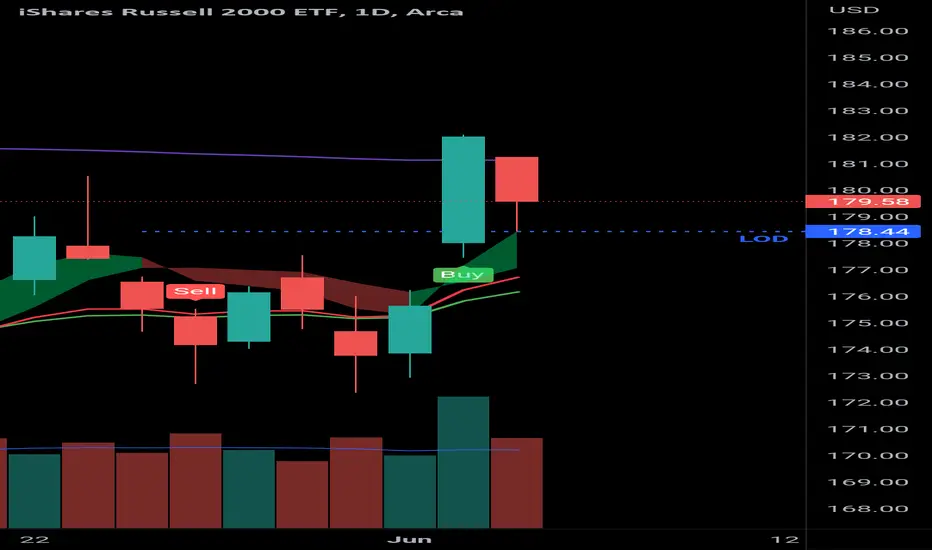
IWM ema strategy13 ema crossed up over the 21 ema on the D TF Thursday June 1st.
price crossed the 200 ema on the 4hr TF with above average volume on June 2. Missed my entry, but still opportunity for retest of 200 ema and will enter a paper trade.
Will close on the 13/21 ema cross sloping down and price under 200 ema on 4hr TF with above average volume.
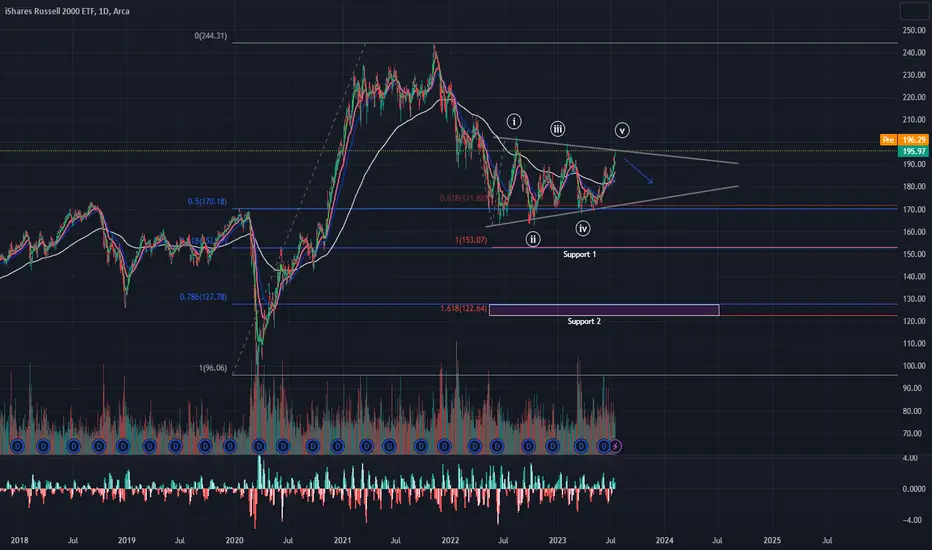
IWM Symmetrical Triangle Hi all, this morning I want to make a post on IWM, one of my personal core holdings. For those who do not already know, IWM tracks the Russell 2000, which is a collection of the top 2000 small-cap US equities.
Fundamentally, we are beginning to see default rates jump within smaller companies and poorly equipped balance sheets not being able to handle the pressure. Looking at the sector weightings, I see 16% tech, 16% healthcare, and 15% industrials. These industries rely on debt for a large majority of their growth. Lots of small-cap companies rely on floating-rate debt (interest payments rise with higher rates) due to creditors wanting higher yields for taking on the perceived risk. Also, lots of these 'cheap money notes' are beginning to mature and will continue into 2025. When these companies need to acquire new debt, creditors will either A. require much higher yields than before or B. not provide any debt whatsoever.
Yields are a huge driver for growth.
Technically, I'm seeing a symmetrical triangle pointing to the downside. As we've completed a 5-wave move, we could see a sharp downturn for IWM.
Monday Market Update: SPY, QQQ, IWMHey everyone,
Posting my Monday market outlook.
Targets are as follows:
SPY:
Bullish Condition: 358.36
Bearish Condition: 456.18
High target (if bullish condition) 464
Low target (if bearish condition) 450
IWM:
Bullish Condition: 197.58
Bearish condition: 195.99
High target (if bullish condition) 200
Low target (if bearish condition) 192
For tech, I am looking at 385 to the upside.
If that is broken the immediate targets are 389 followed by 391.
If we break to the downside, the targets are 378 followed by 375.
My thoughts,
Safe trades!

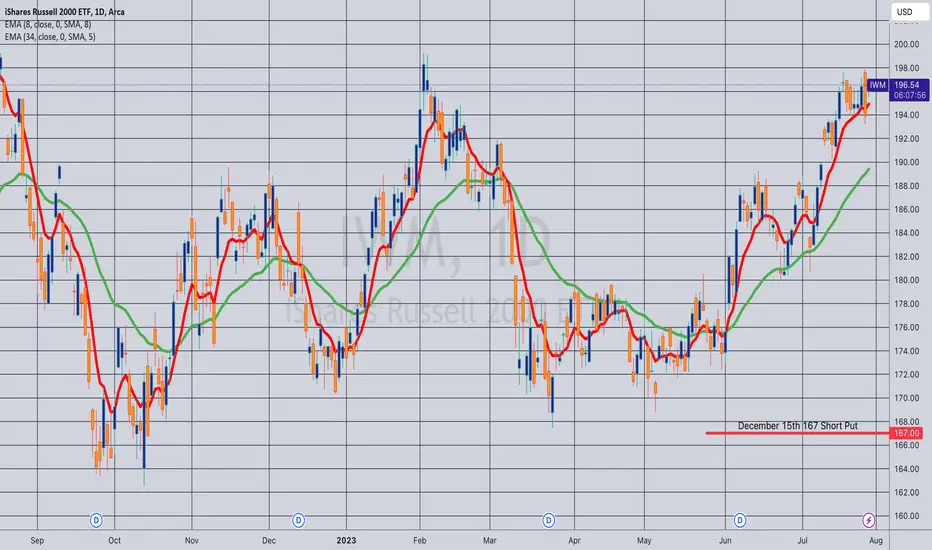
Opening (IRA): IWM December 15th 167 Short Put... for a 1.74 credit.
Comments: Going ahead and rounding out my broad market fourth quarter rungs here with an eye to adding in shorter duration if we ever get higher IV.
Targeting the <16 delta strike paying around 1% of the strike price in credit to emulate dollar cost averaging into the broad market.
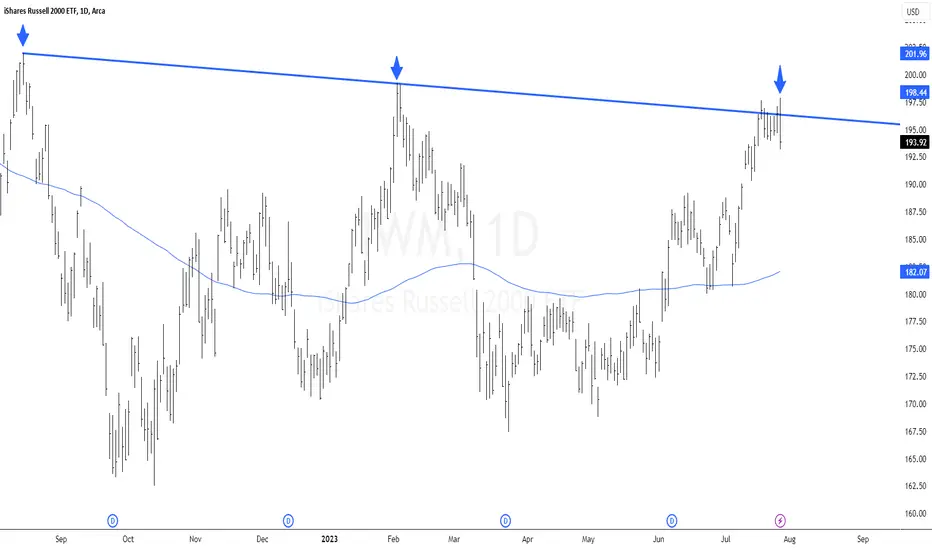
$IWM Trend Line TestAMEX:IWM Trend Line Tested
The Russell 2000 index tested its trend line today. This is a significant level, as it is the second time that the index has bounced off of this trend line in that started last year in August 16, 2022.
IWM Bearish Engulfing +5 CandleThe IWM ETF which tracks the Russel 2000 index put in an outside reversal, or bearish engulfing, candle today which eclipsed the 6 prior daily candles. When the body of a price candle completely engulfs the prior candle it is called a bearish engulfing candle. Since todays candle also engulfed the 5 candles prior to yesterdays it is called a bearish engulfing plus 5 candle(BE+5), for a total of 6 candles that were eclipsed by todays candle. The more candles that are engulfed by an outside reversal candle the more bearish the move and outlook.
Raising your stop-losses and/or taking some short bets against the market isn't a bad move here on an outside reversal day like today was, especially if markets close down going into the weekend. If markets close red on a Friday, they tend to close red the following Monday as well.

Market Updates: SPY, QQQ and IWMMarket update for the S&P (SPY and ES), the NAS (QQQ, NQ1!) and IWM.
Just my thoughts, not advice.
Safe trades!

Opening (IRA): IWM November 17th 170 Short Put... for a 1.74 credit.
Comments: My weekly IWM short put in the shortest duration contract where the <16 delta is paying around 1% of the strike price in credit to emulate dollar cost averaging into the market without actually being in stock.
The fact that I'm having to go out to November to do this is a testament to how crappy premium is at the moment, but will look to add in shorter duration should we get an uptick in volatility and/or weakness.

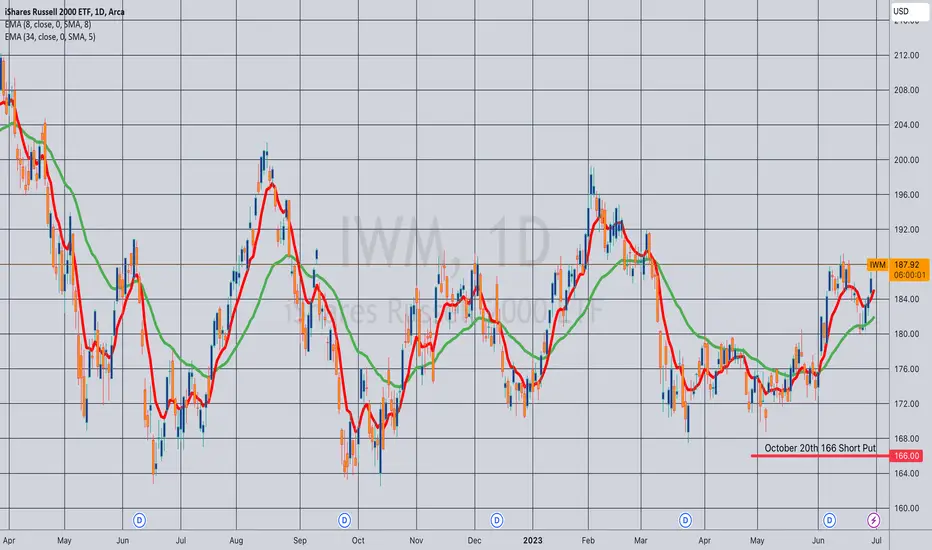
Opening (IRA): IWM October 20th 166 Short Put... for a 1.73 credit.
Comments: Targeting the <16 delta strike in the shortest duration paying around 1% of the strike price in credit to emulate dollar cost averaging into the broad market.
As usual, will look to add in shorter duration and at lower strikes if we ever get an uptick in volatility at some point.
Technical and digital analysisWe notice that we have a divergence, and then we are in a correction to go down

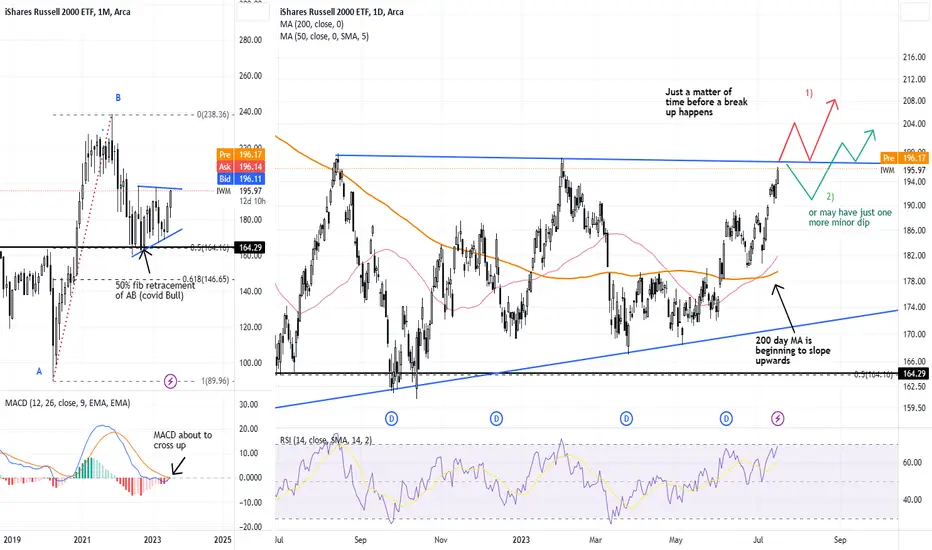
IWM - joining the bull party soon?Bull cycles usually start with heavy weight stocks (especially those in technology and discretionary) taking the lead, with small-caps usually joining the party at a later stage and when this happens, the bull run will be a lot more obvious by then.
The IWM (tracking 2000 small-cap stocks) had been stuck in a wide-ranging wedge since hitting a low in June 2022 and with this we experienced huge volatility when we attempted to long these stocks despite that they looked to have bottomed out.
A look at the monthly chart showed that the MACD is about to switch into the positive territory for the IWM, a significant indicator that it's longer-term outlook is starting to look bright(er).
On its daily chart, the 200-day moving average has even begun to exhibit a subtle upslope. Hence, I am hopeful that the IWM will be breaking out of the wedge above 198 in the near future (perhaps within a few weeks if not days).
It is no surprise that more and more of the smaller stocks are beginning to break up, despite that some still experienced a lot of volatility that could be difficult to sit tight. However, having a clearer vision of its longer-term outlook should give some confidence to dip our toes in for stocks with the right technicals and even if we were shaken out, the confidence to retest our entry when the technicals line up again.
Disclaimer: Just my 2 cents and not a trade advice. Kindly do your own due diligence and trade according to your own risk tolerance and don't forget that money management is (probably the most) important! Take care and Good Luck!
Opening (IRA): IWM October 20th 159 Short Put... for a 1.61 credit.
Comments: Targeting the <16 delta strike in the shortest duration paying around 1% of the strike price to emulate dollar cost averaging into the broad market.
$IWM July 14, 2023AMEX:IWM has my favourite patter.
Wedge
Double bottom.
second bottom lower than first.
Oscillator divergence.
looks good for 199.
Clos open above 201 very bullish.
But now a days index are behaving like stocks so i expect a good move here.

Opening (IRA): IWM September 29th 164 Short Put... for a 1.69 credit.
Comments: Selling premium in the shortest duration where the <16 strike pays around 1% of the strike price in premium.
This is less than ideal; you generally want to sell on weakness/higher IV, but am looking to keep theta on and burning. Will naturally look to add rungs in shorter duration/higher IV should the <16 strike start to pay.

IWM Russel 2000 - No Love For Small CapsI hadn't really looked at IWM until a follower asked me about it on Twitter, and after thinking about it for a few hours and comparing it against SPY and QQQ, I realized that it's not that IWM is lagging, it's that it's not going to follow the recent mania.
Some wisdom I heard recently is that breadth is important in markets because it indicates a large amount of liquidity has entered or left, indicating the emergence of new bull and bear markets.
Unfortunately, with the exception of Friday alone, breadth has been terrible in this debt ceiling crisis pump, which means even though Nasdaq is flirting with 15,000 and SPX with 4,300, it's a bullish impulse within bearish macro conditions.
There's a lot of trouble on the horizon with the 2024 Presidential Election close enough that the game has to played and the trouble brewing in mainland China with the Communist Party being about to fall and the globalist bloc struggling to either cuckold or depose Xi Jinping.
What a bullish impulse in a bearish macro framework means for small caps is that although Microsoft, Nvidia, Google, Tesla, Amazon, Apple might pump, liquidity is not going to be going "risk on" on small caps and zombie corporations.
Instead, prices will be driven lower because as they sell the cycle highs in the blue chips, they'll be bidding a portion of their profits with lowball asks on small caps for the purposes of pumping them, and then dumping them, on retail's head after interest in the big names has become exhausted.
Those very large lowball asks will lead the algorithms to drive price towards them because the algo is designed to generate volume.
But on small caps, unless the company has significantly exceptional fundamentals, your expectations on how high it can go and how long it can go for during a reversal will have to be quite reserved.
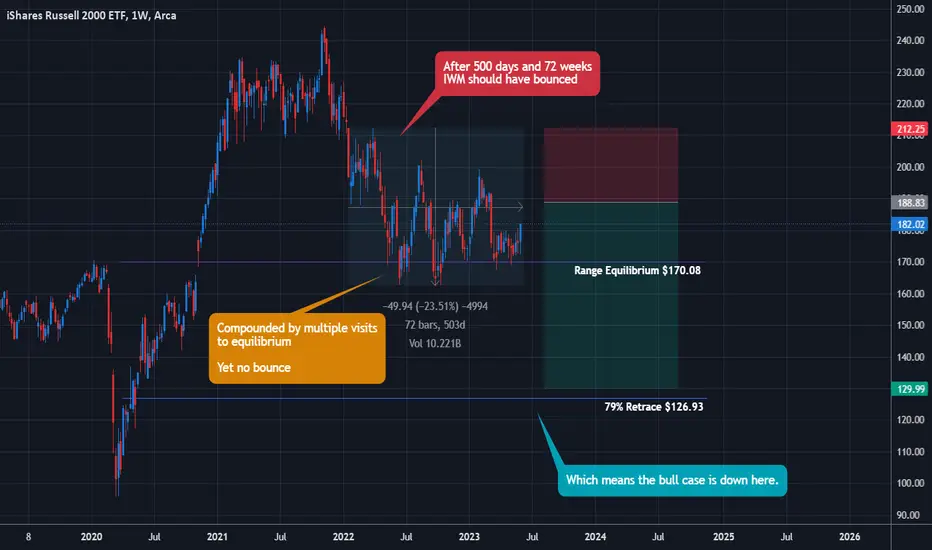
In other words, if you missed the July '20 to October '22 pump on IWM then you missed the train and it's never coming back.
It is what it is. Just accept it.
You can make a lot of money trading puts on this thing on the way down.
It just means that if it really does bounce around $125, your expectation for where it can bounce to shouldn't be a new ATH, but probably back to $170.
Again, you can make a lot of money trading calls from $125 to $170.
But if you want to bUy tEh bOtToM fOr thE mOaSS and think you're going to get a 50 bagger instead of a "tiny little" 5 bagger, you're going to blow your account.
And if that's who you are, it's probably better you blow your account and go back to working a real job and learn the value of money again.
So here's the trade.
This recent breakout looks like it's just a consolidation squeeze. It's going down. But it might screw around for a while and could be as annoying as trading over $200 again. It's really hard to say.
Areas you'd really like to short and/or buy puts are called $188 or $190.
You'll need 4-6 months or so to get to the $127 level.
But either way, the R/R on a $188 short with a $212 stop and a $130 target is almost 7 to 1.
Go do sports betting for a while and enlighten to how hard it is to hit a +700 if you don't think that's a worthwhile trade.
You need to quit wanting to get rich quick. Getting rich isn't important and it isn't even valuable. What you need is to wake up to what's important in life and what you're really here to do.
And that question is answered in mankind's traditions and that 5,000 year old culture sitting in Mainland China after the CCP is utterly annihilated.
Opening (IRA): IWM September 29th 160 Short Put... for a 1.67 credit.
Comments: Targeting the <16 delta strike in the shortest duration where the credit received is around 1% of strike price to emulate dollar cost averaging into the broad market.
preview for the week - SPX, NQ, IWM, KREAll in the video. According to what I'm seeing in the ratio charts, IWM and KRE may lead to the downside so I'm expecting some bank news which has not hit yet. Tech will probably stay relatively strong for at least a week or more, while SPX may want to try for 4500. It's a shortened trading week, and they are usually very slow but a surprise in the regional bank sector would not surprise me.
Good luck!

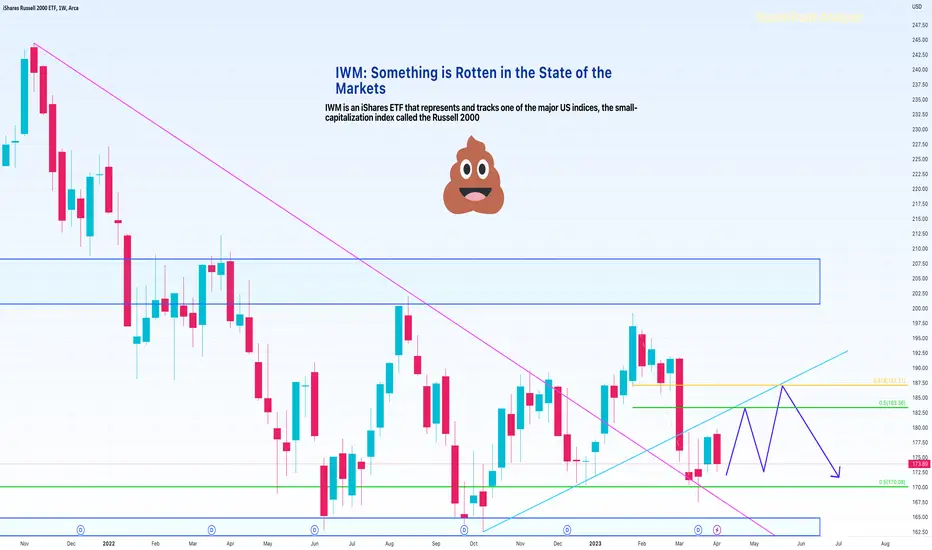
IWM: Something is Rotten in the State of MarketsPrimary Chart: IWM on a weekly timeframe with downtrend line and major support and resistance zones
Note1: IWM is an iShares ETF that represents the Russell 2000 small-cap index in the United States. Though not as widely tracked as SPX, NDX, or DJIA, the Russell 2000 ( TVC:RUT ) is one of the major US indices. It is likely the fourth most watched US index.
Note2: The phrase "something is rotten in the state of Denmark" is a well-known line from Shakespeare's play Hamlet used to describe a situation where something is wrong or even corrupt within a government, institution, or system. No corruption is intended to be implied discussed. The title's allusion to this phrase is meant to suggest only that something is off / wrong in the markets, i.e., that everything is not well despite the strength of the Nasdaq 100 lately and the support seen in SPX.
The Russell 2000 (IWM) is often a leading indicator in US markets. It led to the downside in early November 2021 after a false breakout out of its 2021 topping-pattern's resistance around $234. SPX topped nearly two months later on January 4, 2022. While small-caps are not necessarily always the first to make a move, it is something frequently cited by commentators and analysts.
The primary chart shows how IWM has struggled below the upper blue rectangular zone, a resistance / supply zone going back to highs in March and April 2022. This zone also rejected price at the end of the impressive August 2022 rally that had everyone debating whether the bull-market had returned in earnest. Lastly, on February 2, 2023, IWM was unable to even tag the lower edge of this zone, eking out a high at $199.26. The lower edge of this blue resistance zone as drawn here is at HKEX:200 - HKEX:201 approximately.
The Primary Chart above also shows an important Fibonacci support level at $170. This the 50% retracement of the entire bull market from the 2020 Covid lows to the highs in November 2021. This has also marked important support since late October 2022 (a week or two after the October 2022 lows). Notice the weekly candle wicks protruding below this line but recovering back above it.
The final point about the Primary Chart is the down TL from the all-time high in magenta. This was broken to the upside, which was one of the reasons many market participants and commentators got excited about the bear being complete. That trendline was retested in late March 2023. But despite this positive development, IWM has not acted well. In fact, it has broken decisively below a multi-month upward trendline from October 2022 lows as shown on the Primary Chart as well. This trendline was also important and signifies weakness on the decisive break below it.
On the larger scale, price is trapped between the blue rectangular zones of support and resistance. Until these break, not much progress is likely in either direction. Sideways action is likely for the coming weeks. The one thing that would negate the sideways action view is a clean break back below the down trendline from the all-time high. So keep an eye out for that development.
Next, Supplementary Chart A.1 and A.2 below shows a hypothetical illustration of how price could move sideways for the coming weeks / months before a flush below major support (if one is bearish about equities generally) or a rally above the key resistance zone (if one is bullish about equities generally). SquishTrade gives an edge to the bears in the intermediate to longer-term time frames—as long as price stays below both (1) the uptrend line from October 2022 lows, and (2) the key Fibonacci levels of the most recent decline (shown on the Primary Chart at $183.36 and $187.11).
Supplementary Chart A.1 (measured corrective move upward where the legs of the corrective move might be equal or share a 1.272 Fibonacci relationship)
Supplementary Chart A.2 (choppy sideways action that retests the upward TL from the October 2022 lows that had broken down in March 2023 before heading lower again)
Supplementary Chart B is a zoomed-out version of the major resistance and support level shown on the Primary Chart. This is intended to show the ranging action for months that has taken place despite periods of seemingly impressive strength and sharp weakness.
Supplementary Chart B
The next chart, Supplementary Chart C, illustrates what a trendline might look like if someone were considering this chart afresh, i.e., for the first time without having tracked the prior trendlines during the 2021-2022 bear market. The TL has been re-drawn to account for the recent major highs at the end of the January to February 2023 rally.
Supplementary Chart C
IWM's anchored VWAPs are not encouraging. Here, the only VWAPs considered are the one anchored to the all-time high in November 2021 (blue-purple line) and the 2022 low (orange line). Price made a false breakout above the VWAP from the all-time high and failed back below. That in itself is a negative especially given that this occurred on a larger time frame going back to 2021. Price has also failed below the October 2022 VWAP as well.
Supplementary Chart D
Finally, and most importantly, consider the ratio spread of IWM/SPY in Supplementary Chart E below . This tracks the performance of the Russell 200 relative to the S&P 500. This is why something might be rotten in the state of Denmark (markets). A healthy market should not have an index looking this bad. Let me know what you think in the comments.
Supplementary Chart E
The ratio spread shows that IWM's underperformance just broke below a key support level for that ratio. But bigger support lies below. However, the overall picture looks bleak for IWM with a downtrend line that has lasted for a while, and lower highs for the ratio's value on higher time frames.
________________________________________
Author's Comment: Thank you for reviewing this post and considering its charts and analysis. The author welcomes comments, discussion and debate (respectfully presented) in the comment section. Shared charts are especially helpful to support any opposing or alternative view. This article is intended to present an unbiased, technical view of the security or tradable risk asset discussed.
Please note further that this technical-analysis viewpoint is short-term in nature. This is not a trade recommendation but a technical-analysis overview and commentary with levels to watch for the near term. This technical-analysis viewpoint could change at a moment's notice should price move beyond a level of invalidation. Further, proper risk-management techniques are vital to trading success. And countertrend or mean-reversion trading, e.g., trading a rally in a bear market, is lower probability and is tricky and challenging even for the most experienced traders.
DISCLAIMER: This post contains commentary published solely for educational and informational purposes. This post's content (and any content available through links in this post) and its views do not constitute financial advice or an investment or trading recommendation, and they do not account for readers' personal financial circumstances, or their investing or trading objectives, time frame, and risk tolerance. Readers should perform their own due diligence, and consult a qualified financial adviser or other investment / financial professional before entering any trade, investment or other transaction.
IWM 200 soon not so far fetchedOn the weekly, IWM gives credence to bearish bias, however, if we look at the daily chart, there is also a good technical case for a potential run to 200.

Opening (IRA): IWM September 15th 153 Short Put... for a 1.60 credit.
Comments: Selling premium in the shortest duration where the <16 delta strike is paying around 1% of the strike price in credit to emulate dollar cost averaging into the broad market.

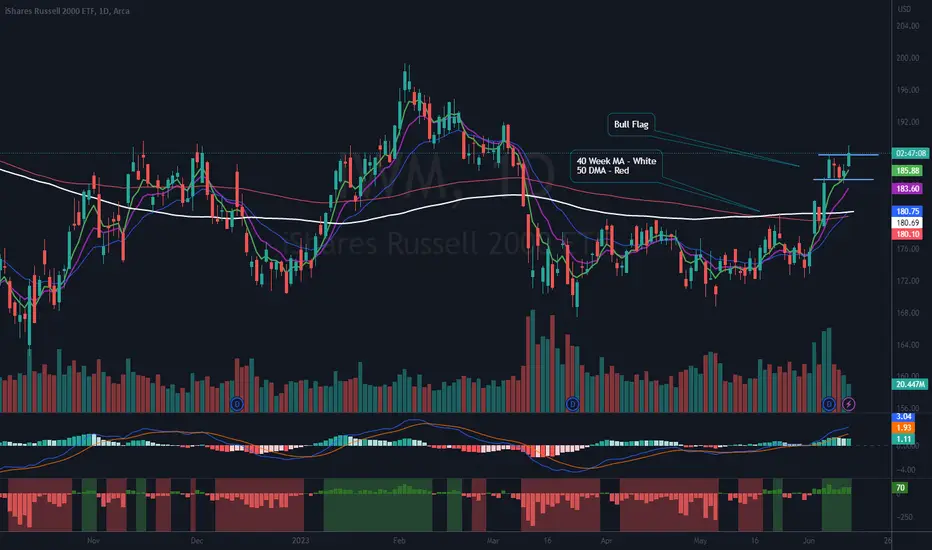
$IWM – Bull Flag Breaking Out?Hooray for small caps! It is looking to me like AMEX:IWM (Russell 2000 small cap ETF) is ready to participate in the newest market rally. This is great news as it shows the market is broadening with more participation. I do not have a position yet, but I am looking to start one if this keeps showing strength. I may even use the 3x levered AMEX:TNA as a booster. (Cannot hold levered ETFs too long as they are geared for day trades). Ideas, not investing / trading advice.
You can see I have outlined the Bull Flag as well as important moving averages. On the lower part of the chart, you can see the Volume has picked up, the MACD is rising and the indicator at the bottom shows market new highs new lows (new highs are green days).
I hope this helps someone. Thanks for looking. Constructive comments always welcome.