Russell 2000 Order Flow: Bullish Pattern ActivatedHey traders,
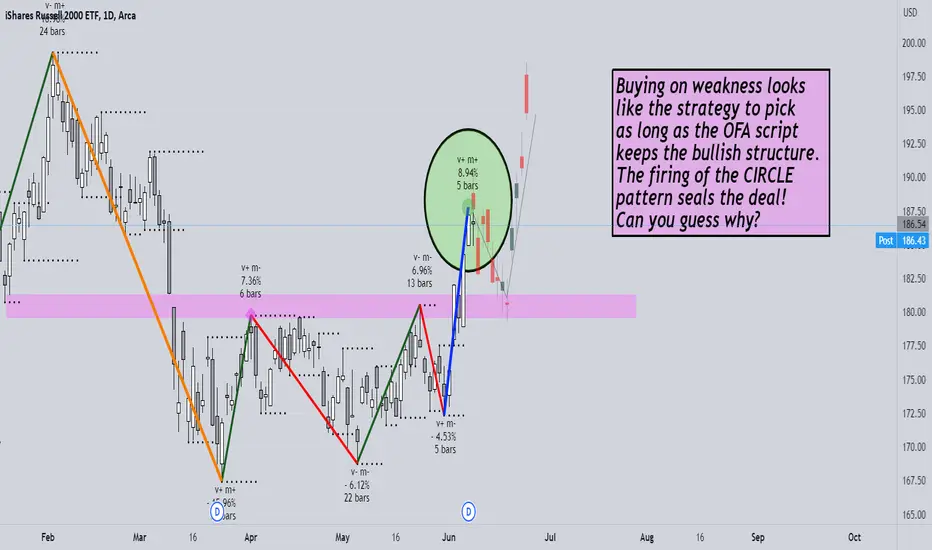
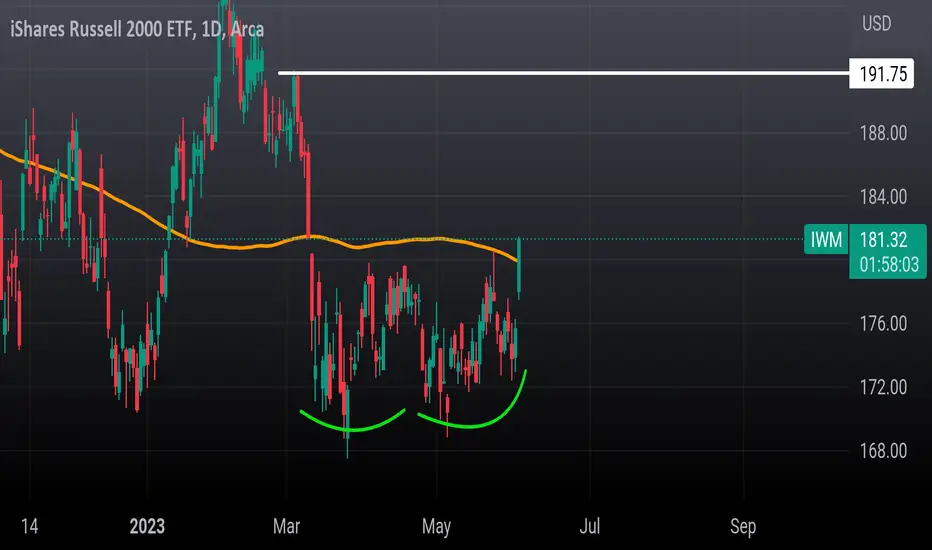
In today’s analysis, it’s hard to ignore IWM following the 🚀explosive🚀 8%+ move up.
Let’s unpack the action as of late via the OFA script :
To do so, I am NOT going to apply any subjective type of analysis such as crawing trendlines, counting waves based on what way the wind blows, or any other form of guessing…
Instead, we let the formation of fractal structures (an objective measure of moves) create the pathway from which we can all make decisions.
Fortunately, there is no need to engage in laborious manual work. Why? The OFA script has all of us covered. So, with that in mind, what can we observe in the IWM market?
What recurring pattern do you notice? Clue - Pay attention to the visual CIRCLE feature in the last leg.
These patterns entail, “dynamic fractal-based order flow cycles where a decreasing involvement in one direction (depicted by cycle/wave/line counts) is followed by a predictable move in the opposite direction with greater commitment seeking out the next equilibrium area, in most instances, with potential profits as a by-product thereafter…”
If you are into disseminating order flow, nothing I’ve seen beats the objectivity in analysis one can carry out via the formation of structures derived off fractal structures.
So, how are you going to profit from the latest pattern printed? I know how I will...
Remember the two key main features of the OFA script:
Magnitude: A major clue that will help determine the health of a trend is the type of progress by the dominant side in control of the trend. We need to ask the following question: Are the new legs in the active buy-sell side campaign as identified by the script increasing or decreasing in magnitude?
Velocity: When it comes to the distance the price moves, the magnitude is only ½ the equation. The other ½ has to do with the velocity of the move or the speed. Was the new leg created after a fast and impulsive move? Or did price make a new low or high with the movement being sluggish, compressive and taking too long to form? A good rule of thumb is to count the number of candles it took to achieve a new leg.
DISCLAIMER: This post contains commentary published solely for educational and informational purposes. This post's content (and any content available through links in this post) and its views do not constitute financial advice or an investment or trading recommendation, and they do not account for readers' personal financial circumstances, or their investing or trading objectives, time frame, and risk tolerance. Readers should perform their own due diligence, and consult a qualified financial adviser or other investment / financial professional before entering any trade, investment or other transaction.
IWM trade ideas
IWM - Perking up?Small caps have moved up to resistance. With Friday's move and todays move my guess is that the next move will be a consolidation of the almost 7% move in the last week. Volume has picked up but I wouldn't be surprised if there is just as much selling as buying into this lift. Economic factors do not have me pounding my fist to buy the most vulnerable companies out there. Typically small caps lead in a new bull market and not at the end of a cyclical bull inside a secular bear. My guess is to fade this move. I think markets want people to believe that the rally is broadening out and will pull the rug out on everything soon. Call me skeptical but I'm not in IWM until resistance is broken and there is a successful retest of the breakout.

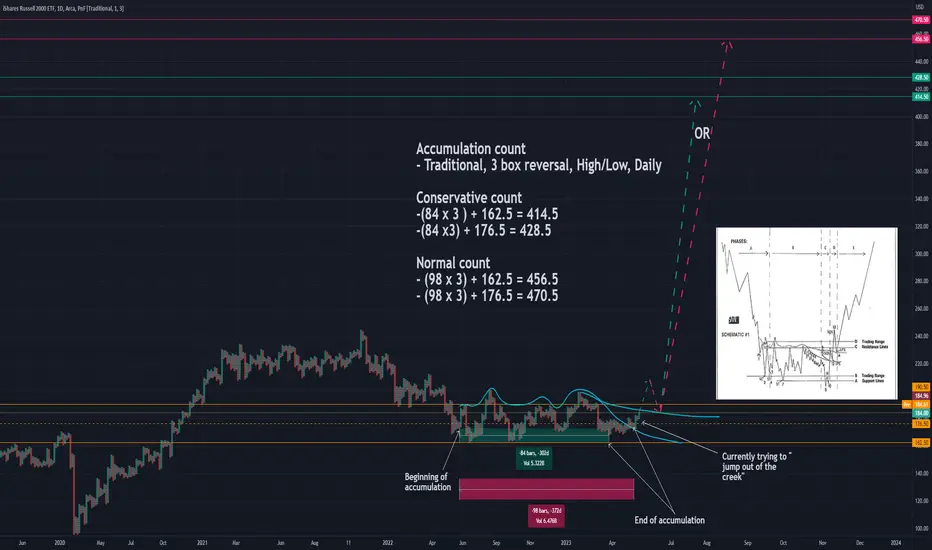
IWM is going much much higher based on latest accumulation countThis idea is based on Wyckoff's accumulation schematic. The current accumulation count yields a much higher IWM target. All info is on the chart. Good luck.

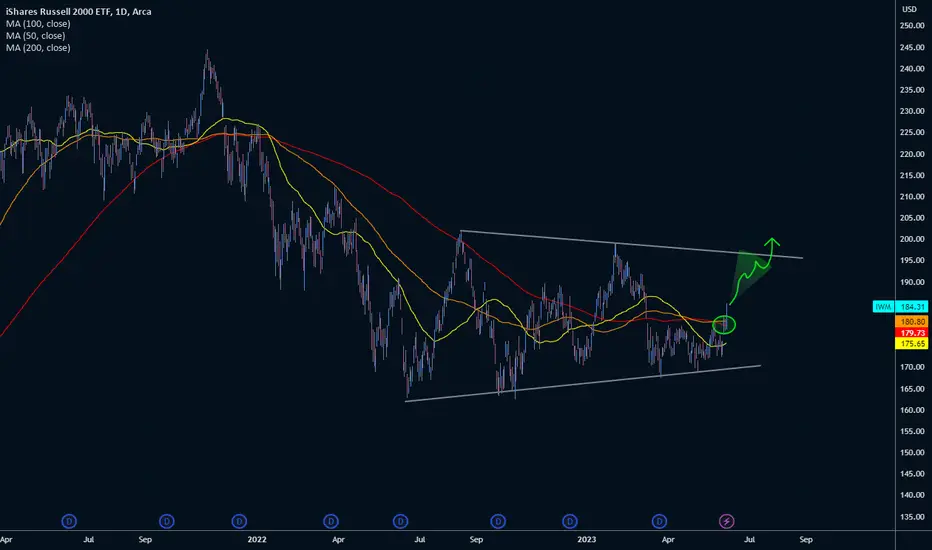
Small Caps Are BackDon't miss out on the rest of the run just because you missed the first move.
*** Price action breaking above the 200 moving average after a healthy move that sustained
*** Plenty of head space to upper resistance
*** Lagging SP500 and NASDAQ
Opening (IRA): IWM September 15th 146 Short Put... for a 1.46 credit.
Comments: Re-establishing a September rung after scratching out a higher strike trade yesterday, targeting the <16 delta strike paying around 1% of the strike price in credit to emulate dollar cost averaging into the broad market.
The shortest duration trades in which the <16 delta strike is paying around 1% in credit:
IWM: August (at the 154 strike, paying 1.58)
QQQ: August (at the 296 strike, paying 2.99)
SPY: September (at the 367 strike, paying 3.70).

Opening (IRA): IWM August 18th 154 Short Put... for a 1.60 credit.
Comments: Targeting the <16 delta strike in the shortest duration paying around 1% of the strike price in credit to emulate dollar cost averaging into the broad market. Would like higher IV to sell shorter duration in, but you can't have everything.

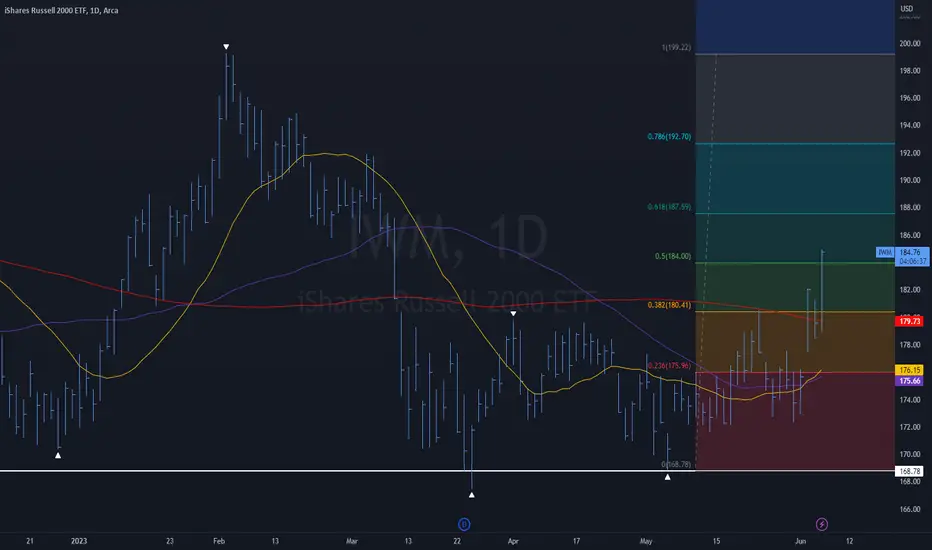
$IWM Pierced 50% Fibonacci levelAMEX:IWM has a lot of bank stocks in the #russel2000 and is up over 2% today. Pierced the 50% Fibonacci level today. This tells me the #Federalreserve will pause tomorrow. #jeromepowell
Stock Chart Analysis 101, Recognize the PatternsIf you check my previous post about AMEX:IWM you will see that I signaled the potential for a lower high here. This is no confirmation of that being correct just yet. I just thought the opening of the week was extremely interesting.
Check out the Equity Channel Podcast on Apple, Amazon and Spotify for more information on trading and investing.
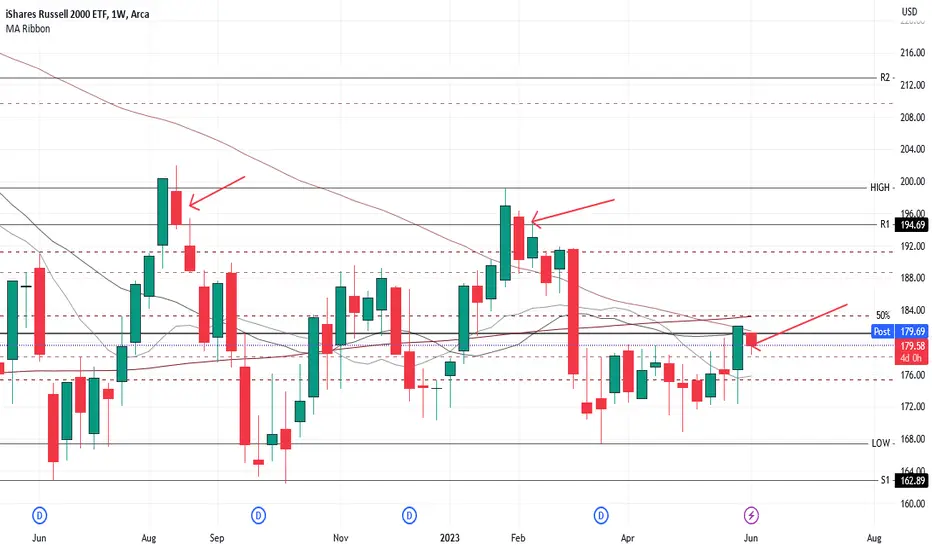
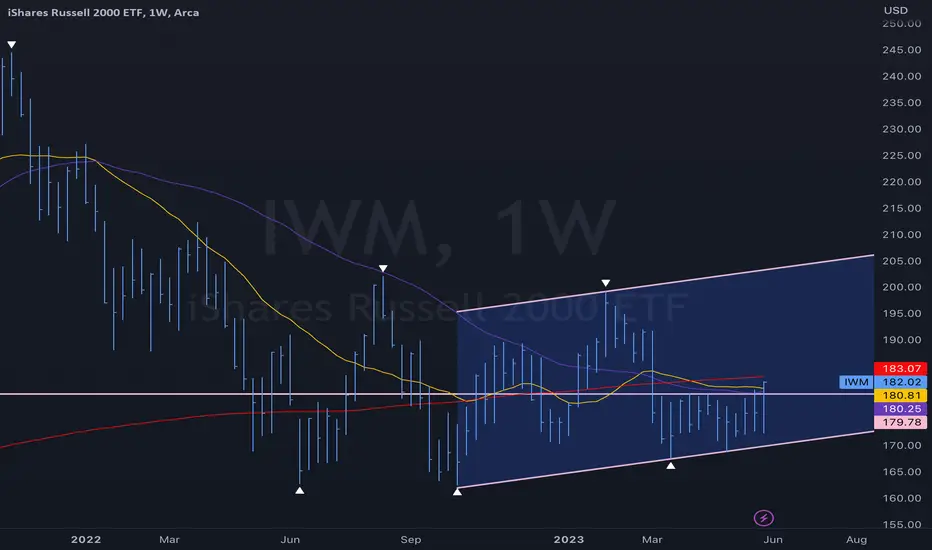
$IWM beginning of an uptrendAMEX:IWM beginning of an uptrend. #russel2000 Closed above the horizontal line and above the 20 and 50 weekly moving averages. Now it needs bullish consolidation and a retest of the horizontal line before it can break through the 200 weekly moving average.
Is This Another Lower High Incoming for Russell 2000?Check out the Equity Channel Podcast for more insightful trading and investing ideas.
Listen Here:

$IWM - Local technical breakout. Is it the right time to long?AMEX:IWM
Daily: Golden cross in process, however not happened yet.
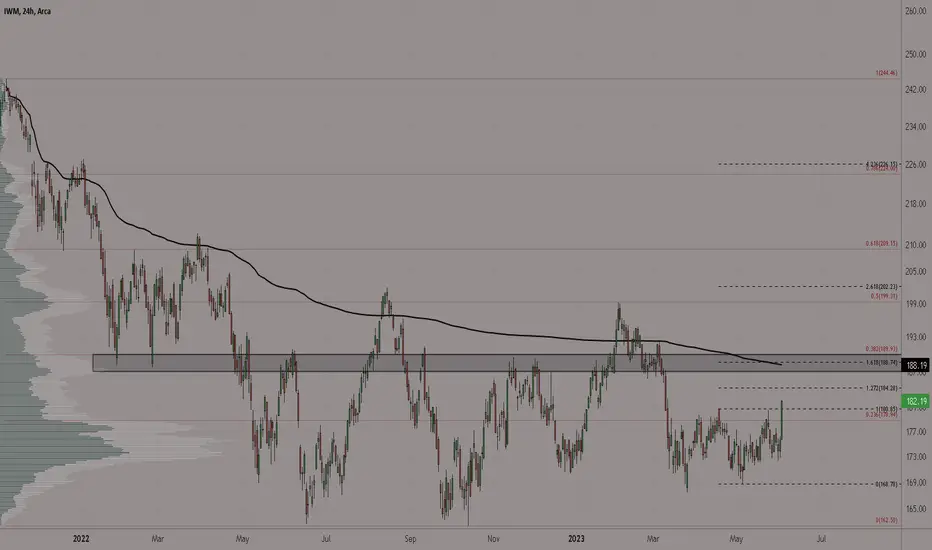
Overall bulls are not in control yet below 189/190+. AVWAP at 188.19
Short-term, bulls legitimately succeeded to trigger a technical breakout at 180.85 with volume!
As long as 180.85 hold, price should head into 184.28, 188.74, 189.93 (breakout > 199.31).
WEEKEND UPDATE JUNE 4 2023 - SMALL CAPS JOIN THE PARTYMacro
2/10 YR CURVE - Inverted = -.81 (More Negative from -.74 last week)
HIGH YIELD SPREADS = 4.65 (Up from 4.58 last week)
US ISM PMI - Contracting Faster = 46.90 down from 47.10%
US ISM SERVICES - Growing Faster = 51.90% up from 51.20%
S&P 500 ( SPY ) - Investable
Nasdaq100 ( QQQ ) - Investable
Russell2000 ( IWM ) - Investable
Gold ( GLD ) - Investable(Pullback)
US 30yr Treasury Bonds ( TLT ) - Not Investable
US Dollar ( UUP ) - Investable
US Real Estate ( IYR ) - Not Investable
European Equities ( VGK ) - Investable(Pullback)
India ( INDA ) - Investable
Broad Asia Equities ( VPL ) - Investable
China A-Shares ( ASHR ) - Not Investable
Emerging Markets ( EEM ) - Investable (Pullback)
Wheat Futures (ZW) - Not Investable
Corn Futures ( ZC ) - Counter Trend Rally
Soybean Futures (ZS) - Not Investable
Silver ( SLV ) - Investable(Pullback)
Natural Gas Futures ( NG ) - Not Investable
Volatility Levels
S&P 500 - 14.60 - Investable Market (Down from 17.95 last week)
Nasdaq100 - 19.29 - Investable Market (Down from 22.21 last week)
Russell2000 - 20.88 - Investable Market (Down from 23.51 last week)
S&P 500 Volatility Structure - Normal Contango Structure
VIX 9-Day - 12.74
VIX Short Term - 14.50
VIX - 14.60
VIX Long Term - 14.79
Now, here is the list of individual ETFs and individual names are showing strength.
Strongest of our ETF universe
SVIX
SMH
XLK
QQQ
IGV
IWF
NIB
ARKF
ARKG
XLY
QUAL
EWJ
Strongest of our ETF Leveraged/Inverse Funds
KOLD
TQQQ
SOXL
QLD
SDP
KORU
WANT
SPXL
SPUU
RXD
INDL
Strongest of our Individual Equities
MDB
NVDA
META
AMD
CFLT
MRVL
AVGO
HUBS
EXAS
BLDR
GOOGL
NOW
SNPS
MSFT
CPRT
NET
AMZN
NFLX
ADBE
LRCX
TTD
RCL
SHOP
PACB
AKAM
TTWO
ORCL
KLAC
FSLY
VRSK
PANW
WDAY
ACN
MU
AMAT
CRM
AAPL
VMC
CDNS
SPLK
ASML
UBER
CCL
MLM
SNOW
DVA
CEG
ANET
DRI
IT
FTNT
COF
PTC
FLT
NTAP
STZ
MCK
PWR
MCO
GRMN
IPG
ETN
KEYS
NWS
SPGI
ANSS
STE
CSCO
CTAS
MKC
MPWR
EFX
TER
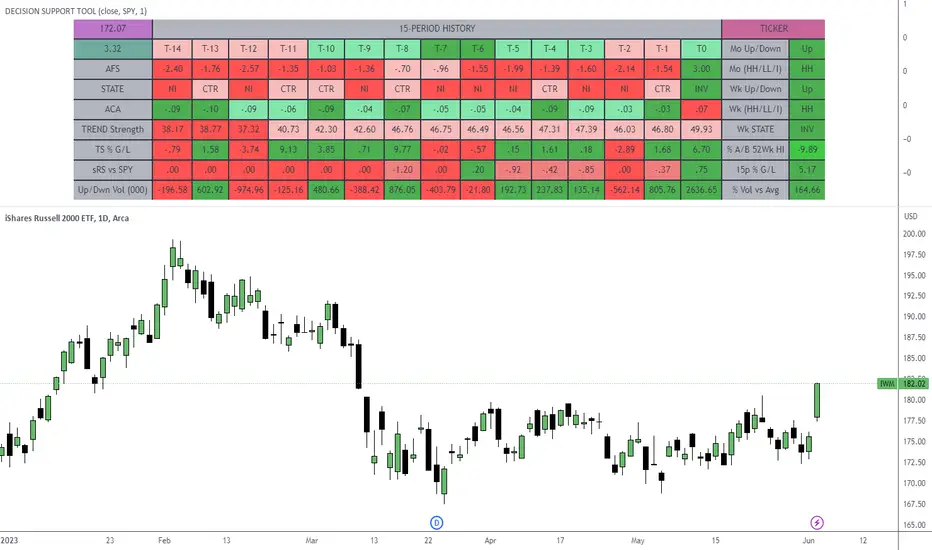
$IWM, #RUTAMEX:IWM , the Russell 2000, experienced a significant move on Friday, June 2nd, accompanied by high trading volume. On the daily chart, it successfully broke out of its structure, indicating the next potential levels at $185-190. If it manages to surpass this range, it could potentially reach $200 and even $220. It is worth noting that there are several bullish setups observed in mid-cap stocks.

IWM/SPY bounced off covid lowsimple long short, invalidation on breaching line, TP wherever tf u want (once cyclical sector growth starts slowing / negative catalyst hits?)

Still alive but...This is very risky, I bought puts strike 174 expire 06/16. I'm giving it a month, my idea is that the HS is going to to play out eventually but it may take some time. If it works, price will drop very fast.

The Russel is testing a weekly downtrend linePay close attention to the weekly trend line and the 200 days MA line
Going down?
Or are we heading toward a massive rally?
Time to make some decisions!

IWMBroke from under its 200sma today for the first time since March.
Currently outside Daily bbands sowe may see a pullback and we retest of 179-178..
Only bearish if we close back below 177.
Next resistance is 183 or weekly 200sma, if it breaks over that then IWM is headed back to 192.
Either wait for the 178 backrest or wait for a close above 183 to go long.
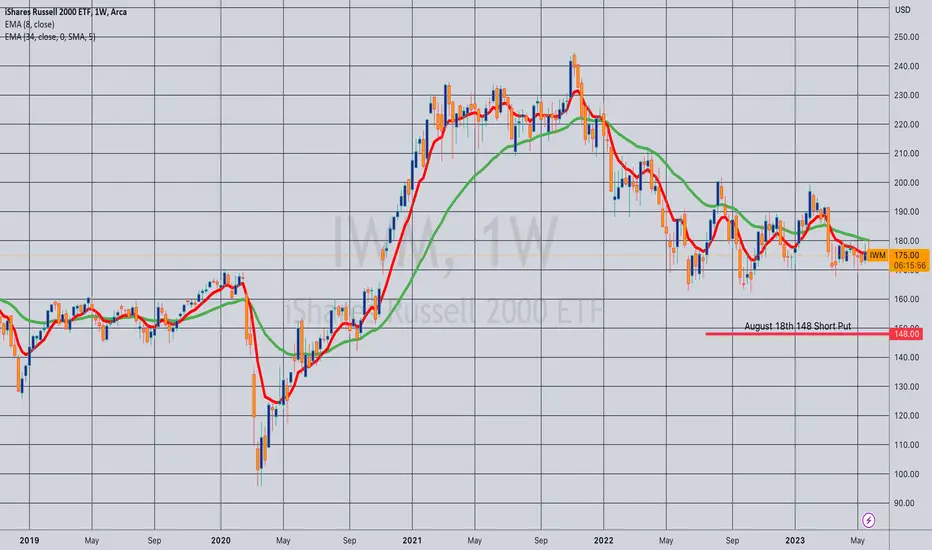
Opening (IRA): IWM August 18th 148 Short Put... for a 1.48 credit.
Comments: Targeting the <16 delta strike in the shortest duration paying around 1% of the strike price in credit to emulate dollar cost averaging into the broad market.
Opening (IRA): IWM August 18th 143 Short Put... for a 1.46 credit.
Comments: Starting to build out my short put ladder into the third quarter, targeting the <16 delta strike paying around 1% of the strike price in credit to emulate dollar cost averaging into small caps.

Using Pinescript for BacktestingA bit of a lengthy video on using pinescript to develop your trading strategy.
I just basically go over very basic functionality to get you on track if you have an interest in using pinescript for these functions.
If you are interested in seeing a little more advanced stuff or seeing how to repurpose pre-existing indicators into strategies, leave a comment and this could be a future tutorial!
I have also done a tutorial on using Excel to backtest your Strategy which is available here:
Thanks for watching!

$IWM Outlook 05/30 - 06/02 @capgainsgroupAs the S&P 500 and the NASDAQ rally into the green for the year, the Russell 2000 (aka the small cap index) has lagged behind and is barely green at +1.03% YTD for 2023. One of the reasons why this index hasn’t been doing well can be attributed to the index’s 15.18% allocation in the Finance Sector. Failing regional banks such as Silicon Valley Bank ( NASDAQ:SIVB ) and Signature Bank ( OTC:SBNY ) haven’t helped the index much.
Investors who would like to play the Russell 2000 should pay attention to the 5 major sectors that makes up 73.23% of AMEX:IWM : Health Care (17.62%), Industrials (16.66%), Financials (15.18%), Information Technology (12.74%), and Consumer Discretionary (11.03%).
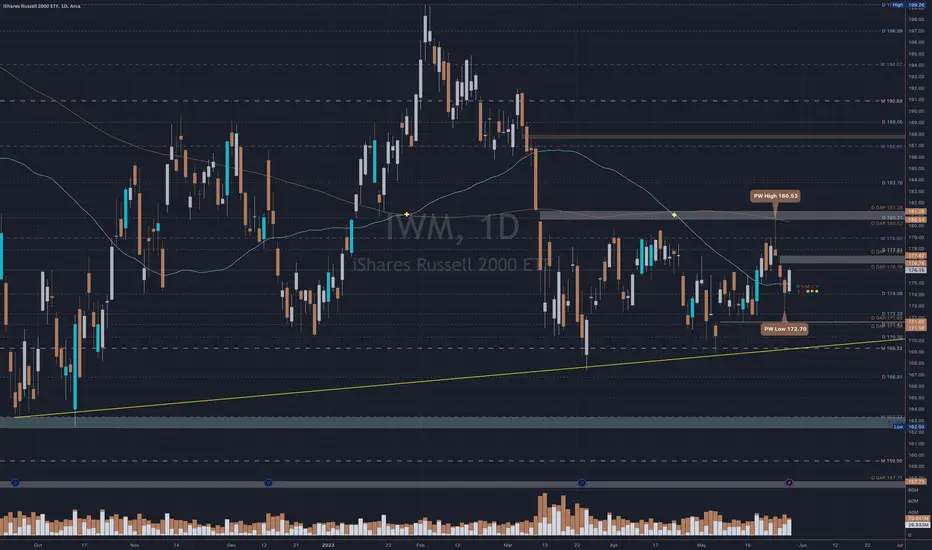
Technical Analysis:
AMEX:IWM recently formed a Death Cross (50 SMA x 200 SMA) on the daily chart in mid April. Although not very clean, there is a support uptrend line dating back to October 2022. Also, it seems like we have a head and shoulders pattern, using the Daily 170.30 level as the neckline.
Bulls will want price to reclaim the weekly 178.90 level as a support.
I lean bearish on this index. If AMEX:IWM can’t reclaim the two daily gaps above, at 176.74 - 177.42 and 180.53 - 181.28, I expect it to come down and test the yellow uptrend line and potentially break it to the downside in the coming weeks.
Upside Targets: 176.74 → 177.42 → 180.71 → 181.28 → 183.76 Extended: 186.91
Downside Targets: 174.09 → 172.33 → 171.41 → 170.30 → 169.32 Extended: 166.81
IWM has bottomed out, Upside potential toward 218IWM has bottomed out and is likely to head toward 218 by the end of this year.
