IWM trade ideas
IWM Facing Critical Resistance! Will the Breakout Succeed?
30-Minute Timeframe Analysis
* Trend Overview: IWM has been trading within a rising wedge pattern, with recent resistance near $227.46 and support forming around $219.68. The price is showing signs of consolidation after a sharp move higher, indicating potential indecision. The market may gap up or down, which could disrupt this structure, so traders should reassess at the open and adapt accordingly.
* Key Levels:
* Support: $224.00 and $219.68 are important levels to hold if the price pulls back, especially during a gap down.
* Resistance: $227.46 and $228.00 are immediate levels to break for further bullish momentum, especially if the market gaps up.
* Indicators:
* MACD: Bearish crossover, suggesting a potential pullback or consolidation unless a gap up invalidates the signal.
* Volume: Decreasing volume near resistance signals caution; any breakout or breakdown needs to be supported by a surge in volume.
1-Hour GEX (Gamma Exposure) Insights
* Key Gamma Levels:
* Positive GEX: $225 and $227 are strong call resistance zones, with $225 being the highest positive gamma wall. A gap up could test these levels quickly.
* Negative GEX: $222 and $221 are key put support levels, providing protection in case of a gap down.
* Options Metrics:
* IVR: Low at 21.3, indicating a calm market environment, but potential for large moves remains if volatility spikes.
* Calls vs. Puts: Slightly bullish bias with calls at 1.1%, showing muted optimism.
* Actionable Gamma Zones:
* Bullish Scenario: Sustained price above $227.46 or a gap up could trigger a rally toward $228 and beyond.
* Bearish Scenario: A gap down below $224 may activate put support and drive the price toward $221.
Trade Scenarios
* Bullish Setup:
* Entry: Break and hold above $227.46, or after a gap up that sustains above $228.
* Target: $230.00 and $233.00.
* Stop-Loss: Below $225.00.
* Bearish Setup:
* Entry: Breakdown below $224.00, or after a gap down that fails to reclaim $225.
* Target: $221.00 and $219.68.
* Stop-Loss: Above $226.00.
Important Note for Traders
* Market gaps at the open can disrupt the current structure. Reassess price action during the pre-market session and adjust your plan to align with the updated conditions.
* If you need technical analysis for IWM or any other ticker, feel free to reach out for a personalized breakdown and actionable insights.
Disclaimer: This analysis is for educational purposes only and does not constitute financial advice. Please conduct your research and trade responsibly.

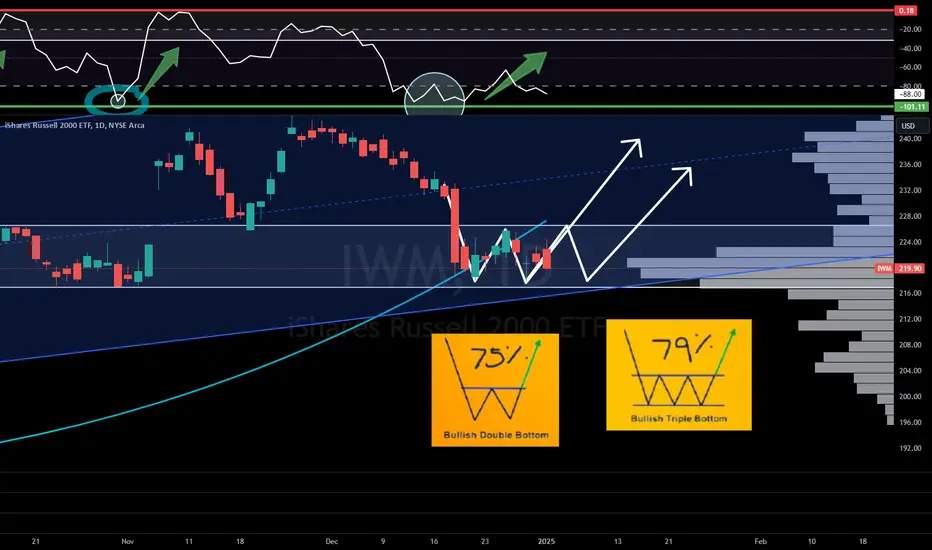
IWM | Incoming Bull Run | LONGiShares Russell 2000 ETF seeks to track the investment results of the Russell 2000 Index, which measures the performance of the small-capitalization sector of the U.S. equity market. The fund generally invests at least 80% of its assets in the component securities of its underlying index and in investments that have economic characteristics that are substantially identical to the component securities of its underlying index (i.e., depositary receipts representing securities of the underlying index) and may invest up to 20% of its assets in certain futures, options and swap contracts, cash and cash equivalents.

Which Phase?It appears IWM is consolidating, possible double bottom. Could be incorrect but it could be in the accumulation phase. Bottom indicator recently stopped flashing, last candle was bullish. MACD(Chris Moody) may have a bullish cross over. Breaking out is needed to see which way price is going to go. Please be safe and double check.

Crypto & IWM Leading the way higher!At the beginning of the month, I anticipated a necessary pullback due to the red barrier on the Wr%. While I accurately predicted the pullback, I underestimated its severity and was slightly off on the timeline. As a swing/long-term trader, I'll accept minor discrepancies in the degree of severity and timing.
In a previous video and subsequent write-ups, I emphasized that Crypto CRYPTOCAP:BTC , CRYPTOCAP:ETH , and AMEX:IWM , CAPITALCOM:RTY would lead us out of the DIP. This week, we are witnessing exactly that! Crypto and the Russell 2000 are bouncing back stronger than NASDAQ:QQQ and $SPY.
In my 2025 preview, I discussed how AMEX:IWM has lagged behind since its peak in 2021. Before this bull market truly ends, we need a catch-up rally where the Russell launches itself at the SP500. I believe we will witness this in 2025, culminating in a blow-off top similar to 2021, followed by a significant correction crash.
Not financial advice.
IWM at Critical Levels! Scalping, Swing, and Options InsightsScalping Analysis for IWM:
1. Support and Resistance Levels:
* Immediate support near $221 (put wall and HVL).
* Resistance at $226 (gamma resistance and call wall).
2. Key Indicators:
* 9 EMA & 21 EMA: Price is testing the EMAs on the hourly timeframe. A rejection here could lead to further downside, while a breakout suggests a bullish move.
* MACD: Currently neutral with a potential bullish crossover. Wait for confirmation.
3. Scalping Plan:
* Bearish Scenario:
* Entry: On rejection near $224-$226.
* Target: $221, $218.
* Stop Loss: Above $227.
* Bullish Scenario:
* Entry: Breakout above $226 with volume confirmation.
* Target: $227, $232.
* Stop Loss: Below $224.
Swing/Day Trading Analysis for IWM:
1. Trendlines:
* IWM is forming a consolidation zone. A breakout above $226 or breakdown below $221 will provide a clear directional move.
2. GEX Analysis:
* Strong resistance at $226-$227 (gamma resistance and call wall).
* Solid support at $221 (HVL) and $218 (put wall).
3. Trade Scenarios:
* Bullish Swing:
* Entry: Above $226 with strong volume or on a pullback to $221 with support confirmation.
* Target: $232, $236.
* Stop Loss: Below $224.
* Bearish Swing:
* Entry: Below $221 on breakdown confirmation.
* Target: $218, $215.
* Stop Loss: Above $223.
Options Play with GEX Insights:
1. High GEX Areas:
* Call Wall: $226, $227.
* Put Wall: $221, $218.
2. Suggested Options Strategy:
* Bullish Play:
* Buy Jan 5th $226 Call if IWM breaks above $226 with volume.
* Target: Move toward $227-$232.
* Risk: Below $224.
* Bearish Play:
* Buy Jan 5th $220 Put if IWM breaks below $221.
* Target: $218-$215.
* Risk: Above $223.
3. Options Oscillator Metrics:
* IVR (20.7%) suggests moderately priced premiums for options strategies.
* Low GEX (1.8%) implies limited gamma influence but still highlights significant zones at $226 (resistance) and $221 (support).
Insights:
* IWM is trading near a pivotal level at $221, with significant resistance overhead at $226. A clear breakout or breakdown from this range will define the next move.
* Volume Confirmation: Watch for a surge in volume near $221 or $226 to confirm directional bias.
Disclaimer: This analysis is for educational purposes only and does not constitute financial advice. Always trade responsibly and manage risk.

IWM Breaking Out! Scalping, Swing & Options Strategies to WatchMarket Structure:
* IWM has broken its recent downtrend and is consolidating near the $225 level, supported by the 9 EMA and 21 EMA showing bullish momentum.
* A strong recovery from the $216 lows positions IWM for potential upside if resistance levels are cleared.
Key Levels to Watch:
* Support Zones:
* $224: Immediate support aligned with previous breakout levels and the Gamma support wall.
* $221: Strong support from the recent higher low.
* Resistance Zones:
* $229: Key resistance from GEX and technical confluence.
* $235: Recent highs; a breakout above could trigger further bullish momentum.
Indicator Insights:
* MACD: Bullish, but histogram indicates fading momentum; watch for potential crossover.
* Volume: Consistent buying interest; any surge in volume could signal a breakout or breakdown.
* Options Oscillator: Implied volatility is stable (IVR: 8.8), favoring controlled directional moves.
Scalping Strategy:
1. Bullish Setup:
* Enter on a pullback to $224 with confirmation of a bounce.
* Targets: $226 and $229.
* Stop Loss: Below $223 to minimize risk.
2. Bearish Setup:
* Enter on a breakdown below $224 with increased selling volume.
* Targets: $222 and $221.
* Stop Loss: Above $225 to manage losses.
3. Indicators to Use:
* Use RSI and VWAP for momentum confirmation.
* Quick trades aligned with market sentiment around GEX levels.
Swing Trading Strategy:
1. Bullish Scenario:
* Enter on a daily close above $226 with volume confirmation.
* Targets: $229 and $235.
* Stop Loss: Below $224.
2. Bearish Scenario:
* Enter if IWM closes below $224 and sustains a bearish trend.
* Targets: $221 and $216.
* Stop Loss: Above $225.
3. Indicators to Monitor:
* EMA (9/21) for momentum direction.
* MACD and RSI for trend and overbought/oversold levels.
Options Strategy Based on GEX:
1. Bullish Options Play:
* Buy a Call Option at a $225 strike expiring in 1-2 weeks.
* Target: Exit around $229 or $235 based on price movement.
* Stop Loss: Close the position if IWM drops below $223.
2. Bearish Options Play:
* Buy a Put Option at a $224 strike expiring in 1-2 weeks.
* Target: Exit near $222 or $221 for profits.
* Stop Loss: Close the position if IWM recovers above $225.
3. Neutral-to-Bullish Strategy:
* Sell a Put Credit Spread at $223/$220, taking advantage of strong GEX support at $224.
* Profit if IWM stays above $224 by expiration.
4. Advanced Gamma-Based Strategy:
* If IWM holds above $224 and approaches $229, consider selling a Call Spread at $230/$235 to capture premium while limiting risk.
Actionable Plan for IWM:
* Scalpers should focus on intraday moves around $224 and $229, watching volume spikes and RSI for momentum.
* Swing traders should look for breakouts or breakdowns with confirmation from daily candles.
* Options traders can leverage GEX insights and implied volatility for directional or premium-selling strategies.
Disclaimer:
This analysis is for educational purposes only and does not constitute financial advice. Always conduct your own research and trade responsibly.

THIS will take place before the end of this BULL RUNAMEX:IWM CAPITALCOM:RTY AMEX:TNA
HERE ME NOW!
This CupnHandle Retest then move Higher will be the final DRIVE of this Bull Market before we get that 20% or more crash!
This will send us to a measured move of $306 and play the catchup to the AMEX:SPY NASDAQ:QQQ to conclude the bull run. Timeframe is before Nov2027 so it could be awhile but I'm making my call!
Not financial advice

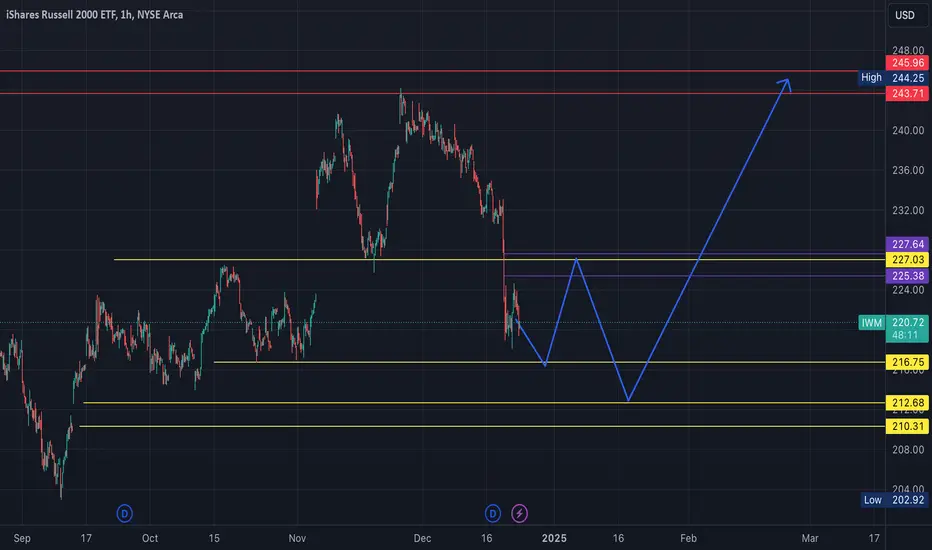
IWM volatility ahead! price levels to keep in mind...Forecasted price action shown on chart. Several liquidity levels delineated as bullish & bearish targets.
Both bulls & bears get to eat this holiday season as the market prices in less cuts to Federal funds rate in 2025. Classic holiday chop...
Expecting gap fill at 210-212.6 zone before final breakout above 230 resumes for progression to new all time highs near 246 buy target likely sometime in Feb 2025...
$IWM Tradespoon - Long Entry $222.60Tradespoon model generated long signal for AMEX:IWM with key support at $222.60 and resistance at $226.90. Favorable macroeconomic conditions and cooling inflation support small-cap growth. Predicted range: $222.60–$224.65. AMEX:IWM

IWM 4h Testing 8/5 Pivot VWAP, Forming Potential Falling Wedge.IWM 4h Testing 8/5 Pivot VWAP, Forming Potential Falling Wedge. Also a volume shelf setup. LONG
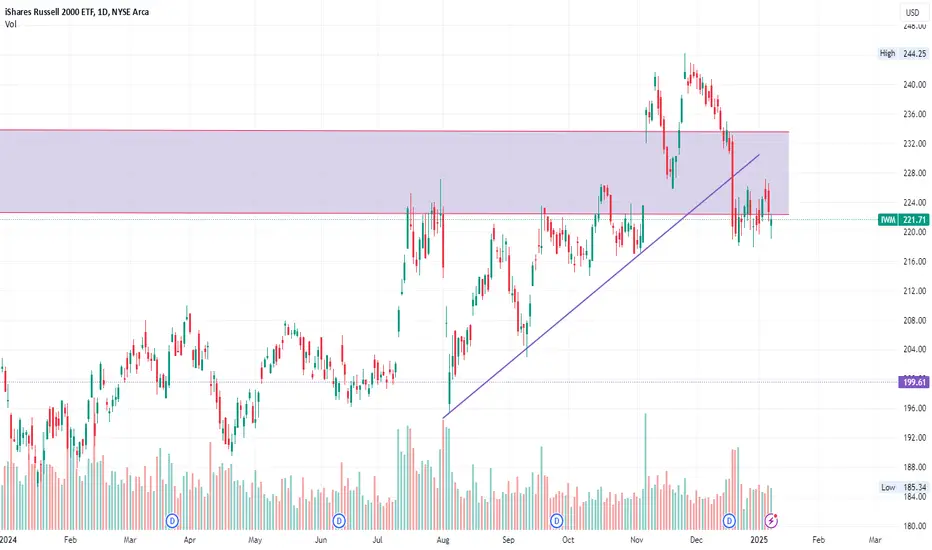
IWM | Bullish AMEX:IWM
Resistance Levels:
There is a significant resistance level at around 224.02. The price needs to close above this level to confirm a breakout.
Another resistance level is at approximately 233.64.
Support Levels:
The immediate support level is the trendline, which has been acting as a resistance until now. This trendline is likely to act as a support if the breakout is confirmed.
A secondary support level can be seen at around 227.13.
Potential Targets:
If the price closes above 224.02, it signifies a breakout from the current price channel.
The first target after the breakout would be around 233.64.
The second target, based on the price projection, would be approximately 244.46.
Indicators:
The RSI (Relative Strength Index) is currently around 63.34, which is above the neutral 50 level but not yet in the overbought territory. This suggests there is still room for upward movement.
The price action shows higher highs and higher lows, indicating a bullish trend.
Volume: The volume seems consistent, supporting the upward price movement. Higher volume on a breakout above 224.02 would confirm the bullish sentiment.
Conclusion:
If IWM closes green today above 224.02, it indicates a breakout from the current price channel, suggesting a potential further upside. The first target would be around 233.64, followed by 244.46. This position could be highly profitable for call options and futures contracts if the breakout is confirmed and sustained.

Technical Analysis (TA) and GEX for IWM for Dec. 20Market Overview
IWM has been experiencing a significant downturn over the past week, reflecting broad market weakness. The ETF is attempting to stabilize after hitting critical support levels. Gamma Exposure (GEX) analysis highlights key resistance and support areas, providing insights for potential market movements.
Gamma Exposure (GEX) Analysis
* Current Gamma Profile:
* HVL (Highest Volume Level): $220, acting as a key pivot point.
* Major Resistance:
* $223: High GEX indicates strong call wall resistance; price may struggle to break this level without significant volume.
* $235: Secondary resistance aligning with historical price rejection levels.
* Major Support:
* $218: Immediate GEX support; a breakdown below this could lead to further declines.
* $215: Strong put wall and critical support, where buyers are likely to step in.
* Implied Volatility (IV):
* IV is trending lower, indicating that market participants expect reduced volatility ahead. This could signal consolidation after recent sell-offs.
Technical Analysis
1-Hour Chart Insights:
* Trend: Short-term recovery within a broader downtrend.
* IWM is showing signs of breaking out of a descending channel, indicating a potential reversal if confirmed by volume and momentum.
* Key Levels:
* Resistance:
* $223: Major hurdle; breaking above this would signal a bullish continuation.
* $226: Secondary resistance aligned with the 50 EMA.
* Support:
* $218: Immediate support from GEX.
* $215: Critical support; failure here could lead to a retest of lower levels.
* Indicators:
* MACD:
* Bullish crossover, suggesting increasing momentum for a short-term rebound.
* EMA (9 & 21):
* Price is attempting to reclaim the 9 EMA; sustained movement above both EMAs would confirm a trend reversal.
Trade Scenarios
Bullish Scenario:
* Entry: Above $220 with strong volume confirmation.
* Targets:
* First Target: $223 (GEX resistance).
* Second Target: $226 (EMA alignment).
* Stop-Loss: Below $218.
Bearish Scenario:
* Entry: Below $218 with increasing sell volume.
* Targets:
* First Target: $215 (put wall support).
* Second Target: $212 (lower GEX support).
* Stop-Loss: Above $220.
Key Takeaways
1. Consolidation Phase: IWM appears to be consolidating, with a bias toward a short-term recovery. Gamma levels are tightly aligned, indicating a range-bound market unless a breakout occurs.
2. Momentum Indicators: Bullish MACD crossover and an attempt to reclaim EMAs suggest potential for a short-term rally.
3. Critical Levels: Traders should monitor $223 for bullish confirmation and $218 for bearish signals.
Disclaimer: This analysis is for informational purposes only and does not constitute financial advice. Always conduct your own research and risk management before trading.

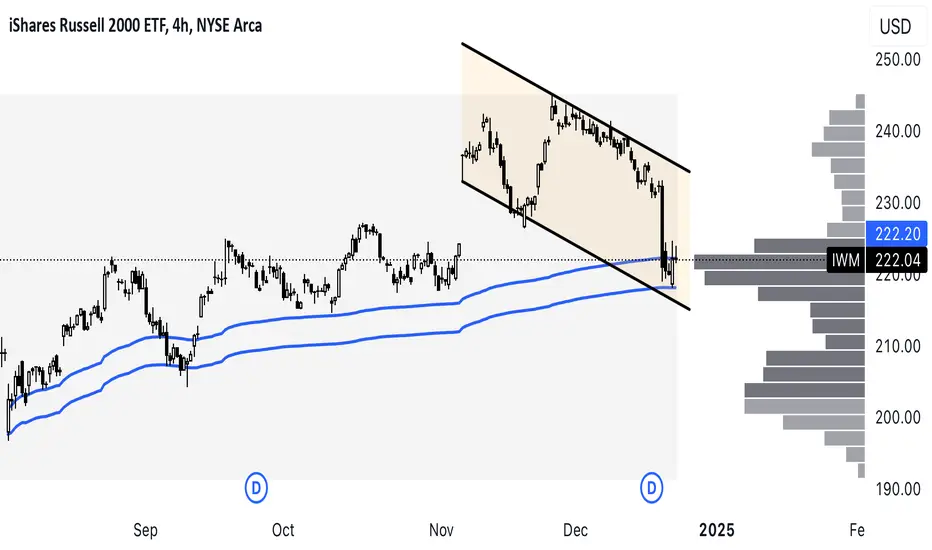
IWM CORRECTIONAs we can see, there has been a correction since the presentation of the FOMC meeting, with a break in the bullish structure we had in the indices. IWM is one of the most bearish indices, breaking bullish structures in the 4-hour timeframe and losing strength in the daily timeframe. Although there hasn’t been a change in the daily timeframe yet, we are losing momentum and should recover the daily channel. In my view, it is the weakest index.

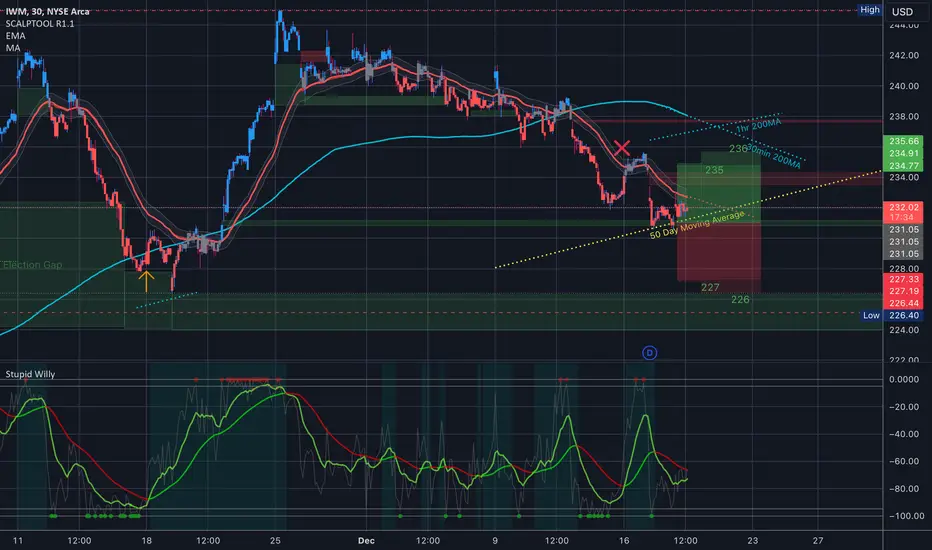
(GET READY). IWM's expected move today for FOMCWow guys look at today’s chart for FOMC for IWM. We had a really solid sell off after making new all-time highs after three years back on November 25 and that 35 EMA has been front and center. We did take it all the way back down to the 50 day moving average on the 30 minute timeframe we’re on the one hour timeframe and we’re bouncing on the 50 day moving average or at least holding above it that is also the two hour timeframe
Today between 227 to 235
The 35 EMA is right above us that’s definitely the first level.
If we get above that we do have the down gap from this Monday and the top of that gap is at 234.37
Then the top of the implied move is at 2:35 and 236 on Thursday’s contract then we do have an interesting cross of the 30 minute two moving average that is underneath the one hour to under average so that is a bear signal underneath us if we break the 50 day we do have The bottom of the move at 2:27 and 226 on Thursday’s contract. We do have a little bit of support that is just underneath that and it’s around 228 that goes back to around November 18 where we saw a few days before we rally to make new all-time highs so that could be a little to watch out for as well.
IWM to bounce $240 targetMy trading plan is very simple.
I buy or sell at top & bottom of parallel channels.
I confirm when price hits Fibonacci levels.
So...
Here's why I'm picking this symbol to do the thing.
Price at bottom channels (period 52 39 & 26)
Stochastic Momentum Index (SMI) at oversold level
VBSM is negative
Price at or near 0.618 retrace Fibonacci level
In at $232ish
Target is $240 or channel top
Stop loss is $228, but will reenter at $225ish.

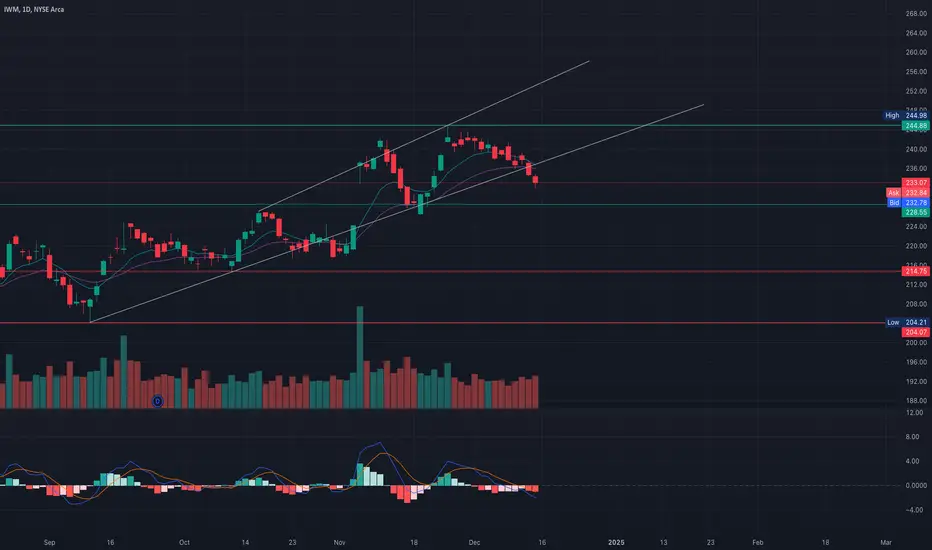
IWM: Key Levels and Trade Setups for Dec. 17IWM Technical Analysis and GEX Overview
1D (Daily) Chart:
* Trend: IWM is showing signs of a bearish move as it continues to pull back from recent highs near 244.98. The price has fallen below the 9 EMA and is testing a support zone.
* Key Levels:
* Support: 231.88
* Resistance: 240.00 and 243.69
* MACD: Showing downward momentum with a bearish crossover; selling pressure persists.
* Volume: Volume has slightly increased, suggesting active participation as sellers dominate the trend.
1H (Hourly) Chart:
* Trend: The price is attempting to stabilize after a significant decline. It bounced off the 231.88 support and is testing the short-term resistance at 234.50.
* Key Levels:
* Immediate Support: 233.00
* Resistance: 235.00 and 237.00
* MACD: Mixed signals, showing potential for a bullish crossover if momentum increases.
* Possible Scenarios:
* A reclaim above 234.50 can target 235–237 in the near term.
* A failure to hold 233 could trigger a retest of 231.88 support.
GEX Analysis:
* Key Gamma Levels:
* 2nd PUT Wall: 237 (-1.45%)
* 3rd PUT Wall: 236 (-2.65%)
* 2nd CALL Wall: 235 (+72.27%)
* Highest Positive Gamma: 234 – This suggests resistance near 234 could create a ceiling unless bulls push through with strength.
* Support Gamma: Gamma exposure at 231–233 offers strong PUT support, likely preventing sharp declines.
* IVR: 25.4
* IVx Average: 23.5
* Call/Put Skew: CALLS 18.26% dominance, indicating bullish sentiment but cautious buyers.
Trade Suggestions:
Scalp Trades (Intraday):
* Bullish:
* Buy CALL: If price reclaims 234.50 – Target: 235.50
* Stop-Loss: 233.50
* Bearish:
* Buy PUT: If price rejects 234 – Target: 232.00
* Stop-Loss: 234.75
Swing/Day Trades:
* Bullish Setup:
* Buy CALL: Above 235 for a move towards 237–240.
* Expiration: 1–2 weeks
* Stop-Loss: 232.50
* Bearish Setup:
* Buy PUT: If price closes below 233 for a retest of 231.88–231.
* Expiration: 1–2 weeks
* Stop-Loss: 235.00
Outlook:
IWM remains under pressure, but the bounce from key support at 231.88 suggests a potential short-term reversal if resistance at 234.50 breaks. Traders should watch the gamma walls near 234–235 for confirmation of direction. The short-term bias remains neutral to bearish unless buyers reclaim resistance zones.
Disclaimer: This analysis is for educational purposes only and does not constitute financial advice. Always perform your own research and manage risk accordingly.

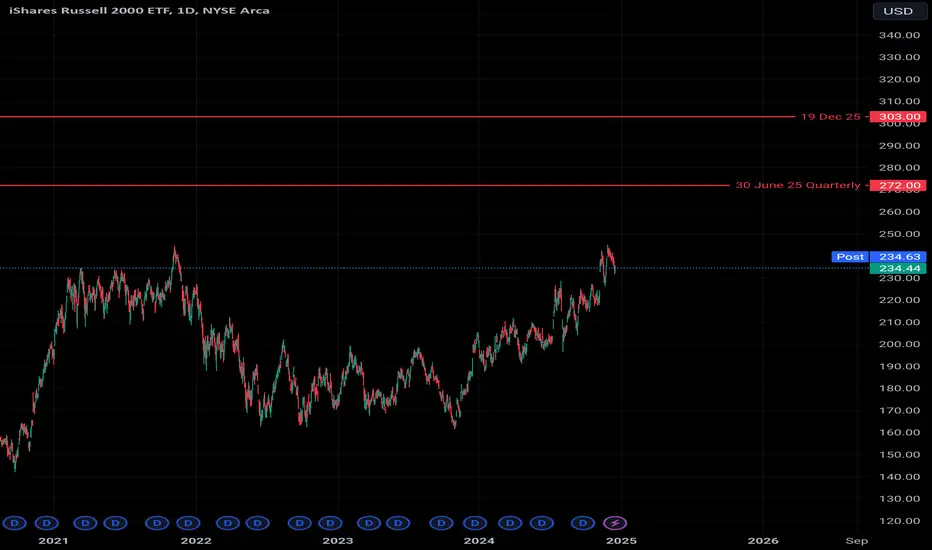
IWM 270 & 300 CallsDo you believe in the Trump trades? Vertical calls for 270 C for Jun 2025 Quarterly and 300 C DEC 2025 are looking attractive. Regardless if shorter end rates go down, recognize that tariffs fueled by Trump will make anything America First go up which means- US small caps!
Mini handle on cup formingHandle is forming on the two hour chart. Expect price To increase soon. Consider debit spread at the money $10 wide.
IWM Breaking Down! Key Levels $ Setup for the Week of Dec. 16.1. Technical Analysis (Daily & 1-Hour Timeframes)
Daily Chart (Longer Timeframe):
* Trend: IWM (Russell 2000 ETF) is breaking down from its rising channel, signaling weakness.
* Resistance:
* 240: Previous support turned resistance.
* 244.98: The upper supply zone where sellers may step in.
* Support:
* 233: Immediate key support where buyers may attempt to hold.
* 214: Stronger support from prior price action.
* Indicators:
* MACD: Bearish crossover confirms downward momentum.
* Volume: Elevated selling pressure in the last few sessions.
1-Hour Chart (Shorter Timeframe):
* Trend: Price is in a short-term descending channel, testing support near 233–232.
* Resistance:
* 235.95: Closest resistance on the 1-hour chart.
* Support:
* 231.88: The next key level of support aligned with recent lows.
* MACD: Slight signs of recovery but remains bearish overall.
--------------------------
2. GEX Analysis
Key GEX Levels:
* CALL Walls (Resistance):
* 235: 2nd CALL Wall, presenting overhead resistance.
* 237: Highest resistance level from GEX and likely area of rejection.
* PUT Walls (Support):
* 233: Current area showing significant PUT support, aligning with technical levels.
* 231: Highest negative GEX level, acting as a major support zone.
Options Oscillator Insights:
* IVR: 19.1% – Elevated volatility, making options slightly more expensive.
* PUTs: 86.08% activity signals strong bearish sentiment in options flow.
-------------------------
3. Trade Setups
Bearish (Short Bias):
* Entry: Near rejection at 235–237 resistance.
* Target:
* 233 PUT support as the first target.
* 231 negative GEX as the extended target.
* Option Strategy:
* Buy PUT options (strike 233, expiry 1 week out).
* Consider a Bear Put Spread: Buy 234 PUT, Sell 231 PUT to lower cost.
Bullish (Rebound Play):
* Entry: If IWM holds above 233 PUT support with bullish volume confirmation.
* Target:
* 235: Closest resistance target.
* 237 CALL Wall as an extended target.
* Option Strategy:
* Buy CALL options (strike 233, short-term expiry).
* Use a Bull Call Spread: Buy 232 CALL, Sell 235 CALL to minimize risk.
Directional Bias for This Week
* Bearish unless IWM can reclaim 235 resistance. The current price action and heavy PUT positioning signal downside risk toward 231 PUT Wall support.
* Watch for potential bounce opportunities at 233, but the trend favors further weakness.
Short Disclaimer:
This analysis is for educational purposes only and does not constitute financial advice. Always do your own research and manage your risk before trading.
Market Update - 12/15/2024• only 21% invested, got shaken out of most of my positions
• large bad trades this week cost me almost $300 or 10% of my account
• I will not put large positions again in bad and worsening market breadth environment
• watchlist is the shortest it's been in a while, setups are not the best either
• most setups are in finance names, I think they could be leaders after the FED decision next week
• whatever industry leads in the first few days after the FED decisions will likely be the leader
• won't add new positions until the decision next week, or at least nothing large, will remain defensive until things improve

IwmSimple chart.
Gap at 230
Fib support at 230
50ema at 230
Wait for price to tag 230
Then long to 235 (21ema)
Dont know if it can break above 235
But if it does it will most likely come on Core PCE on Friday. Above 235 and 240 comes..
I think small caps and cylicals outshine the next 2 weeks but only if Iwm breaks above 235

IWM looking for rates to drop or Mag7 to hit Period VAHsI propose that the bullish flag will propel IWM further (rates aside, it has done it before) to the 242.17 and higher given steady macro events.
