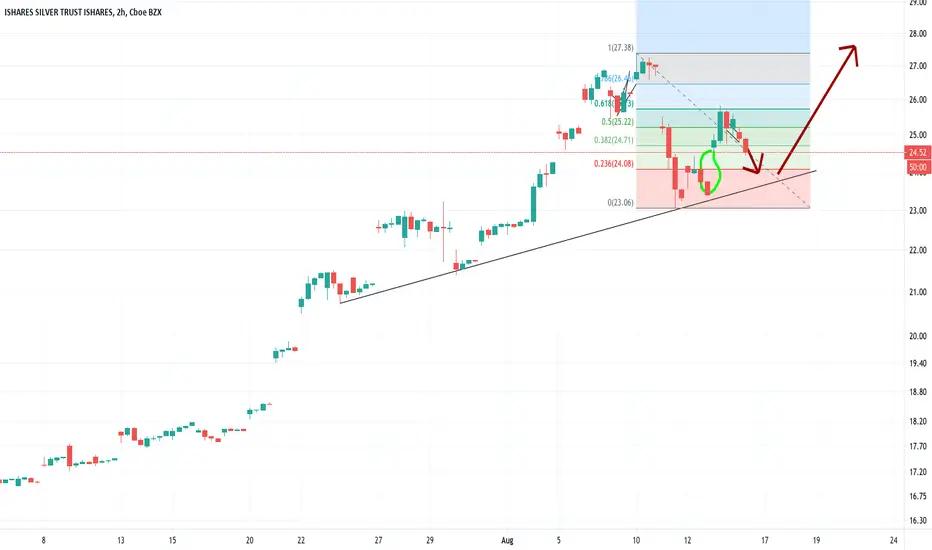
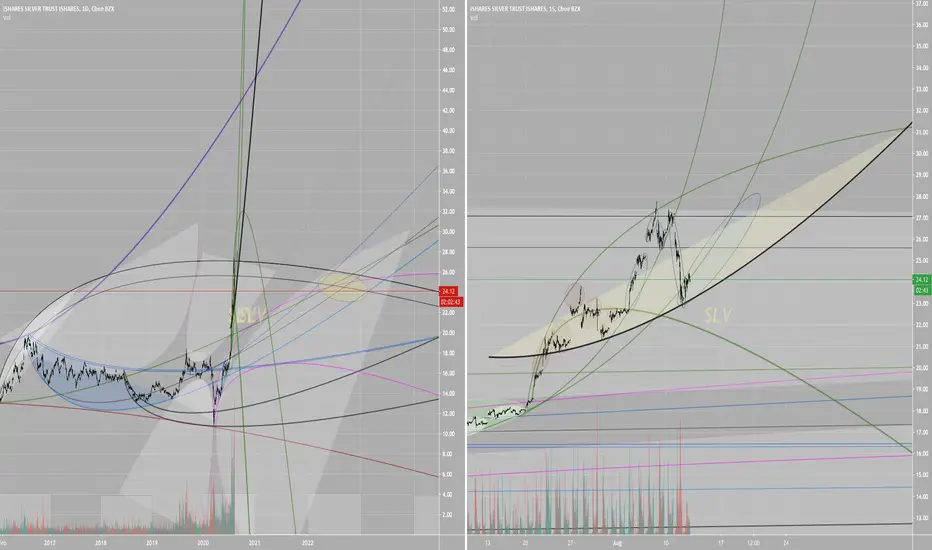
SLV adhering to Fib levels, strongAs we can see on the 4 hour Fib SLV is playing nicely with it's expected levels. There's a gap to fill to 26.48 so as long as the metal keeps moving up, expect SLV to fill the gap relatively quickly and then move onward to the higher levels we've recently seen, and beyond. (see link for other chart)
As for the sharp drop we had last Tuesday and it's near V recovery, this is a VERY CLEAR indication this was price manipulation to cover shorts by the big banks who are losing control of silver's price. Look at how quickly silver recovered from that drop. We're at the point to where the attempts to largely control the price is getting weaker and weaker due to the many factors driving silver up. Staying strong, not conceding/selling the dips, but rather seeing these dips as a gift of a buying opportunity is how I'm playing this, and it has paid off nicely.
To see resistance levels above $26.48 please see link to chart published on Aug 5th as well as my last analysis on Aug 11th which provided guidance on support levels for the last dip which SLV consequently bounced from.
SLV trade ideas

Silver lags but moves SLVSLV
Silver always seems log lag Gold moves (After Berkshire moves 20.9M shares in GOLD).
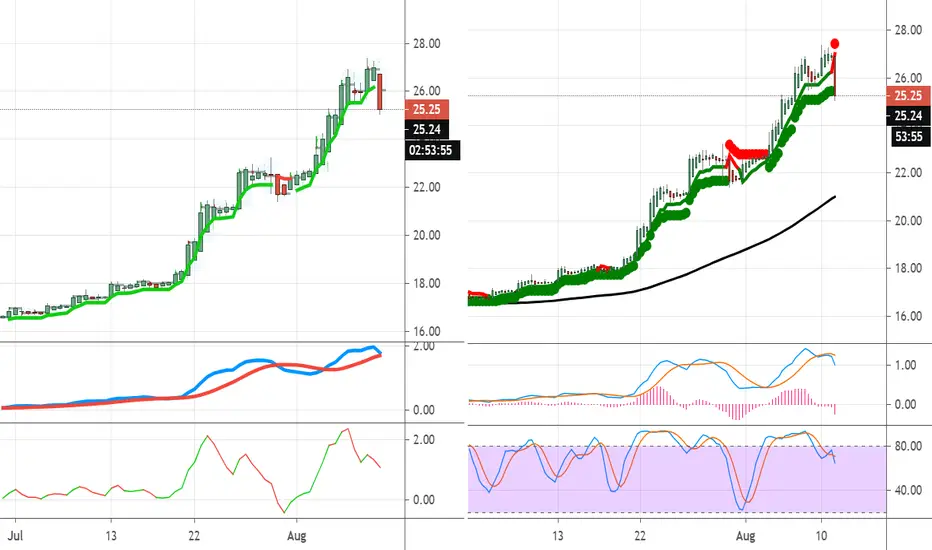
Strong buy moves and trends show Henkin bars now above Kumo on the Ichimoku Cloud.
Long positions will see strength and small 5-10% pullbacks over time.
I see a target for Spot Silver above $30 for September. $50 for end of 2020 and $70 for 2021.

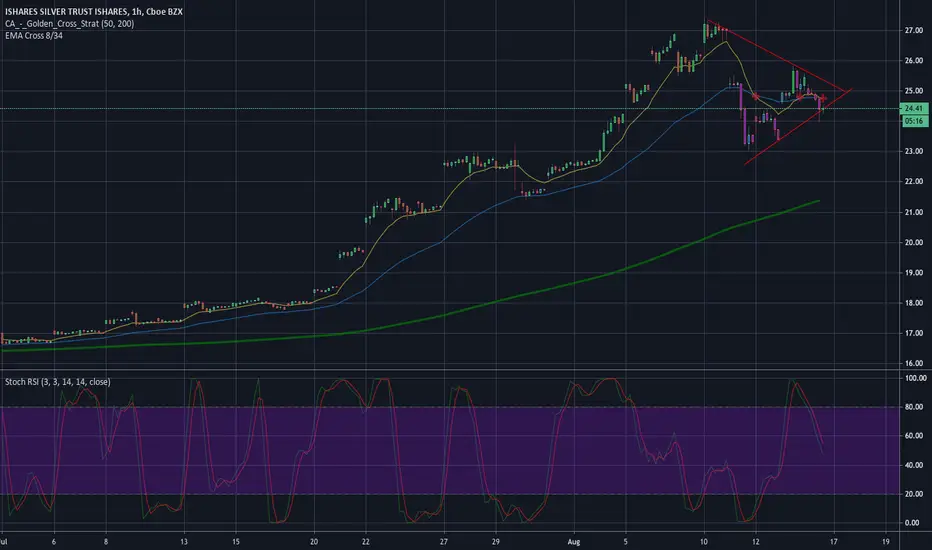
SLV 4HR ChartSilver bounced from 4HR EMA and is currently sitting on AVWAP and cloud support. Needs to break above AVWAP and supply zone. Looking for an entry at the golden pocket targeting ATH. 4HR RSI: 52. Stoch RSI: Bullish divergence.

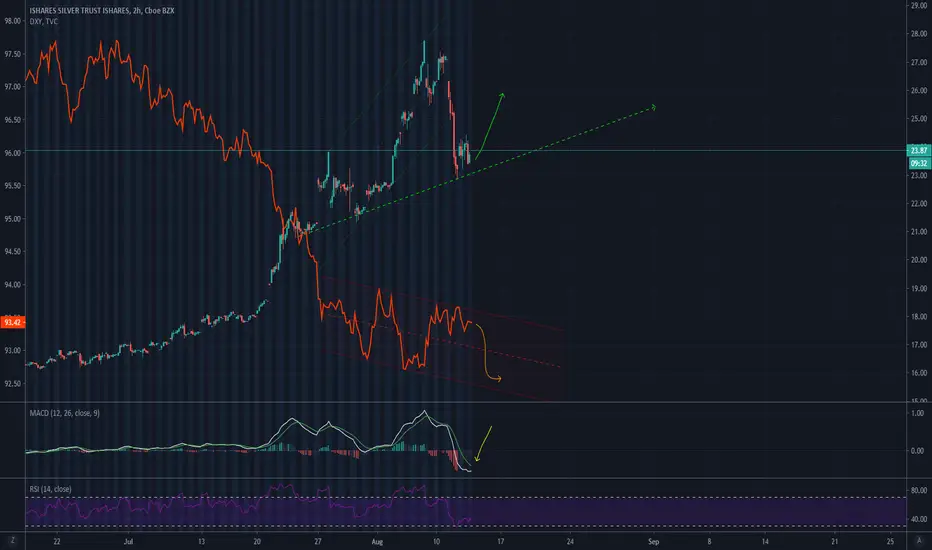
24.52 1k shares with a stop loss at 23also added some weekly calls, imo if dxy drops under 93 again this runs 5 dollars next week-2, gl

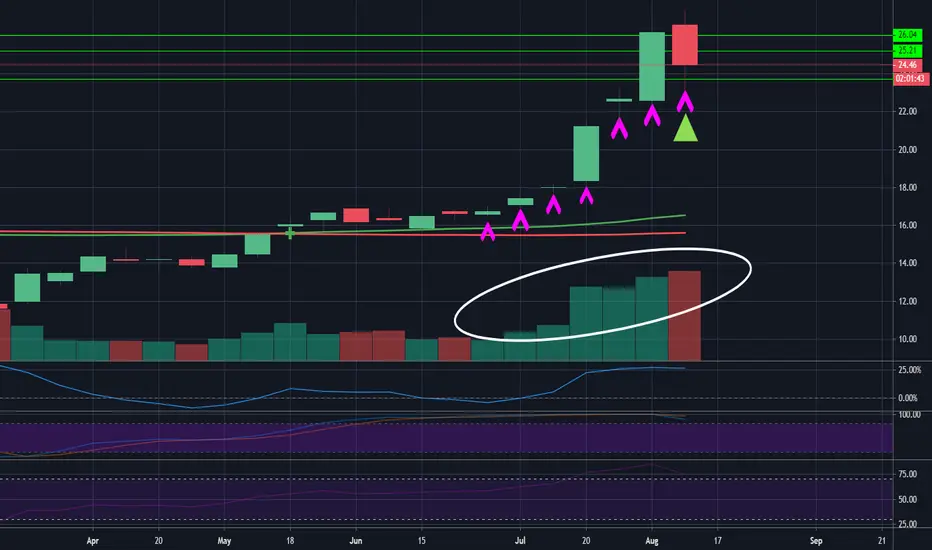
SLV - 7 weeks of higher lowsZooming out on the weekly SLV seeing 7 weeks of higher lows along with seven weeks of higher volume. As long as we close out today with a higher ow, we're looking good into next week. These minor pullbacks or not only bullish and necessary, they are gifts.
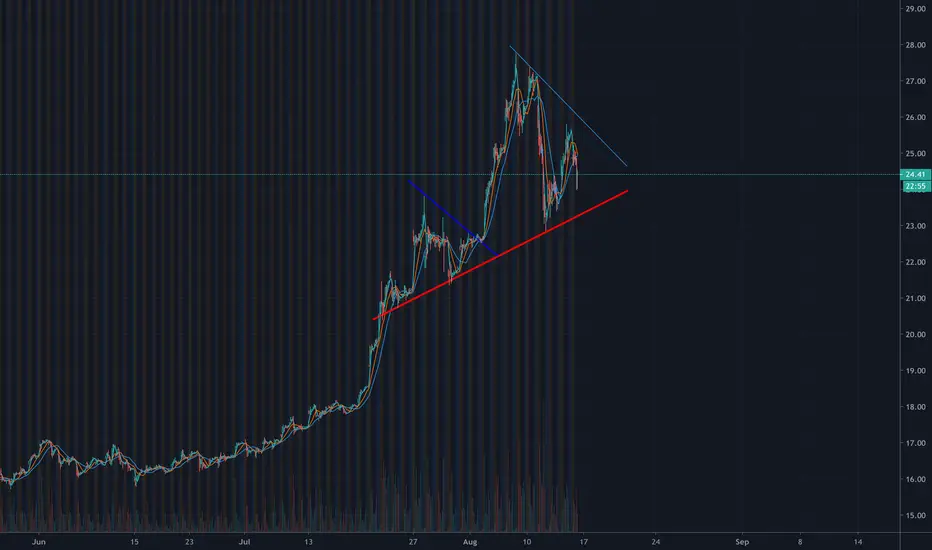
SLV CoilingAfter a big run up, SLV looks to be cooling off by showing us chopping sideways action. This is also forming a bull flag. As long as economic indicators remain, and silver continues to get mainstream attention to a slv:gld ratio deficit, then $29-$30 should be the next target. Neutral while this plays out. Long after an upside breakout.
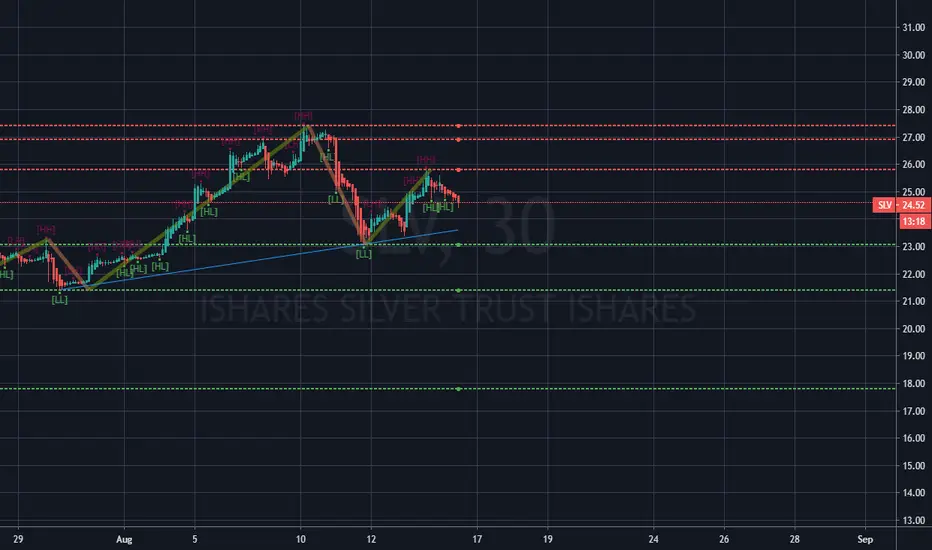
SLV Silver Trust Believe we are in a 4th wave correction. Expecting this to continue to correct for a lower low in this move ~23.1

This Is A BULL TRAP AT $25 Looking For A 20% Drop Title says it all - looking for the GAP TO FILL at $18 or so before the rocket takes off to $40 plus #stocks #SLV #Silver
Silver SLV Clear sideways consolidationNo moves until new or Markets post big declines.
Good Tranes for selling IC's or Credit Spreadts
-Sell Put Spreadfs at dips and sell call spreads on peaks
Watch for BIG moves up with any bad news or down market days. No rush to get in till after 9am market moves settle.
If you have access try futures on /SILU0 and /MGCZ0 as good buys at bottoms.
Hedge with SPX
good trades!
CCI Divergence and Liquidation VolumeGLD and TLT led ETF redemptions in the previous 7 days indicating a shift away from defensive sentiment. SLV played catch up in July-Aug, ripping to 27.39.
Among the price/volume family of indicators, CCI showed the most dramatic price divergence. CCI cooled down from 401 to 124.90 while price rose 25% in the same time frame.
Using anchored VWAP from July 16th, prior to the face ripping rally, we can see that the average holder from that point in time is in the money, and the VWAP is behaving like support. From last week's blowoff top, Anchored VWAP is behaving as resistance.
This week 's price channel is almost double in volume vs last week. This is a hands off moment to spectate the consolidation for rally participants who cleared their positions in the money recently. I am looking for a bigger pullback, otherwise I would rather trade other asset classes.

Pullbacks are normal.... SLV Still strongXAGUSD SLV
Still a great time to add and average...
Long and slow growth will have short swift climbs then long slow sideways consolidations.
$30 by Oct. 2020
$45 2021
$90 2022
$200 2024
SLV bounce from 23!Here we can see the MACD beginning to turnover. After SLV, as well as GLD, tanked this week, it found support on the line marked in the chart. As long as it doesn't break through that line of support I think we'll see some upward movement in SLV
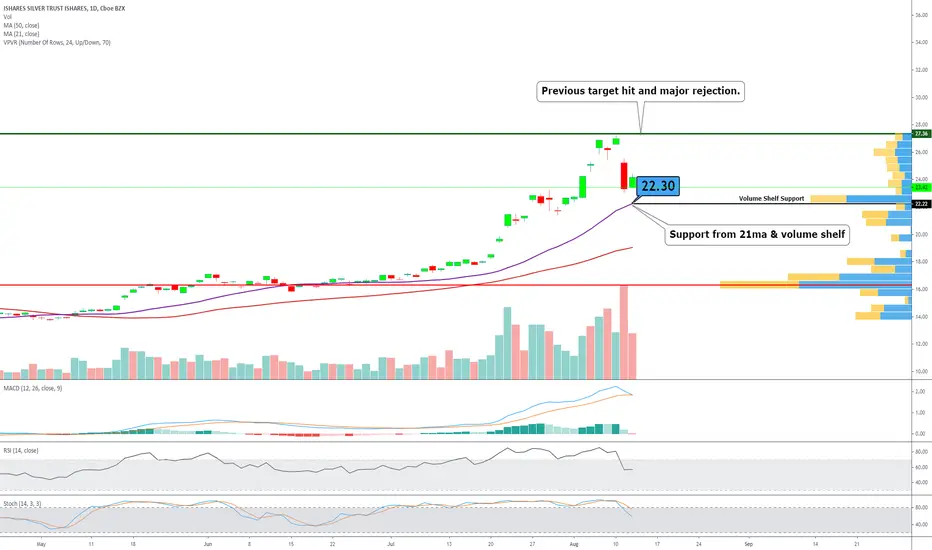
$SLV IShares Silver Trust $22.30 target
The inevitable selloff arrived and it looks like it may have some more room to fall.
We see $22.30 as a possible level of support which may be temporary.
Lots of inexperienced traders FOMO'd into this so weak hands all the way up from the mid teens.
Multiple gaps are also negative, so caution needed and avoid a falling knife
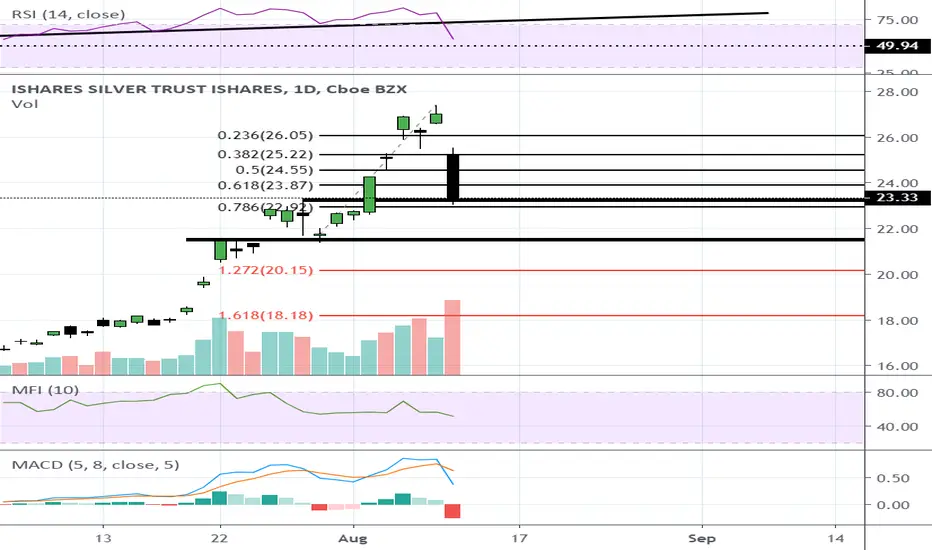
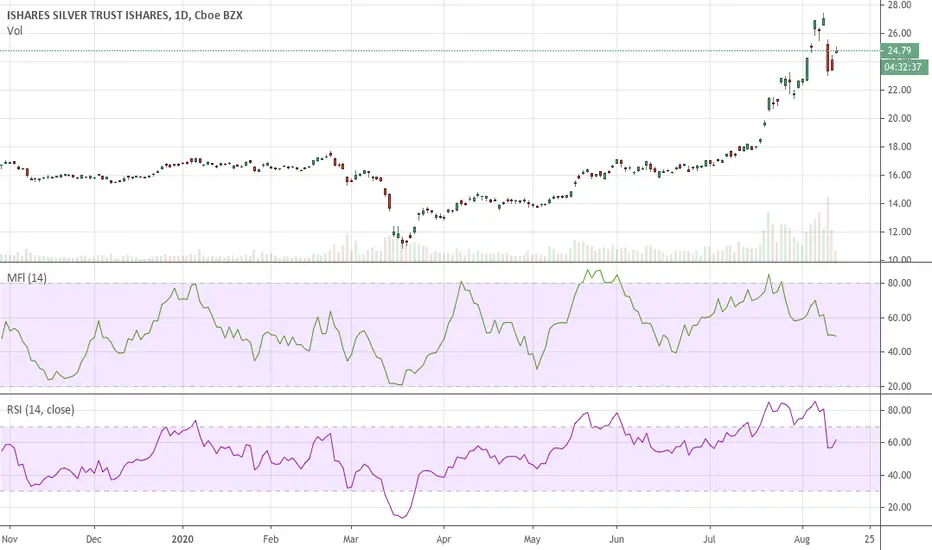
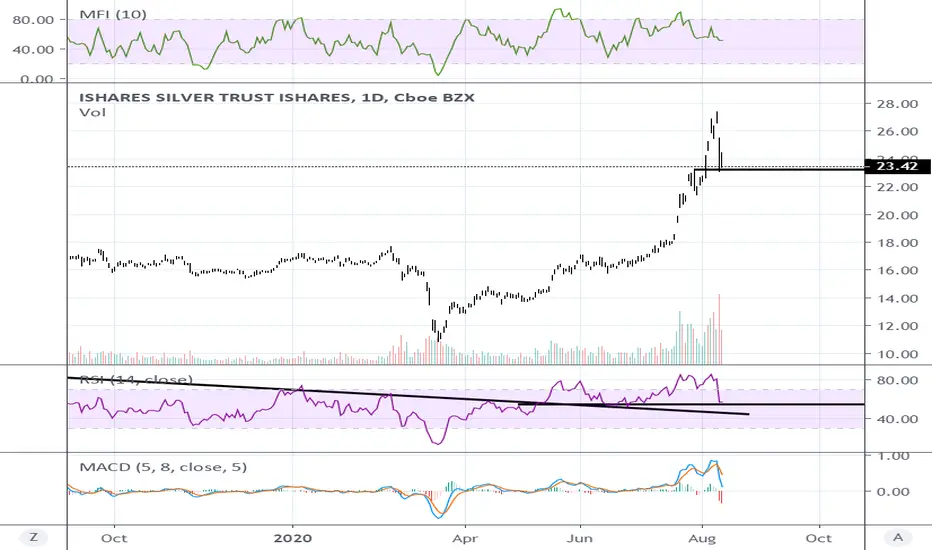
SLV is presenting a buying opportunityTechnically while I am long SLV in the big picture I think there may a little but of downside left to complete a healthy retracement. The tool I've used here depends on identifying divergence (in this case MFI but RSI is fine as well), you then measure the duration of that divergence, and lastly project it (duration) off the price low (as this is bearish divergence) within the period the divergence was identified. The notion is that this is the average time it will take for that low to be tested. What this means is that we *may* see a low in SLV on 8/14 and the general price range I'm looking for is 21.4 - 20.84 (prior low and pivot point) with a .618 retracement of the massive rally falling in that range. If the .618 retracement doesn't hold I will then look at the .5 mark visible on the graph. Please ask if you have any questions.

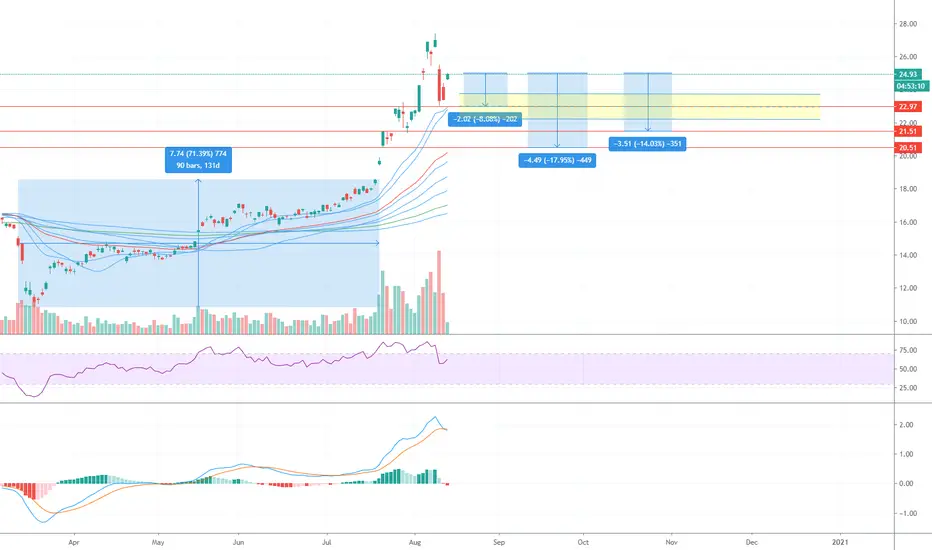
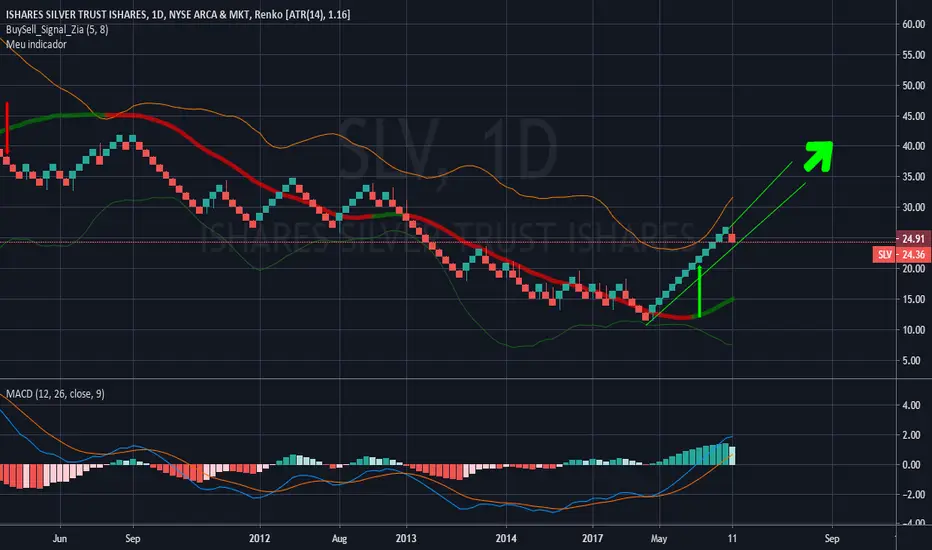
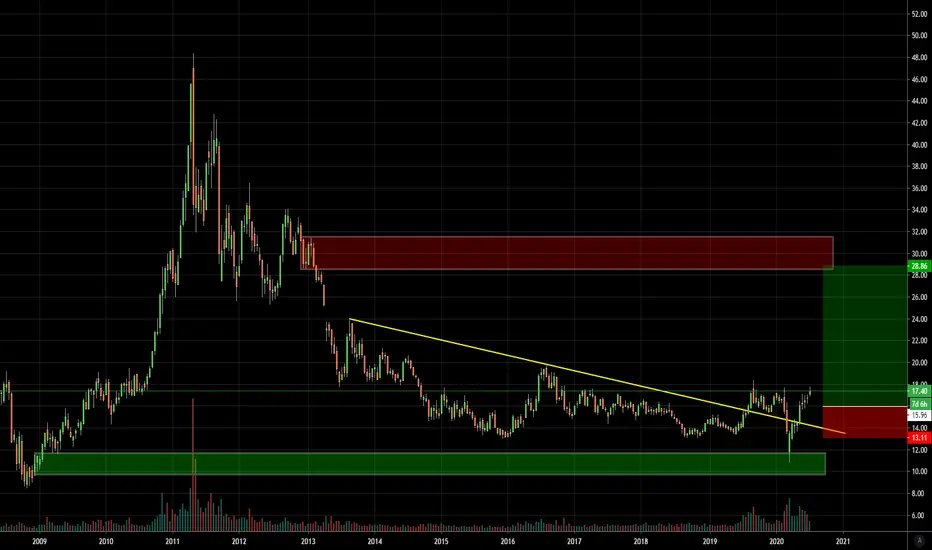
SLV support levels - OpportunitySLV currently sitting at strong support from 2011, 2012, 2013, with a big gap down to next major support level at $23-ish.
As long as Fed keeps promising to print money and dollar continues to look weak in the long term, I am loading up here. This pullback is very bullish and much needed, shaking out the weaker players.