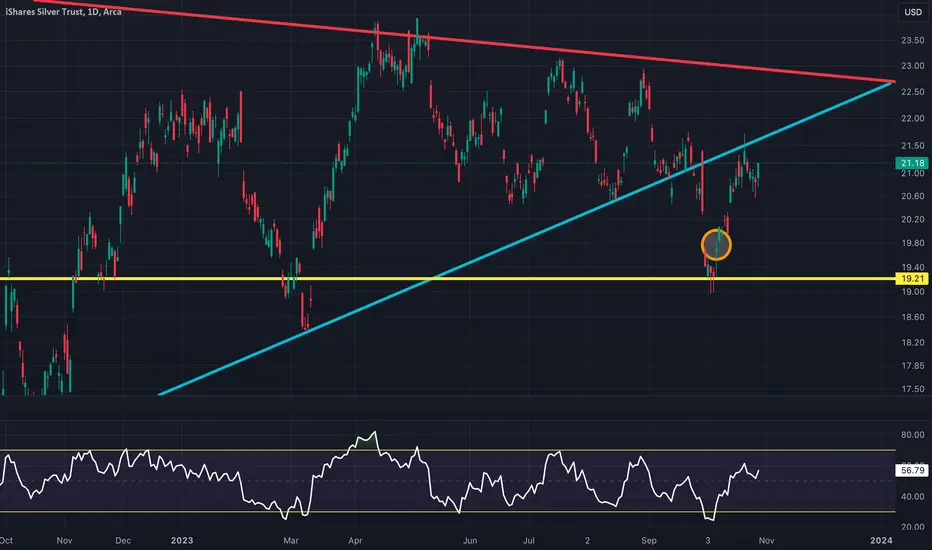
Bitcoin, GOLD, and SLV Rose Sharply From Israel-Hamas WarCommodities and Bitcoin experienced significant increases in value around October 7, which is the date that the Israel-Hamas War started. Commodities and Bitcoin experienced significant increases in value around October 7, which is the date that the Israel-Hamas War started. SLV had a bullish bounce off the yellow trend line on Friday October 6 (marked by the orange circle). The Israel-Hamas conflict started on Saturday, and on Monday SLV started its uptrend.
Key Price Levels:
The light blue trend line is acting as short-term resistance that is suppressing SLV's price, but the longer term target is the red trend line if SLV can continue to climb higher. The yellow trend line is a key support level to monitor for a bounce if SLV drops back down.
SLV trade ideas
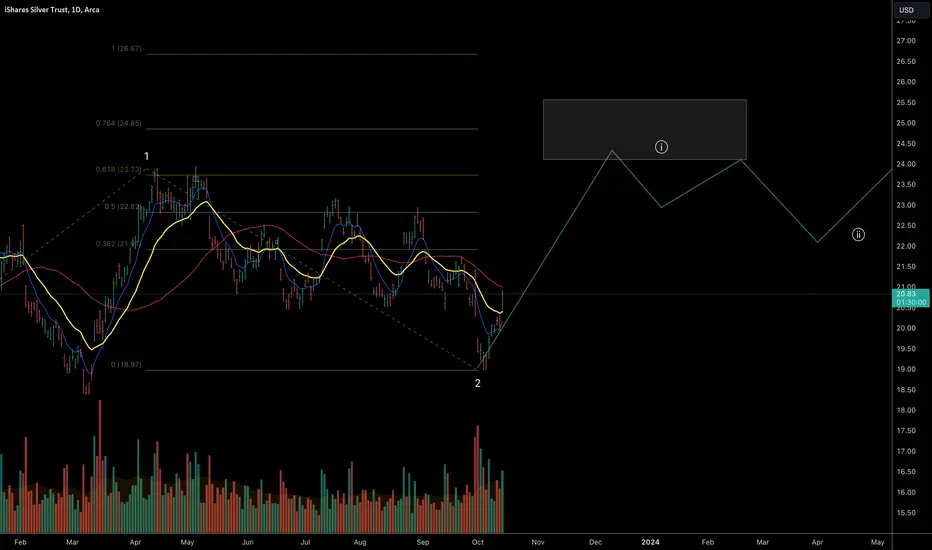
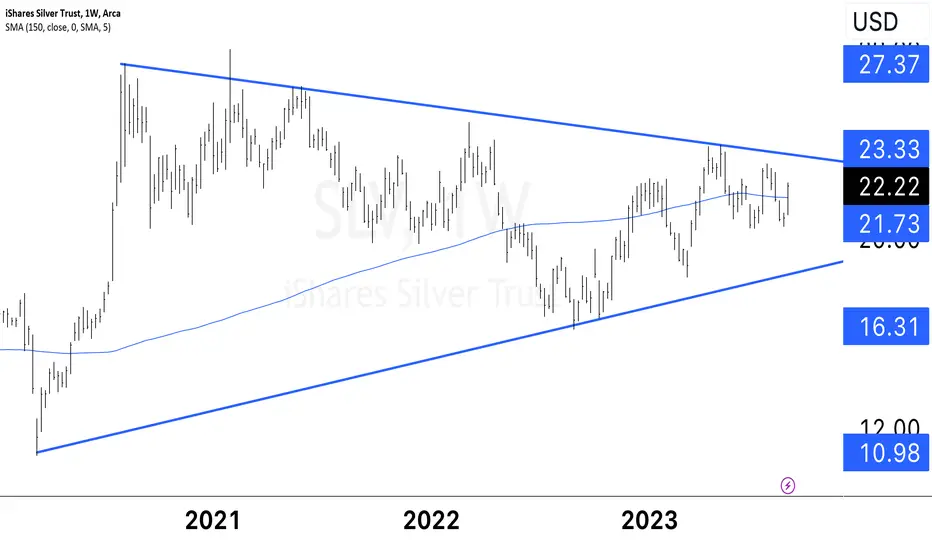
Will silver shine again? As in gold, possibility for a new bull market in SLV is in the cards for coming 2024.
The price structure* on weekly time-frame suggests there is a high chance that SLV, has found its bottom last year in Sep'22 and with higher low this year in Oct'23.
As long as Oct low holds, I would expect the price to move toward next resistance zones: first 22 and later important 24-25 zone. Afterwards, if price builds a handle and breaks-out above 24 that would confirm the move to 27-30-32 resistance area.
Overall, traditional fear-type assets look mid to long-term bullish to my eyes in coming months and years.
Trading thesis : I need the price to confidently move above 50D MA, and create at least short base with several days/a week of consolidation around previous basing attempts (most recent being around 21) with later break-out above this pivot to consider longs.
* Important caveat to EW: I use it solely to have a subjective idea about sentiment and overall structural context to support, but not guide, my investing decisions. Price and volume is the key, and only price pays, not the fibonacci resistance or any wave count.
Time to start a position in SLVSLV is looking very attractive at these levels.
It has entered my first gap fill starter position area.
I'm starting to add here.
RSI & COT are both looking favorable for a swing up from here.
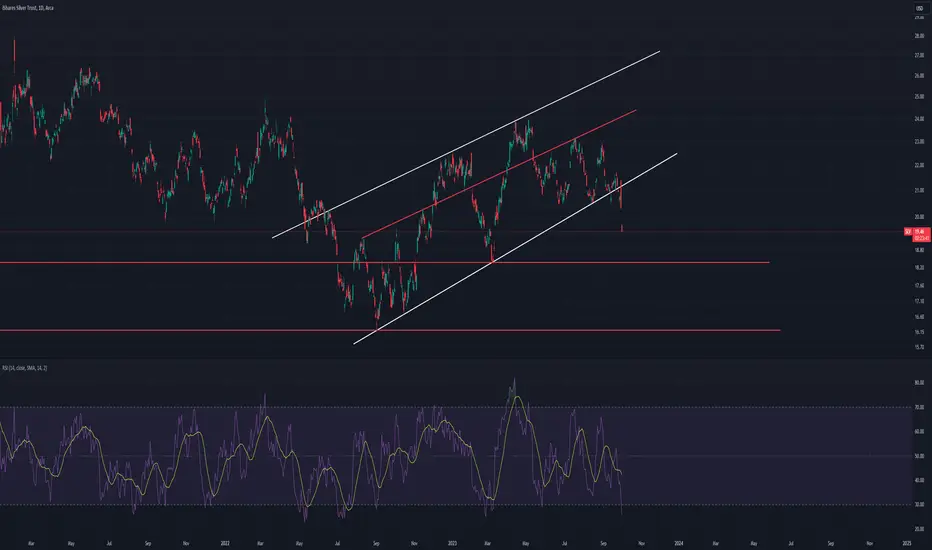
SLV: break of support channelBreaking the support may push SLV down.
But metals are the first to recover after or during inflation.
I think Gold and silver are not yet priced in for the inflation we are seeing and we are going to see.
I guess we will have metals reach ATH in 2024 when machine starts to print again.
Gold and Silver are always upfront in running to catch the inflation.
See 2020 gold run to understand how they price in inflation faster than other assets. AMEX:SLV
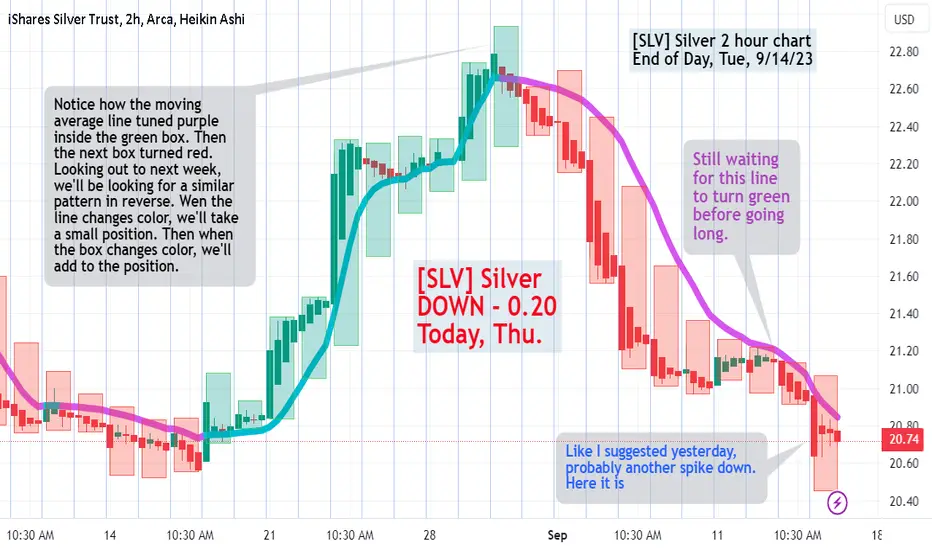
[SLV] As suggested yesterday, here's that dip.Almost forgot to post this today. Posting these charts is still new to me. Anyway... Notice how the moving average line tuned purple inside the green box. Then the next box turned red. Looking out to next week, we'll be looking for a similar pattern in reverse. Wen the line changes color, we'll take a small position. Then when the box changes color, we'll add to the position.
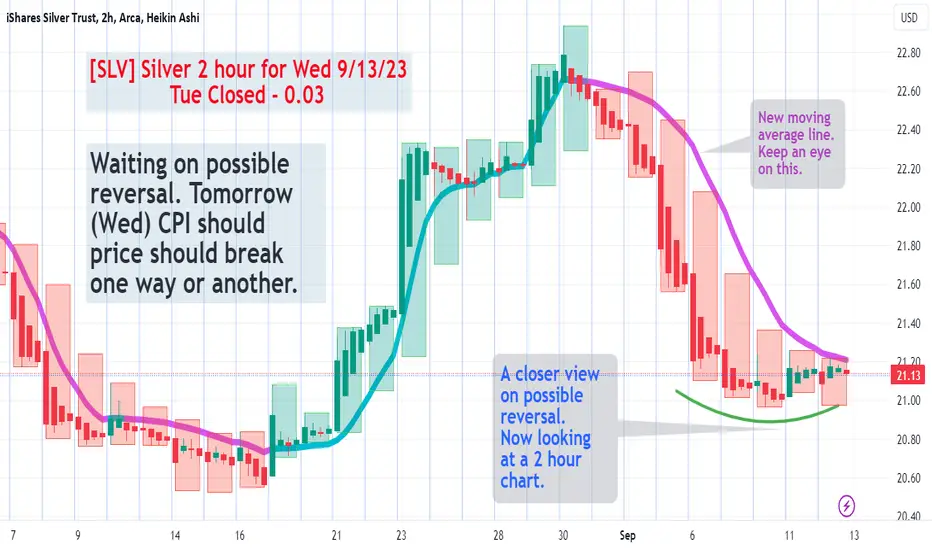
[SLV] Silver Flat Today | Waiting for CPI TomorrowGetting used to this new indicator. Let's see if I can call buy and sell points correctly. Added a new moving average. All experimental. Let me know what you think.
[SLV] for Tue 9/11/23 | Possible Reversal StartingThis is a 4 hour chart. Like daily charts they move VERY slow. None the less, notice a possible reverse head and shoulders pattern forming in the lower left hand corner. Could this be the beginning of a possible reversal? Let's wait and see before taking a position. Also... I added the multi-timeframe boxes which makes this pattern more obvious.
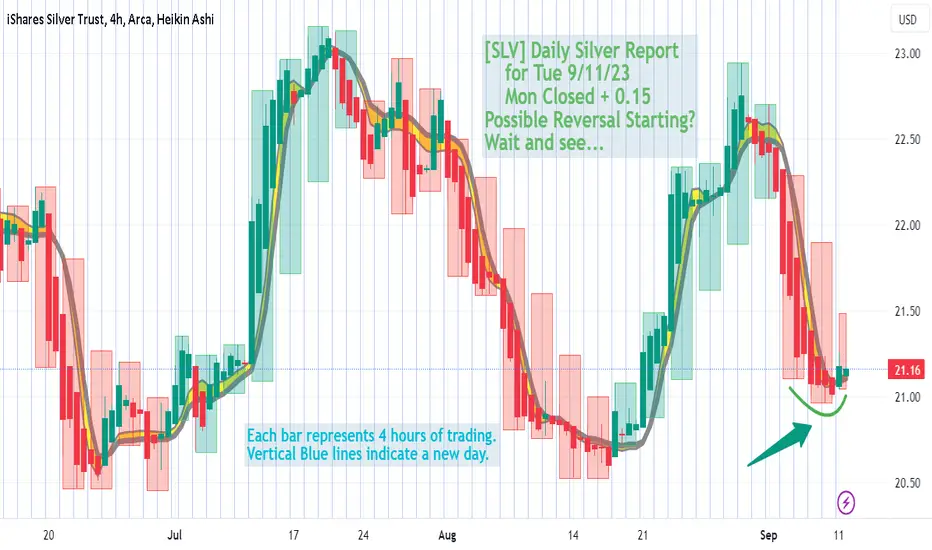
Daily [SLV] Report for Mon, 9/11/23Just thought I'd try posting a daily report. This is the first of hopefully many more. Let's see ow long I can do this. At some point, (hopefully soon), I will be placing a swing trade. That is lasting a week or two.

SLV Explosive Move coming, 66% probability - BullishA move similar to magnitude of Spring 2020 is lining up, with bullish tilt.
ready, set, GO!
The information and publications are not meant to be, and do not constitute, financial, investment, trading, or other types of advice or recommendations.

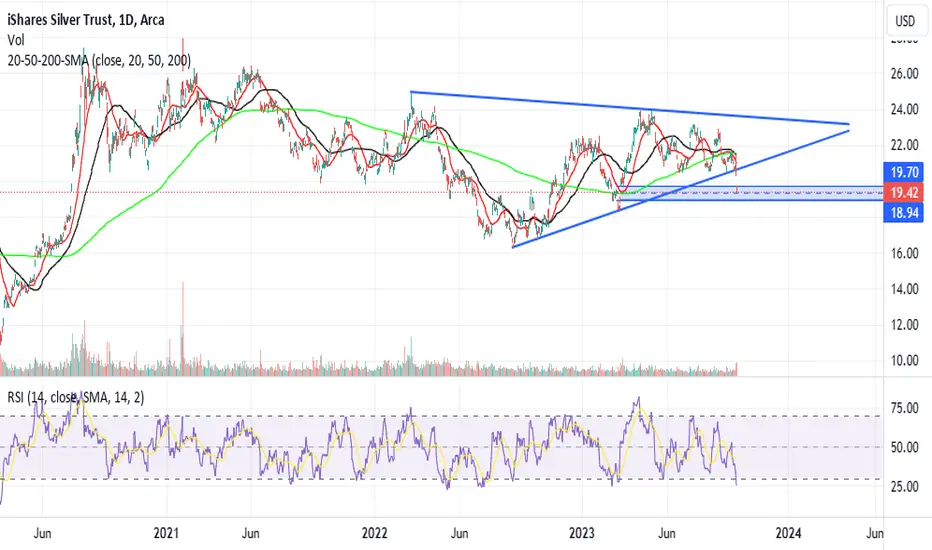
$SLV Ascending Triangle Chart PatternsAMEX:SLV Bullish Ascending Triangle Chart Pattern. A "bullish triangle pattern" is a continuation pattern commonly observed in technical analysis. It is formed by converging trend lines that connect a series of higher lows and relatively equal highs. This pattern indicates a temporary consolidation phase within an ongoing uptrend, often followed by a resumption of the upward movement. Here's how it works:
1. **Construction:** A bullish triangle pattern is created by drawing a trend line connecting higher lows and a horizontal resistance line connecting relatively equal highs.
2. **Converging Trend Lines:** As time progresses, the price movements within the triangle become confined within the converging trend lines, forming a contracting triangular shape.
3. **Decreasing Volatility:** The range between the higher lows and lower highs gradually narrows, indicating decreasing volatility and potential indecision among traders.
4. **Bullish Bias:** The bullish nature of this pattern is due to the formation occurring within an established uptrend. It suggests that despite the consolidation, buyers are still active, preventing a significant downward movement.
5. **Breakout:** Eventually, the price will reach the apex of the triangle, where the trend lines intersect. A breakout occurs when the price moves decisively above the horizontal resistance line, confirming the pattern.
6. **Target:** The breakout is usually accompanied by an increase in trading volume, signifying renewed interest. Traders often use the height of the triangle at its widest point as a guide to estimate the potential price move after the breakout.
It's important to note that while bullish triangle patterns can provide insights into potential price movements, they are not guaranteed to result in a specific outcome. False breakouts can occur, where the price initially moves beyond the resistance line but then reverses back into the triangle. To minimize risks, traders often wait for a confirmed breakout, consider using other technical indicators for confirmation, and implement proper risk management strategies.
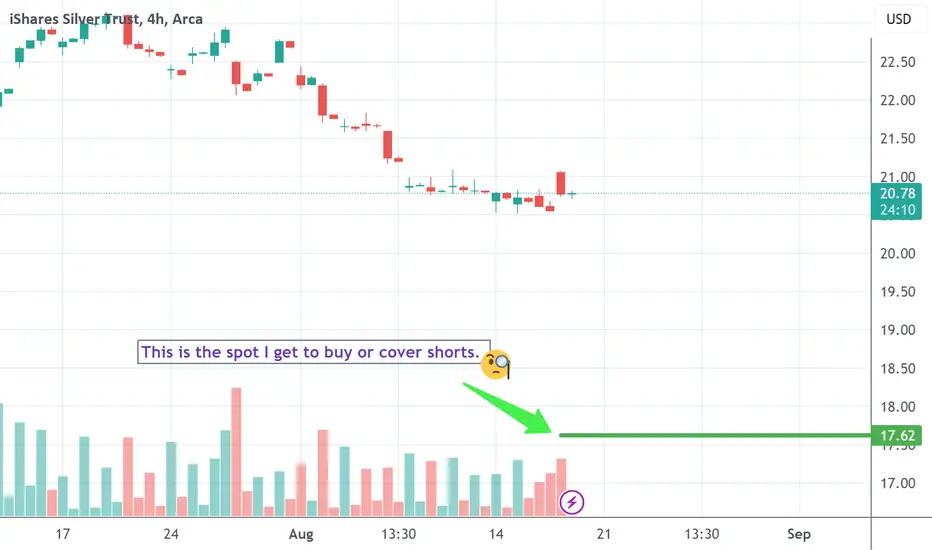
SLV watch $17.63 area to BUYWe're getting into a time window soon for metals in September. I already did a GLD idea and had an alert go off today as it's getting into my buy zone pretty soon.
In SLV, however, it seems like it has a lot further to fall, but the same idea stands, it's a place to buy it I think for a longer term reversal up.
I've seen metals in years past have some seasonality in the fourth quarter, and I do have dates in early September from my dowsing for the best time to buy them.
I get the price consistently of $17.xx as the low, and specifically, 17.63. I don't expect to be exact, but it can be helpful and I need the practice!
If we get SLV (and GLD for that matter) around target lows in early to mid September, I like them long and will update with the targets for the highs at that time. Peace.
Silver to 223After a strong bearish movement, we could see a bullish movement!
Entrance= 22.24
SL=23.33
TP=21.5

SLV (Silver ETF) - Daily - Bearish Momentum PotentialSilver ETF (SLV) is exhibiting bearish momentum on its daily chart.
Price has been rejected twice under the yellow resistance trendline.
Oscillators are also starting to lean bearish.
Potential downside targets (short-term) could be -5% to -10% down.
Bearish Target(s): $22.33, $20.86.
However, if price breaks out and holds above $24, this idea would be negated.

Is this Woo-Woo? Absolutely, it is. Get in here.I've not been doing a lot of technical analysis, but I really don't even need to keep up with it! I just come back every few months or years and check out my pitchforks. They're always giving me such an interesting perspective into the market.
If my pitchforks align with my love for Wyckoff Cycles (forextraininggroup.com), I trade those.
Today, for no reason, I added a little fib fan. I also added some grey boxes which were informed by various fib projections where I think the price action will be a knife fight. I added some red boxes where I lose total interest in a long position. I think the chart speaks for itself! Enjoy.

SLV to retrace partial advance as dollar bouncesLooking for SLV to give back some of its gains as it does some backing and filling. Think the dollar bounces here offering a challenging environment for precious metals.

SLV OutlookJust a look at where it's been, and where it can go based on where it's been.
Entering one of the oldest seasons we have; realization and dependence on basic things like service and what we use the most. Typically, materials like rocks bring value, cause governments and government made cash doesn't. This season will be different than all others.
What has held value the most through all of known time?
Beliefs and opinions.
So be aware of what beliefs and opinions others hold, and have held through all of time. Who knows, someone else is likely to be more convicted of their beliefs than you , and to such an extent to commit their life to it.
Might be good to know what their beliefs are based on, regardless if you agree or not.
Silver is getting extended!Silver is looking like a high probable short opportunity.
its already very extended and overbought, but it may want to tag or pierce the orange trendline.

Silver Breakout
It seems like the US Dollar Index has peaked (as of now) at 108 which pushed gold and silver down drastically. But we could be on the verge of a massive breakout in silver, back up above $25 an ounce as well as gold back above $1900.
You could start a position now incase silver continues upward or wait for DXY to fall below 100, but by then, you may miss a significant rally in silver.

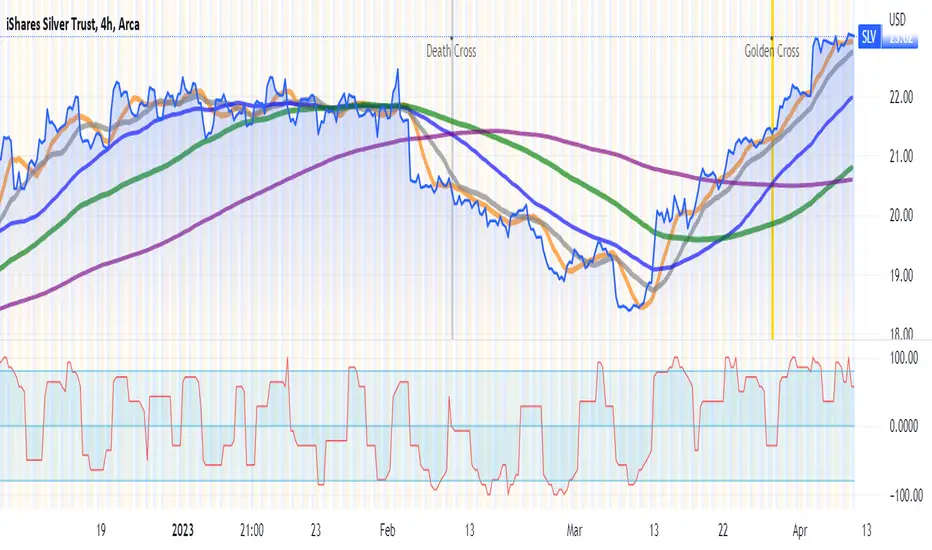
SLV ETF is screaming with a BUY signalSilver may outperform gold for the short term as SLV is screaming for attention. It just had a recent golden cross along with a by-signal measured by Aroon up. So don't miss out on this one at all! I'm also testing the same theory with other highly liquid ETFs as well for tomorrow's trading day.
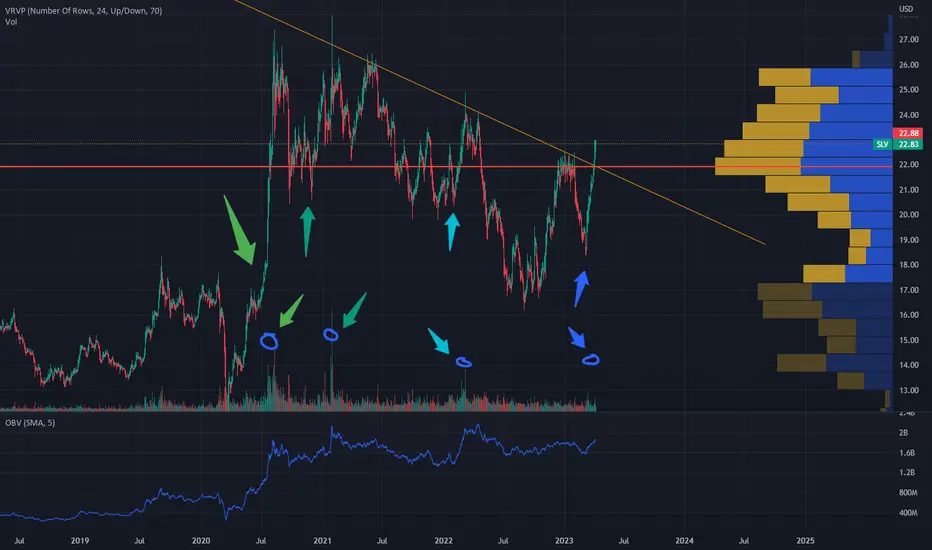
Collect Silver to Collect GoldSLV Breaking out, With Volume. See ON Balance volume to See relative volume on balance (already purchased) than in the past volume spikes. Consider supply vs demand if inflation continues.
Educational Resource:
www.youtube.com
Background:
Gold is Nearing All Time highs.
Silver is at about 1/2 of its pervious ATH.
COMEX:SI1!
tradingview.sweetlogin.com
Silver is Becoming more valuable in comparison to gold.
www.bullionbypost.com
Gold To silver Ratio coming down, signifying that one ounce of gold is becoming easier to buy with less silver.
As long as inflation remains persistent, and the interest rate remains around 5%, the issue of inflation will not go away unless these two numbers cross. Meaning that inflation will continue to grow, not shrink, and the problem remains. Right now economists are happy with a shrinkage in the rate of growth of inflation, indicating the issue is NOT YET RESOLVED. The Next FOMC is in the first week of May. WE have 3/4 of a month left.
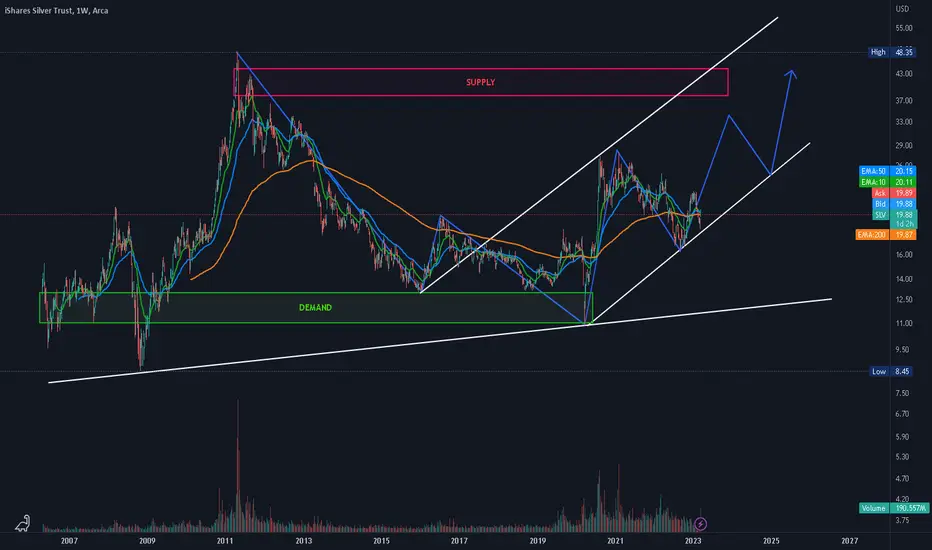
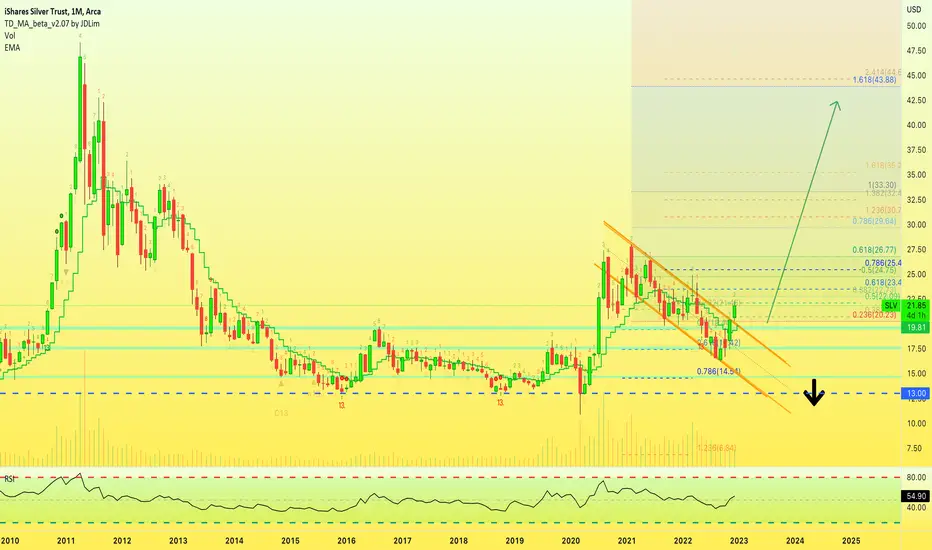
💿 iShares Silver Trust | Aims $26, $33 and $44iShares Silver Trust (SLV) is developing a strong bullish bias based on this long-term, monthly, chart.
First, Silver peaked in April 2011 (left side of the chart).
This is followed by a strong bear market that hit a low in December 2015.
This low is tested again March 2020 thanks to Covid.
The whole period from late 2015 to early 2020 can be considered a consolidation phase.
After the March 2020 low, which set the lowest price since February 2009, a new bullish wave develops.
With a higher low set in September 2022 and now strong bullish action/signals developing, Silver is aiming at a higher high.
The targets based on Fib. proportions together with EW theory go as follow:
1) $23.4
2) $29.6
3) $33.3
4) $43.8
This setup is invalidated with a monthly close below $13.0.
This is super-long-term.
Thank you for reading.
Namaste.
SLV had a strong breakoutSLV had a strong breakout, but is getting extended but is still very strong, supply on the left is rather scattered and not definite zone. Metals can have impulsive emotional moves, and can reverse reverse quickly
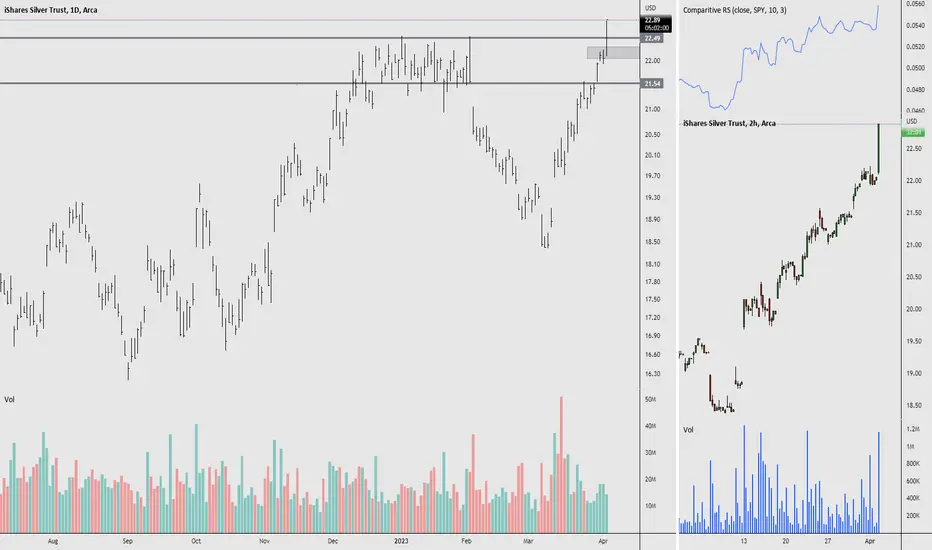
Head and Shoulders Bottom | 12% move possibleiShares Silver Trust forms bullish "Head and Shoulders Bottom" chart pattern
"Head and Shoulders Bottom" chart pattern formed on iShares Silver Trust (SLV:NYSE). This bullish signal indicates that the stock price may rise from the close of $21.94 to the range of $24.10 - $24.60. The pattern formed over 35 days which is roughly the period of time in which the target price range may be achieved, according to standard principles of technical analysis.
Tells Me: The price seems to have reached the end of a period of "accumulation" at the bottom of a major downtrend; the break up through resistance signals a reversal to a new uptrend.
The Head and Shoulders Bottom is created by three successive declines in the price following a significant downtrend. The lowest low (head) is in the middle, flanked by two higher lows (shoulders) at roughly the same level. Volume is highest as the price makes the first two declines, then diminishes through the right shoulder. Finally volume surges as the price closes above the neckline (drawn between the two highs) to confirm the reversal.
