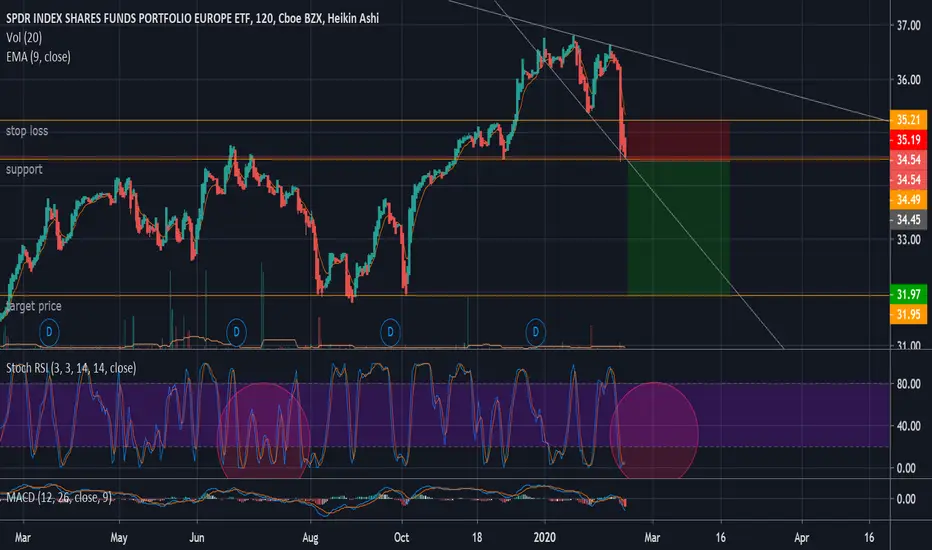
Coronavirus trade & macro uncertainty 34$ 3/20 Puts. good insurance with Corvid-19 fears at large and Italian open borders with EU
Key stats
About SPDR Portfolio Europe ETF
Home page
Inception date
Oct 15, 2002
Structure
Open-Ended Fund
Replication method
Physical
Dividend treatment
Distributes
Distribution tax treatment
Qualified dividends
Income tax type
Capital Gains
Max ST capital gains rate
39.60%
Max LT capital gains rate
20.00%
Primary advisor
SSgA Funds Management, Inc.
Distributor
State Street Corp. (Fund Distributor)
SPEU offers plain vanilla exposure to equities from Western European nations, defined as Austria, Belgium, Poland, Denmark, Finland, France, Germany, Ireland, Italy, Luxembourg, the Netherlands, Norway, Portugal, Spain, Sweden, Switzerland and the United Kingdom. Fund documents avoid the term developed Europe, possibly since Poland is viewed as either developed or emerging depending on the classifying entity. SPEU offers market-cap-weighted exposure to companies in this country across the firm size spectrum. Only the smallest 5% of firms are eliminated, and these wouldnt move the dial much in this context. Prior to Sept 23 2019, the fund tracked a mega-cap Europe index under the ticker FEU.
Related funds
Classification
What's in the fund
Exposure type
Finance
Health Technology
Consumer Non-Durables
Stock breakdown by region
Top 10 holdings
Summarizing what the indicators are suggesting.
Oscillators
Neutral
SellBuy
Strong sellStrong buy
Strong sellSellNeutralBuyStrong buy
Oscillators
Neutral
SellBuy
Strong sellStrong buy
Strong sellSellNeutralBuyStrong buy
Summary
Neutral
SellBuy
Strong sellStrong buy
Strong sellSellNeutralBuyStrong buy
Summary
Neutral
SellBuy
Strong sellStrong buy
Strong sellSellNeutralBuyStrong buy
Summary
Neutral
SellBuy
Strong sellStrong buy
Strong sellSellNeutralBuyStrong buy
Moving Averages
Neutral
SellBuy
Strong sellStrong buy
Strong sellSellNeutralBuyStrong buy
Moving Averages
Neutral
SellBuy
Strong sellStrong buy
Strong sellSellNeutralBuyStrong buy
Displays a symbol's price movements over previous years to identify recurring trends.
Frequently Asked Questions
An exchange-traded fund (ETF) is a collection of assets (stocks, bonds, commodities, etc.) that track an underlying index and can be bought on an exchange like individual stocks.
SPEU trades at 48.56 USD today, its price has risen 0.27% in the past 24 hours. Track more dynamics on SPEU price chart.
SPEU net asset value is 48.52 today — it's risen 0.08% over the past month. NAV represents the total value of the fund's assets less liabilities and serves as a gauge of the fund's performance.
SPEU assets under management is 684.21 M USD. AUM is an important metric as it reflects the fund's size and can serve as a gauge of how successful the fund is in attracting investors, which, in its turn, can influence decision-making.
SPEU price has fallen by −0.88% over the last month, and its yearly performance shows a 17.98% increase. See more dynamics on SPEU price chart.
NAV returns, another gauge of an ETF dynamics, have risen by 0.08% over the last month, showed a 6.36% increase in three-month performance and has increased by 21.22% in a year.
NAV returns, another gauge of an ETF dynamics, have risen by 0.08% over the last month, showed a 6.36% increase in three-month performance and has increased by 21.22% in a year.
SPEU fund flows account for 248.35 M USD (1 year). Many traders use this metric to get insight into investors' sentiment and evaluate whether it's time to buy or sell the fund.
Since ETFs work like an individual stock, they can be bought and sold on exchanges (e.g. NASDAQ, NYSE, EURONEXT). As it happens with stocks, you need to select a brokerage to access trading. Explore our list of available brokers to find the one to help execute your strategies. Don't forget to do your research before getting to trading. Explore ETFs metrics in our ETF screener to find a reliable opportunity.
SPEU invests in stocks. See more details in our Analysis section.
SPEU expense ratio is 0.07%. It's an important metric for helping traders understand the fund's operating costs relative to assets and how expensive it would be to hold the fund.
No, SPEU isn't leveraged, meaning it doesn't use borrowings or financial derivatives to magnify the performance of the underlying assets or index it follows.
In some ways, ETFs are safe investments, but in a broader sense, they're not safer than any other asset, so it's crucial to analyze a fund before investing. But if your research gives a vague answer, you can always refer to technical analysis.
Today, SPEU technical analysis shows the buy rating and its 1-week rating is strong buy. Since market conditions are prone to changes, it's worth looking a bit further into the future — according to the 1-month rating SPEU shows the buy signal. See more of SPEU technicals for a more comprehensive analysis.
Today, SPEU technical analysis shows the buy rating and its 1-week rating is strong buy. Since market conditions are prone to changes, it's worth looking a bit further into the future — according to the 1-month rating SPEU shows the buy signal. See more of SPEU technicals for a more comprehensive analysis.
Yes, SPEU pays dividends to its holders with the dividend yield of 2.91%.
SPEU trades at a premium (0.08%).
Premium/discount to NAV expresses the difference between the ETF’s price and its NAV value. A positive percentage indicates a premium, meaning the ETF trades at a higher price than the calculated NAV. Conversely, a negative percentage indicates a discount, suggesting the ETF trades at a lower price than NAV.
Premium/discount to NAV expresses the difference between the ETF’s price and its NAV value. A positive percentage indicates a premium, meaning the ETF trades at a higher price than the calculated NAV. Conversely, a negative percentage indicates a discount, suggesting the ETF trades at a lower price than NAV.
SPEU shares are issued by State Street Corp.
SPEU follows the STOXX Europe TMI. ETFs usually track some benchmark seeking to replicate its performance and guide asset selection and objectives.
The fund started trading on Oct 15, 2002.
The fund's management style is passive, meaning it's aiming to replicate the performance of the underlying index by holding assets in the same proportions as the index. The goal is to match the index's returns.