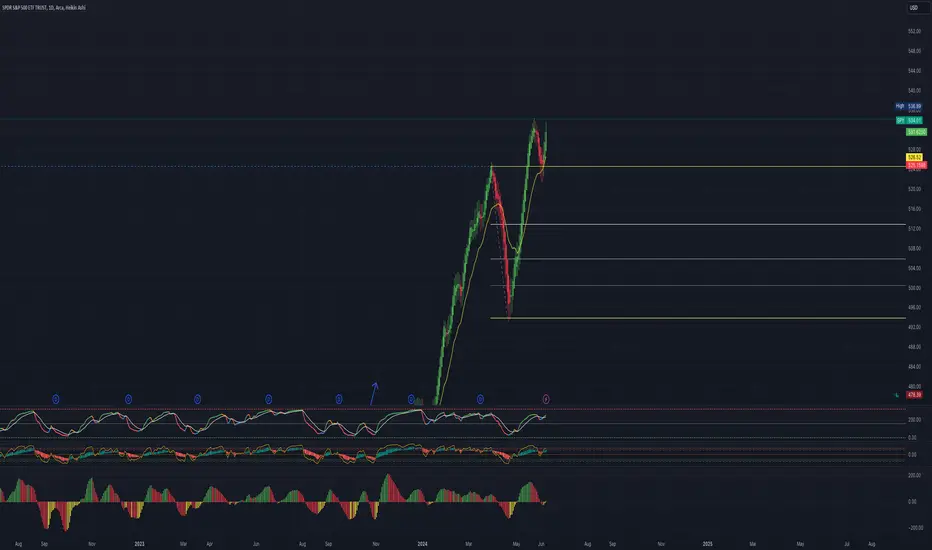
SPY: Pullback or No? Hey everyone,
Posting again for next week.
My thoughts, not advice as usual.
Hope you find them helpful and I hope you all have a great and sunny weekend!
Take care and safe trades!
SPY trade ideas

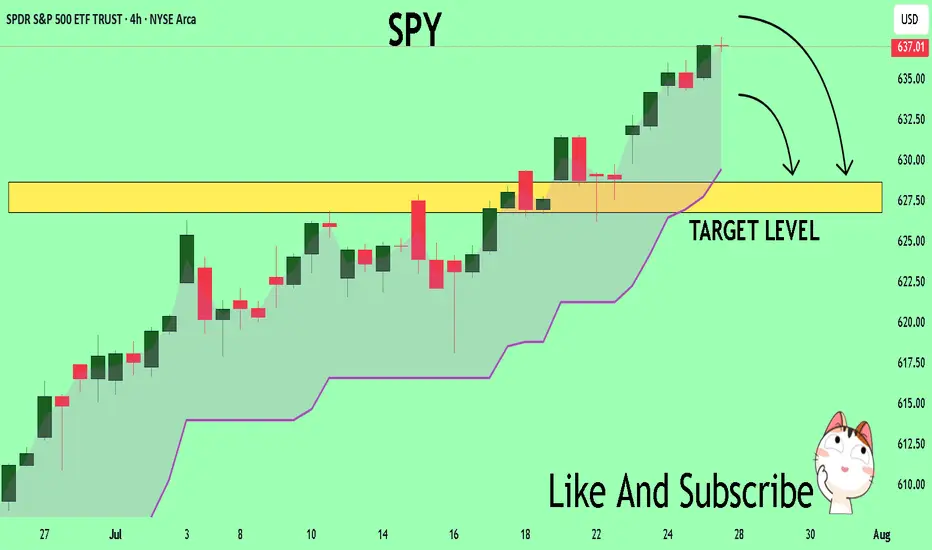
Spy.. 650 topLooking for a top this week
The top of this monthly trendline dating from 2009 should be tagged this week around 643-645.00. As you can see price can grind up here for weeks until the BIG drop.
That grind would possibly be distribution with
A range trade of 620-640 for the month of august. historically Sept is very bearish and could see a drop back below 600 then.
Summer price action looks like so
Smaller price action (Tradeable technicals)
Bull flag early July has us squeezing up this last leg here..
If we gap up Sunday night then i like the short around 638ish
If we gap down and flush i like the dip buy around 634 gap close with the next target being 640+
Daily candle closed outside Bbands so I would not long this on any gap up... on a big earnings week like this, there will be a shake out day or a flush to try and stop out all of those who bought long last week for this weeks earnings.
TVC:NYA or NYSE
Has also reached the top of its weekly channel here. 21,000 will be tough. Price could grind up here but I'd be careful trading anything non tech.
As far as tech goes
Here's NASDAQ:QQQ
monthly chart (Logarithmic)
We have room for 575-580
This should compliment Spy 550
Zoomed in on the daily chart and it's climbing back up to the resistance shown on the monthly
Hourly chart shows price action from early july... tight channel illustrates how frustrating the swings have been
562-563 is support heading into next week. If we have a major gap up Sunday night I would look to open short near 570 for a pullback before ER... if we gap down, I would buy the dip around 563 and average down if need be down to 561..
We should tag 575 this week
The sector that I think lags the most this week is the banking sector... AMEX:XLF
Banks outperform the entire market last week and are overheated at resistance I think they lag this week
I will update this more throughout the week if necessary..
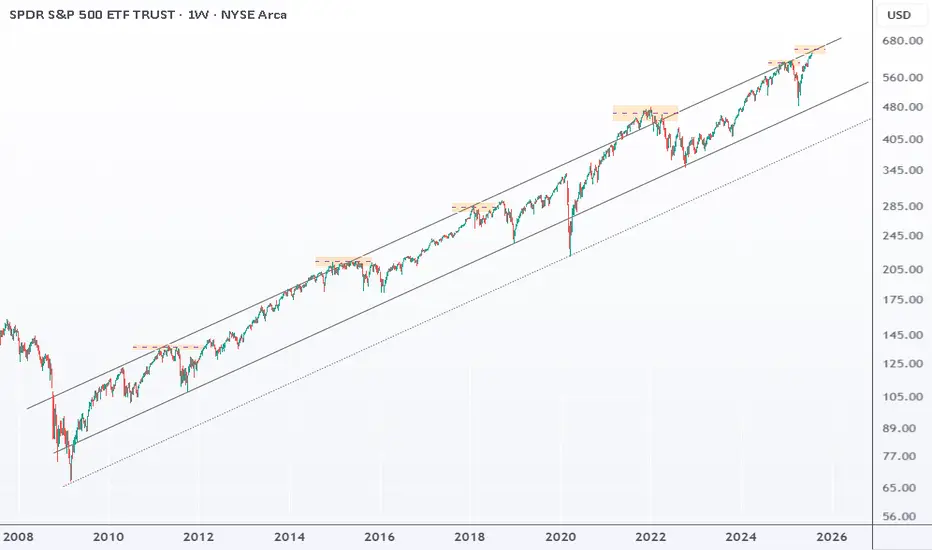
SPY : back near the top of its upward channelSPY is back near the top of its upward channel, a strong resistance.
Every time this happened since 2011, markets dropped 10–27%.
Still trending up, but this setup doesn’t look great.
Since the April low, SPY is up 30%, short-term trend is stretched and vulnerable.
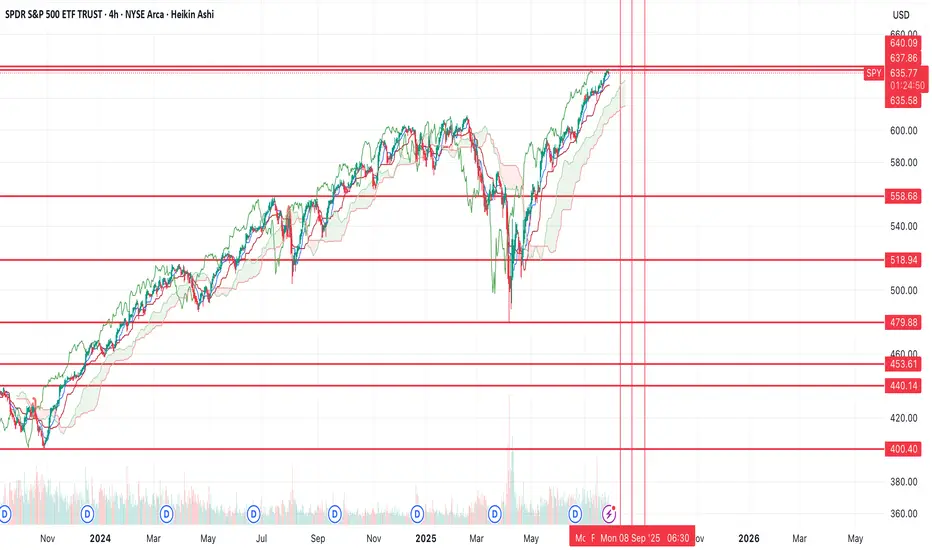
$SPY rolling over, potentially to new lows?While I was early to the idea (like usual), still don't think the thesis will be wrong. I still believe we're going to see a large move down from here.
Yesterday's price action made me pretty confident a top was in (TBD). We had positive news and the market couldn't rally on that positive news and we ended up closing at the lows -- indicating to me there's no more buyers.
Today we have treasuries, the dollar and volatility all rallying while equities selloff, a classic risk off signal. You also have crypto selling off too.
I think we see a large risk off move from here on out, the target is the $440 area (extreme down to $400), but if we find support at one of the other levels above that, there's potential for us to rally from there.
Will have to see how price action plays out over the coming weeks.
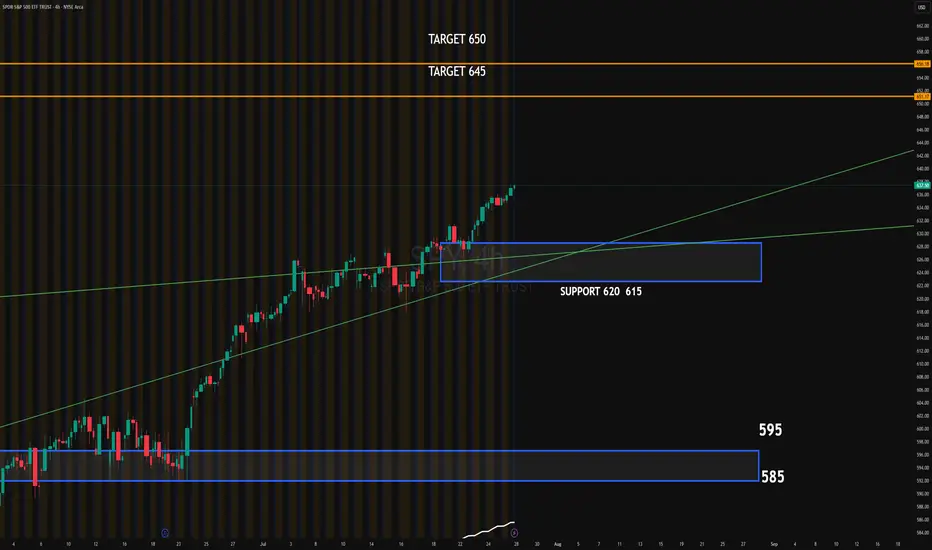
SPY 4HSSPY continues its bullish trend after breaking above the ascending channel. The recent breakout shows strong momentum, supported by institutional absorption around the 620–615 zone. This area now acts as key support.
Upside target: 645
Extended target: 650
Downside target if momentum fails: 620–615 zone, followed by 595
#SPY #globaltrade #investment #investing #stockmarket #wealth #realestate #markets #economy #finance #money #forex #trading #price #business #currency #blockchain #crypto #cryptocurrency #airdrop #btc #ethereum #ico #altcoin #cryptonews #Bitcoin #ipo
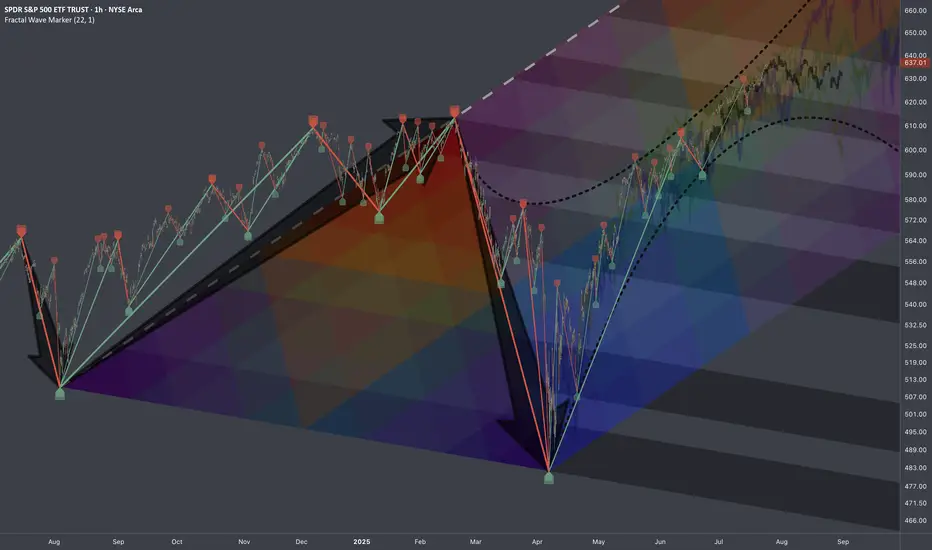
$SPY: Mapping Scenarios🏛️ Research Notes
Fractal Corridors
Shows recursive formations which indicates a full fractal cycle.
The angles of decline are parallel which is important for potential buildup.
To map a cycle we'd need to apply fib channel to the opposite direction In a way this should be sufficient to cover the scenarios of nearest future if we were to use bar patterns to validate a structure.
These are examples of historic progressions with similar growth patterns (composite sub-cycles):
This explains most elements present in interactive chart.
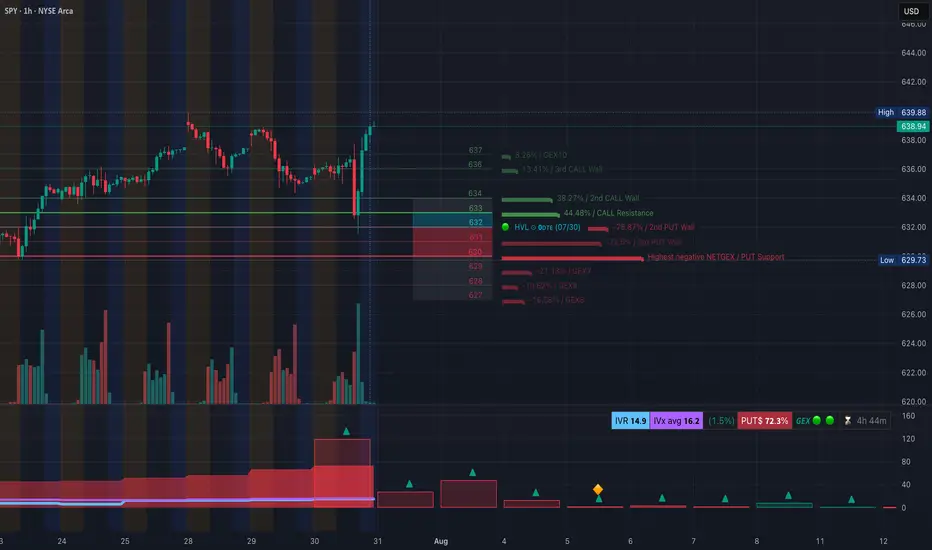
SPY Back from the Dead! Gamma Reclaim or One-Day Trap? Jul 31SPY Back from the Dead! Gamma Reclaim or One-Day Trap? 638 is the Battleground
🔍 GEX & Options Flow Insight (1st Image Analysis)
SPY surged off strong PUT support at ~630 and is now pressing into the CALL Resistance wall at 633–634, with upward momentum and a surprising gamma flip. However, it's running right into a stacked supply zone just below the next big Call Wall at 638.
* Call Walls & Resistance:
* 📍 633.78–634.34 → CALL Resistance + HVL zone
* 📍 636.39 → 2nd Call Wall (38.27%)
* 🧱 638.88–639.88 → GEX10 territory = squeeze potential, if bulls hold
* Put Support Zones:
* 🛡️ 632.00–631.00 → Flip zone from PUT-dominated to long gamma
* 🚨 629.73 → Highest negative NET GEX = anchor support
* 📉 626.19 → Breakdown risk zone
* Volatility Insight:
* IVR 14.9, IVx Avg 16.2 → Low volatility = cheap contracts
* PUTs Dominant at 72.3% = Dealer long gamma positioning
* GEX sentiment: 🟢🟢🟢 → Reversal confirmed into bullish territory
✅ Option Trading Suggestion:
Bias: Reversal long, but cautious at 638–640 resistance
Strategy: Vertical debit call spread or butterfly
* Entry Idea: Buy 636C / Sell 640C for Aug 2 or Aug 5 expiry
* Aggressive alternative: Naked 638C if breakout continues with volume
* Invalidation: Strong rejection + close back under 634
* Target: 638.88 → potential extension to 640–641.5
Why this works: SPY is squeezing dealers short from earlier PUT dominance. The reclaim above 633 into the gamma-neutral zone triggered forced hedging. If momentum holds above 636, short calls must be covered → squeeze scenario.
🧠 Technical Analysis (1H Chart) (2nd Image Analysis)
Market Structure & SMC:
* 🔄 CHoCH → BOS → CHoCH → BOS again = high volatility reversal sequence
* SPY just broke out of descending wedge and reclaimed supply
* Current price is inside a major supply zone (purple box 636–639)
Trendline Dynamics:
* Broken wedge trend now back-tested
* Price at upper channel boundary — watch for rejection or breakout confirmation
SMC Zones:
* 🟥 Supply Zone (Purple Box): 636–639.88 → historical resistance
* 🟩 Demand Zone: 631–632.5 → HVL flip zone + previous OB
* 🚨 Breakdown below 629.73 → back into bearish territory
🔄 Price Action & Key Levels
* Support:
* ✅ 634.34 → 633.78 → Flip zone from gamma trap
* ✅ 631.00 → 629.73 → OB + Put Wall cluster
* 🔻 626.19 → Final support before further downside opens
* Resistance:
* 🚩 636.39 → 638.88 → Multiple Call Walls + supply
* 🧱 641.65 → Next upside zone = GEX extension if breakout
🧭 Scalping / Intraday Trade Setup
🟩 Bullish Setup (Preferred Now):
* Entry: 634.00–635.00 breakout hold
* Target 1: 638.00
* Target 2: 641.00
* Stop: Below 632
🟥 Bearish Fade Setup:
* Entry: Rejection at 638.88 + high-volume stall
* Target 1: 634.50
* Target 2: 631.50
* Stop: Breakout above 640
🔁 Summary Thoughts
* SPY is in recovery mode, reversing from a gamma-led flush and now facing resistance at a stacked CALL wall zone.
* Dealer positioning flipped positive. If bulls hold above 636, 640+ is realistic.
* However, failure to break 638.88 will turn this into a short squeeze fade.
* Scalpers can ride the momentum if price consolidates above 634. Rejection at 638 is the line between breakout and fakeout.
🚨 Disclaimer:
This analysis is for educational purposes only and does not constitute financial advice. Always do your own research and manage your risk accordingly.
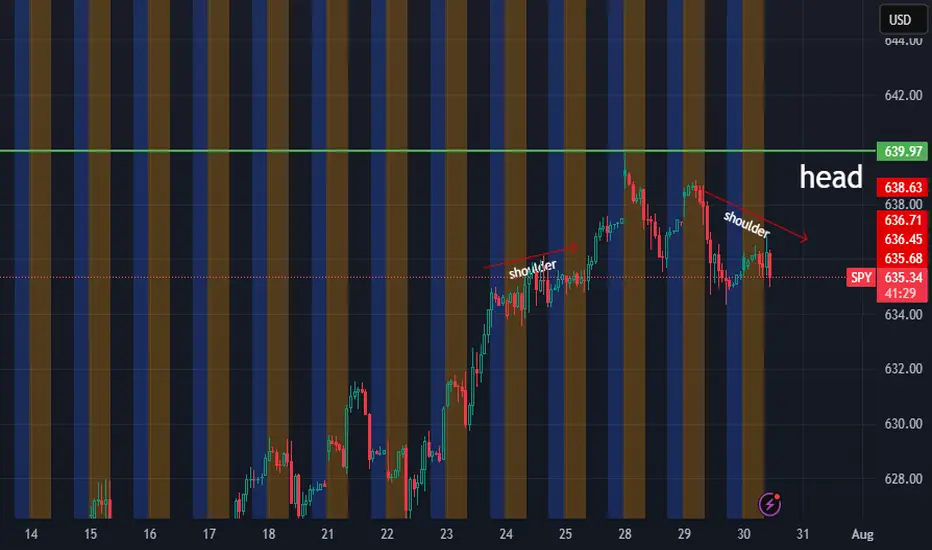
short IdeaLooking at the hourly chart, and I am noticing a head and shoulders build up.
day trade idea: 635 entry 637 stop 630 profit target
swing trade idea: short above 630 long below
The Current State and Future Direction Of The S&P 5006/9/24
Created By Joeseph Emanuel Dennis
Idea:
Critical area and critical moment in not only the NASDAQ but for the entire bull market otherwise we'll start a prolonged retracement or an unlikely bear market turnaround. My SPY target remains 600 based on previous positive FOMC, CPI, Job Report Data, Rate Cuts, Elections, and Current Institutional development. On the technical side, the higher high movement began at the start of 2023 my initial target was 480 and I was correct! after the September weekly retracement on SPY, we have been pushing higher despite January's negative economic data and the conflict with IRAN. The daily is set to move currently above the 20MA with the weekly bullish and the monthly extremely bullish. IMPORTANT WEEK AHEAD! the future data will determine if the bullish trend will progress onward FOMC meeting will either scare people out of the market or drive the market into a rally along with central bank stocks. My bet is bullish even though inflation is record high thanks to the Biden administration we somehow keep pushing higher makes you wonder if the positive economic data is even accurate is employment being at a record high is that a good thing? Many Americans find them selfs more with two jobs or even three jobs is that a positive thing? Underemployment is also at record highs are these post-college graduates getting the salary they deserve or are they settling with two low-wage jobs? Nonetheless, the bull market will rain on with a summer rally. I will keep watching in case something turns around the enemy isn't Jerome Powell it's the liars at the white house and the propaganda creators over at MSNBC.
Note: This goes for Bitcoin as well! 80K here we go!
Play I am looking at.Golden cross starting to line up on VVIX on the 10 and 15min. If VIX spikes we could fill the Gap on SPY making it a perfect set up as it will also lign it up for a rebound off the 200MA. Depending on what the level 2 says at that time ill be loading 640 calls and 643Calls. I'll take a speculative guess that it SPY will open with short formed W pattern off that MA.
$UVXY Signaling Trouble — $SPY Could Drop 10%+ In this video, I discuss why August/September could bring serious downside for the market, despite my long-term bullish stance.
Right now, SPY is trading around $632, but I have a downside target of $573 in the short term. If we get volume beneath $573 — especially a break below the daily EMA — SPY could drop quickly, with a potential fall all the way to $480 in the coming weeks/months.
At the same time, UVXY is signaling a correction for the overall market after rallying from the low's of April. I have a target of $30 and when UVXY starts to move, it often reflects sharp market corrections — and the setup is beginning to mirror that now.
Despite this short-term bearish outlook, I want to make it clear: I am very bullish long term. Any 10–20% correction will be a major buying opportunity for me. I'm watching key levels closely and preparing to take advantage when the market overreacts.

Nightly $SPY / $SPX Scenarios for July 30, 2025🔮 Nightly AMEX:SPY / SP:SPX Scenarios for July 30, 2025 🔮
🌍 Market‑Moving News 🌍
🧭 Fed Holds Steady Amid Uncertainty
As the FOMC enters its July 29–30 meeting, the Fed is expected to keep rates unchanged at 4.25%–4.50%, even as one or two governors may dissent in favor of rate cuts amid mixed economic data. Recent strength in consumer spending contrasts with weakness in housing and construction.
🌐 U.S.–China Trade Talks Resumed in Stockholm
Talks are under way aimed at extending the tariff truce before the August 12 deadline. Both sides described progress as constructive, though analysts remain cautious on the timeline and potential outcomes.
🛢️ Oil Up / Dollar Firmer, But Risks Remain
Brent crude hit ~$72.50/barrel (+3.5%) while WTI rose to ~$69.20 on a mix of geopolitical tension (possible new Russia tariffs) and trade optimism. The U.S. dollar edged higher following the U.S.–EU trade agreement.
📈 IMF Revises Up Global Growth—but Flags Tariff Risks
The IMF raised its 2025 growth forecast to 3.0% and maintained 3.1% for 2026, citing pre-emptive consumer demand—but warned that ongoing U.S. tariffs and policy inconsistency could dampen momentum.
📊 Key Data Releases & Events 📊
📅 Wednesday, July 30:
FOMC Rate Decision & Powell Press Conference
The Fed is expected to hold interest rates steady. Powell’s remarks will be closely watched for signals on the timing of future cuts and views on inflation and labor markets.
Advance Q2 U.S. GDP Estimate
The first look at Q2 growth is expected around +1.9% YoY, potentially validating a rebound after Q1’s contraction.
June PCE & Core PCE (Personal Consumption Expenditures Index)
The Fed's preferred inflation gauge. Markets will monitor if core inflation remains elevated, which may reinforce policy caution.
⚠️ Disclaimer:
This summary is for educational and informational purposes only—it is not financial advice. Always consult a licensed financial advisor before making investment decisions.
📌 #trading #stockmarket #economy #Fed #GDP #inflation #trade #tariffs #markets

$SPY – FOMC Risk Window: AI Predicts Downside Drift📅 Forecast Window: July 30 – August 30, 2025
📡 Powered by VolanX Protocol v3.0 | WaverVanir DSS
🏛️ MACRO SETUP – JULY 31 FOMC:
🏦 Fed Funds Rate: 5.50% (expected hold)
🧊 Inflation: Cooling but sticky (CPI ~3.2%, PCE ~2.6%)
💼 Labor Market: Slowing but not collapsing
📈 CME FedWatch: 91% odds of no hike, but tone may be hawkish
🧠 Key Risk: Liquidity compression or prolonged pause = risk-off conditions
🧠 VOLANX PROTOCOL FORECAST (30-Day):
🔸 Current Price: $636.29
🔹 AI Target: $627.46 (−1.4%)
🟠 Signal: HOLD
🧮 Direction Accuracy: 85.5%
⚠️ Model Confidence: −2.049 (bearish drift)
📊 Volatility Forecast: Low (~1.36%) = slow bleed conditions
📉 WAVERVANIR DSS SIGNAL:
🔸 Sentiment Score: 78
🔻 15D Forecast: $630.49 (−0.8%)
🔻 30D Forecast: $616.68 (−2.9%)
📉 Bias: Mild Bearish
🛑 Signal: Hedge exposure, reduce risk, do not chase longs
🔥 OPTIONS FLOW SNAPSHOT:
🚨 $1.53M Call Sweep (645C, Aug 8) = Speculative breakout bet
📉 Multiple Put Sweeps (633–634P, Aug 4) = Institutional hedging
🟢 Mid-dated 638C/645C flows (Aug 15–22) show straddle-the-news positioning
📐 TECHNICAL ZONES TO WATCH:
📉 Support Levels:
$627 = Fib + VolanX AI Target
$616 = DSS Forecast + liquidity pivot
📈 Resistance Levels:
$639 → Gap close
$645 → Major breakout trigger (options magnet)
🕯️ Structure: Distribution bias → No clear momentum unless Fed surprises dovish
🎯 STRATEGIC OUTLOOK:
Scenario Probability SPY Reaction
🟡 Hawkish Hold 65% Pullback toward $627
⚪ Neutral Hold 25% Choppy → $639 max
🟢 Dovish Surprise 10% Spike to $645+
📌 VolanX Protocol Guidance:
"This is a defense window. AI models and options flow both suggest uncertainty, not conviction. Trim longs, hedge risk, and wait for post-FOMC confirmation."
#SPY #VolanX #WaverVanir #FOMC #MacroForecast #OptionsFlow #DSS #SMC #LiquidityTraps #SmartMoney #TradingSignals #AITrading #FederalReserve #TechEarnings #RiskWindow #HawkishFed #FedHold #MacroAI
SPY at the Edge of Breakdown or Bounce? Jul 30SPY at the Edge of Breakdown or Bounce? Watch These Gamma & Structure Levels Closely 🔥
🔹 GEX Insights for Options Trading (1H GEX Chart):
SPY currently sits at $635.43, hovering just above the highest negative GEX level at $635, which often acts as short-term PUT support or a reversal trigger when price reaches exhaustion.
The most concentrated CALL gamma cluster sits between $637 and $640, with the strongest resistance at $638 (50.47% GEX level) and $639 (2nd CALL Wall). These levels could magnetize price in a squeeze but also act as rejection zones if not broken with force.
Below, strong PUT gamma walls are stacked at:
* $633 (2nd PUT wall, -38.69%)
* $632 (3rd PUT wall, -30.49%)
* $630 (GEX10 level, -14.66%)
These act as liquidity targets for downside expansion if bears push through.
Options Oscillator:
* PUTS dominant at 66.1%
* IVR: 13.6 (low, potential for future expansion)
* GEX: Green, indicating slight bullish gamma tilt short-term
→ Watch for volatility expansion if this support zone fails.
📌 Gamma Summary:
* As long as SPY holds above $635, a bounce toward $638–640 remains on table.
* Below $635, a flush into $633–630 becomes the next logical destination.
* IV crush seems done—next move likely gets direction from a volatility expansion event.
🔹 1-Hour Intraday Technical Analysis (Price Action + SMC):
SPY shows clear structural weakness after the Break of Structure (BOS) to the downside followed by a Change of Character (ChOCH) confirming a shift to bearish order flow.
The most recent rally was capped at a supply zone (highlighted in purple) near $639–640, where we saw consistent selling and volume exhaustion.
Currently, price is:
* Resting on the ascending trendline from July 23rd
* Approaching a demand zone around $632–630, which aligns with GEX support zones.
What to watch:
* A clean reclaim above $636.94 (local BOS level) could open a path for bullish retest of $638.88.
* If SPY loses $634.50, we likely dive into the next demand zone at $630, then possibly $628.00 or even $626.19.
This structure sets up a binary setup:
* Either we bounce from here and reclaim $636+ or,
* We continue the breakdown toward lower liquidity zones.
🎯 Suggested Option Plays (based on TA + GEX):
Bullish Scenario:
* CALL entry: On break and hold above $637 with volume
* Target: $639.88 → $640
* Stop: Below $635.20
Bearish Scenario:
* PUT entry: If SPY rejects at $636.94 or fails $634
* Target: $632 → $630 → $628.00
* Stop: Above $637
Scalpers can play both sides using tight risk around the gamma pivot at $635.
Conclusion:
SPY is teetering at a high-confluence pivot zone where GEX support, structure demand, and trendline meet. Whichever side breaks first—above $637 or below $634—will likely dictate the next wave of directional momentum.
Stay reactive, not predictive. Use the GEX zones to frame your trade ideas and execute only on confirmation.
Disclaimer: This analysis is for educational purposes only and does not constitute financial advice. Always do your own research and manage your risk before trading.
SPY Will Collapse! SELL!
My dear subscribers,
This is my opinion on the SPY next move:
The instrument tests an important psychological level 637.01
Bias - Bearish
Technical Indicators: Supper Trend gives a precise Bearish signal, while Pivot Point HL predicts price changes and potential reversals in the market.
Target - 628.63
About Used Indicators:
On the subsequent day, trading above the pivot point is thought to indicate ongoing bullish sentiment, while trading below the pivot point indicates bearish sentiment.
Disclosure: I am part of Trade Nation's Influencer program and receive a monthly fee for using their TradingView charts in my analysis.
———————————
WISH YOU ALL LUCK
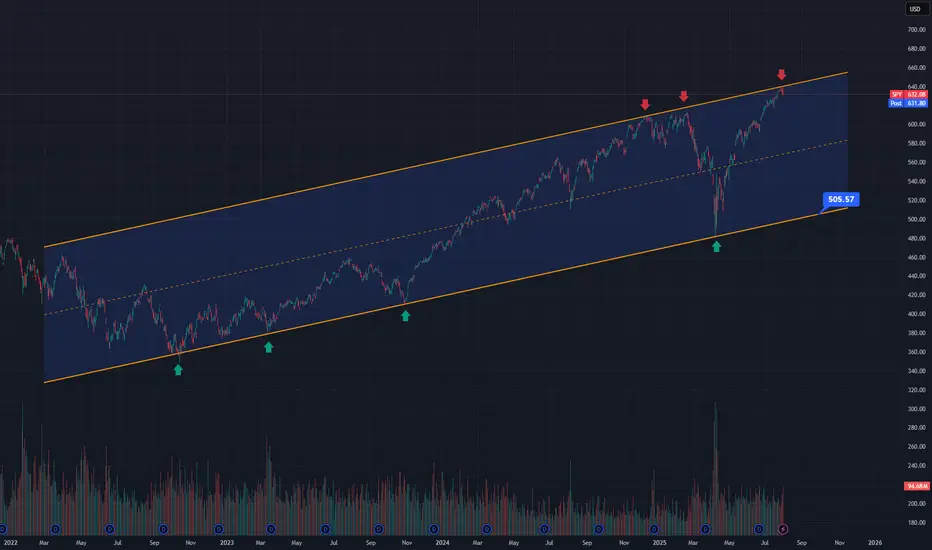
Next Leg down startingThe S&P 500 has been trading inside this rising channel for the last 3 and a half years. As you can see it has bounced off the bottom of the rising channel 4 different times and it is now back at the top of the channel. Price action gapped above the channel overnight but immediately sold off pre-market back inside the channel and completely reversed the move despite strong earnings from MSFT and META. This is very bearish and signals a move back down to the bottom of the channel once again and given that its already bounced off the bottom of the channel 4 different times, a 5th hit would have a high probability of breaking below the channel, which I would give a greater than 70% probability of playing out. If this happens, we will see much lower prices in this coming bear market.
SPY Weekly Chart: Rising Wedge Signals Imminent PullbackSPY Weekly Chart Overview (Current Price: ~637)
🧭 Context:
Indicators: TEMA (13/21/50) & RSI (14)
Price is extended, RSI near overbought (65.87), and forming a rising wedge — a bearish pattern.
🔻 Bearish Setup: Rising wedge signals possible reversal.
Momentum weakening despite higher highs.
Price extended above TEMA — a 600–610 pullback looks likely.
📊 Key Levels:Resistance: 672
Support: 611–600 → 578 → 488
Break below 600 could trigger broad downside.
🟢 Bullish Case:
Breakout above 672 with volume = momentum continuation (AI/FOMO driven).
🎯 Conclusion:
SPY is technically stretched. Risk/reward favors caution.
Watch for pullback to 600–610
THE STOCK MARKET IS BULLISH BUT NEEDS A SMALL CORRECTIONIn this video, we look at the weekly chart of the S&P 500 to determine if a correction is near and spoiler alert. Yes, it is. Here's what happens.

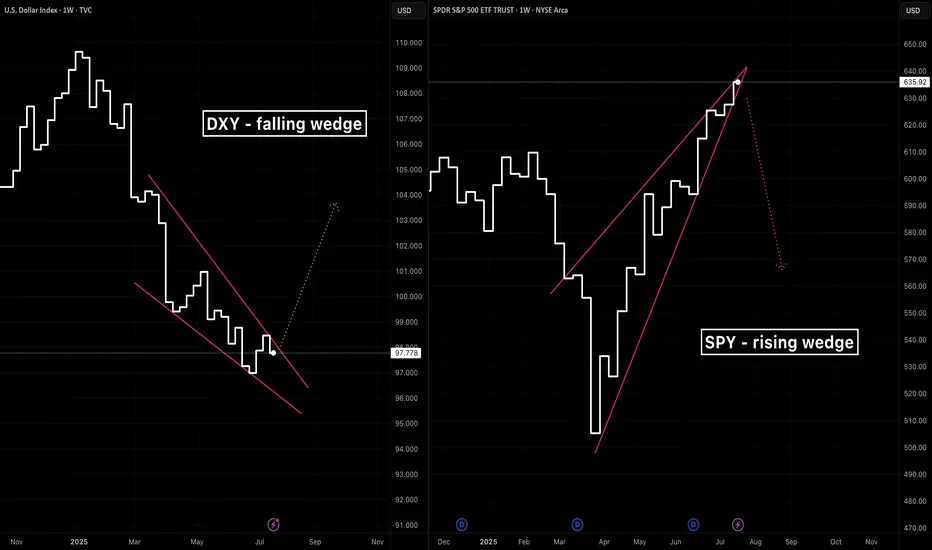
A tale of two wedgesIn early 2025 we’ve seen two classic wedge patterns on two of the market’s most watched charts: a falling wedge on the U.S. Dollar Index ( TVC:DXY ) and a rising wedge on the S&P 500 ETF ( AMEX:SPY ). Alone each tells its own tale—but together they sketch a tug‑of‑war between a fading dollar and resilient equities.
The Falling Wedge on DXY
A falling wedge in a downtrend signals waning bearish momentum and often precedes a bullish reversal once price breaks the upper trendline.
The Rising Wedge on SPY
A rising wedge in an uptrend is classically a bearish reversal pattern —a breakdown below the lower trendline confirms sellers are gaining control.
A Converging Reversal
Given the well‑known inverse correlation between the dollar and most assets, it’s noteworthy that both asset classes are flashing signs of a reversal. Taken together that makes a compelling argument.
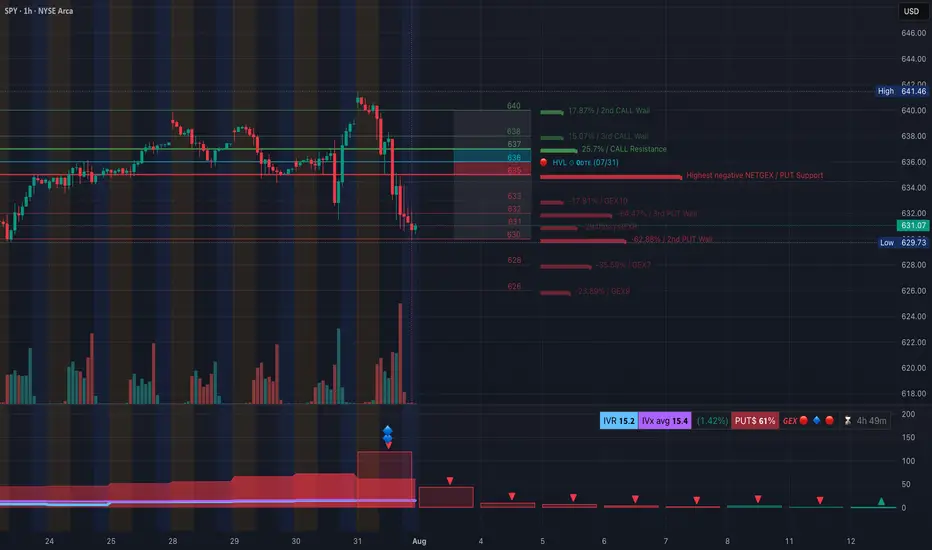
SPY Slips into Deep Negative Gamma — Aug. 1SPY Slips into Deep Negative Gamma — $629.73 Pivot Under Siege
🔍 GEX & Options Flow Insight (1st Image Analysis)
SPY has rolled over sharply from the $641 highs, slicing through multiple support zones and now probing the $629–$631 gamma pivot. The GEX structure is decisively negative, signaling elevated downside risk if this key level fails.
* Call Walls & Resistance:
* 📍 $636.39 → 1st resistance (Call resistance zone)
* 📍 $639.48–$640.28 → 2nd Call Wall cluster
* 📍 $641.46 → Highest call wall / gamma resistance
* Put Walls & Support Zones:
* 🛡️ $631.07 → Current key gamma pivot
* 🚨 $629.73 → Highest negative NET GEX / critical floor
* 📉 Break below $629 risks a flush to $626–$622
* Volatility Insight:
* IVR 15.2, IVx Avg 15.4 → Low realized volatility despite price slide
* Put flow 61% → Heavily bearish
* GEX sentiment: 🔴🔴🔴 = Strong negative gamma — market likely to see amplified moves in current direction
✅ Option Trading Suggestion:
Bias: Bearish unless reclaiming $636+
Strategy: Bear put spread or put fly
* Entry Idea: Buy 630P / Sell 625P (Aug 2 or Aug 9 expiry)
* Invalidation: Close above $636
* Target: $626 → $622
Why this works: SPY is pinned near a major negative gamma inflection. Below $629.73, dealer hedging could accelerate selling pressure toward $622.
🧠 Technical Analysis (1H Chart) (2nd Image Analysis)
Market Structure & SMC:
* 🟥 CHoCH confirmed after rejection at $641
* ❌ Broke short-term BOS levels in the $637–$636 zone
* Currently trading in a downward-sloping structure with multiple failed bounces
Trendline Dynamics:
* Clean descending channel from July 30 highs
* Lower bound projection points to $626–$622 support
SMC Zones:
* 🟩 Demand Zone: $629–$626 → Short-term bounce risk here
* 🟥 Supply Zone (Purple Box): $636–$639 → Heavy overhead resistance
🔄 Price Action & Key Levels
* Support:
* ✅ $631.07 → Current gamma pivot
* 🚨 $629.73 → Key breakdown trigger
* 📉 $626 → Lower demand
* 📉 $622 → Deeper downside target
* Resistance:
* 🚩 $636.39 → First reclaim level for relief
* 🚩 $639.48 → Mid supply
* 🚩 $641.46 → Full reversal point
🧭 Scalping / Intraday Trade Setup
🟥 Bearish Setup (Preferred):
* Entry: Breakdown under $629.73
* Target 1: $626
* Target 2: $622
* Stop: Above $632
🟩 Bullish Reversal Setup:
* Entry: Reclaim of $636.39 with strong volume
* Target 1: $639.48
* Target 2: $641.46
* Stop: Below $634
🔁 Summary Thoughts
* SPY is in a clean downtrend inside a negative gamma regime.
* $629.73 is the critical make-or-break line — holding it could trigger a small bounce, breaking it could unleash another wave of selling toward $622.
* Options flow is heavily bearish, aligning with technical weakness.
🚨 Disclaimer:
This analysis is for educational purposes only and does not constitute financial advice. Always do your own research and manage your risk accordingly.
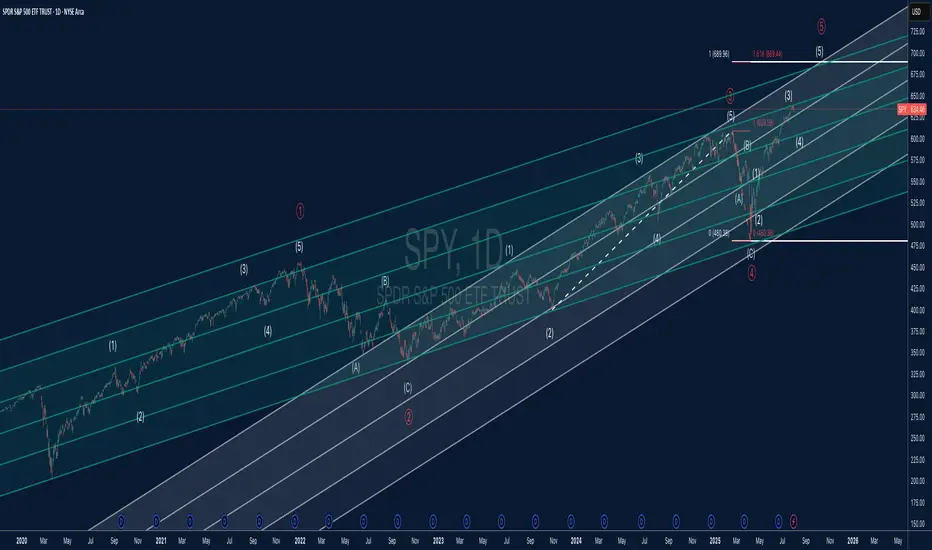
SPY Elliott Wave + Parallel Channel AnalysisThis chart offers a detailed Elliott Wave count for SPY (S&P 500 ETF) on the daily timeframe, combined with a structured parallel channel system to highlight key trend dynamics.
🔍 Elliott Wave Structure:
The price is currently advancing in what appears to be Wave (5) of Primary Wave ⑤, suggesting we may be in the late stages of a major impulsive cycle.
Each impulsive and corrective wave is clearly labeled, with the internal structure confirming classic Elliott Wave symmetry.
The 1.618 Fibonacci extension around $689 marks a critical upside target and potential completion zone for Wave (5).
Wave (4) held well at the lower channel boundary and completed near $480, establishing a solid base for the current advance.
📊 Channel Insights:
A system of parallel channels is applied to capture the overall trend and momentum structure.
Price is climbing toward the upper boundary of the long-term ascending channel, which has acted as dynamic resistance in previous waves.
The median lines have provided reliable support and resistance throughout the trend, making them important reference levels moving forward.
⚠️ Key Technical Levels:
Resistance: $689.44 (Wave ⑤ target at 1.618 Fib extension)
Support Zones: $609 (prior Wave (3) high), $575 (mid-channel support), and $480 (major cycle low)
A confirmed break above $690 could suggest a parabolic move, but risk of reversal grows as the upper channel is tested.
📈 Market Outlook:
SPY remains in a strong uptrend but is nearing a major confluence of wave and channel resistance.
A completed five-wave sequence would suggest the potential for a higher-degree correction, possibly leading into a Wave A/B/C scenario.
Short-term bullish bias remains valid while above $609, but watch for divergence or exhaustion signs near $689–$700.
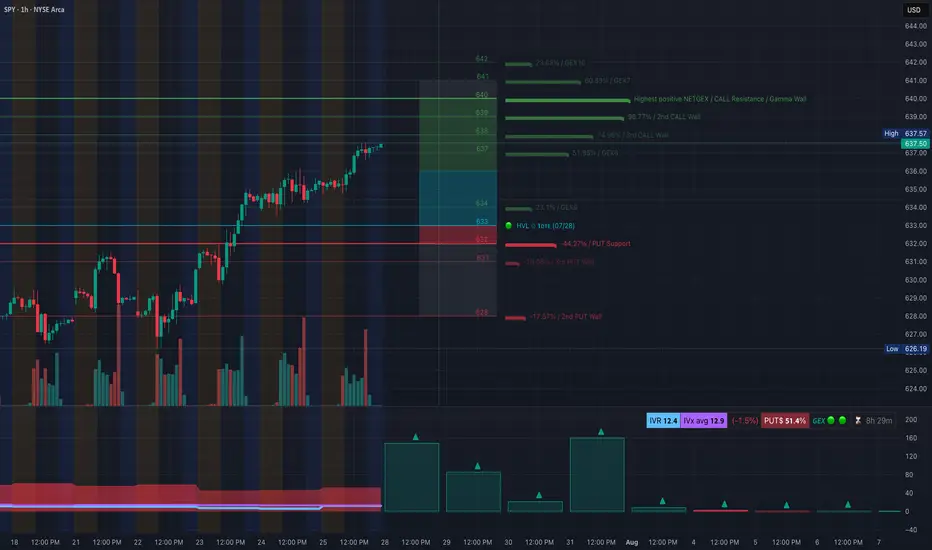
SPY at Decision Point! Gamma Walls vs. Rising Channel-Jul 28🧠 Technical Analysis (TA) – SPY Outlook
SPY is approaching a critical inflection zone near $638–$640, navigating through an ascending channel with compression in price action. This aligns with major Gamma Walls, offering both opportunity and risk. Here's the Monday breakdown using 1H, 15M, and GEX overlays:
🔍 Market Structure:
* 1H Chart shows a clean uptrend, forming a base around $637.50.
* 15M Chart reveals a consolidation zone after a Break of Structure (BOS), with a potential CHoCH below $636.65.
* Price is currently ranging inside a small supply zone and below an upper channel boundary.
🧲 GEX + Options Sentiment:
* GEX Extreme Gamma Resistance: $640–642 (strong CALL walls, potential reversal).
* PUT Wall Clusters: $634, $632, $628 (support zones on pullbacks).
* IVR: 12.4 – near low volatility.
* Put/Call $ Ratio: 51.4% Puts = Mild Bearish lean.
* NETGEX highest positive at $640 = Gamma magnet + potential resistance.
📌 Key Zones:
* Support: 636.15 → 634.42 → 633.00
* Resistance: 638.70 → 640.00 → 642.00
🟢 Bullish Scenario:
* If SPY reclaims 638.70 and breaks above channel top, watch for momentum toward 640–642, then reassess.
* 📥 Entry: 638.80+
* 🎯 Target: 640.40 → 641.80
* ⛔️ Stop: Below 636.65
🔴 Bearish Scenario:
* Failure to hold above 637.50 and break of CHoCH at 636.65 could invite pullback to 634.42 or even 632.90.
* 📥 Entry: Break & retest below 636.65
* 🎯 Target: 634.42 → 633.00
* ⛔️ Stop: Above 638.00
🔁 Scalping Levels (15M):
* Watch pink box consolidation zone (637.2–637.6) for breakout or rejection.
* Aggressive short scalp if early rejection from 638 near open.
🎯 Actionable Plan:
* Opening Above 638.70 = Lean CALLs, trail tight.
* Rejection at 638–638.5 = Look for PUTs back to 636.5/634.
* Clean break of 636.65 = Short bias opens for larger retrace.
* Gamma Squeeze possible only if > 640 holds and IV rises.
🧠 Thoughts:
SPY is coiling under macro resistance while IV remains low. Options market isn't leaning heavily bearish, but that could change if we slip below 636.65. Be mindful of the Gamma walls acting as magnets or reversion zones. This is a risk-defined week, so size down and react—not predict.
Disclaimer: This analysis is for educational purposes only and does not constitute financial advice. Always do your own research and trade with proper risk management.
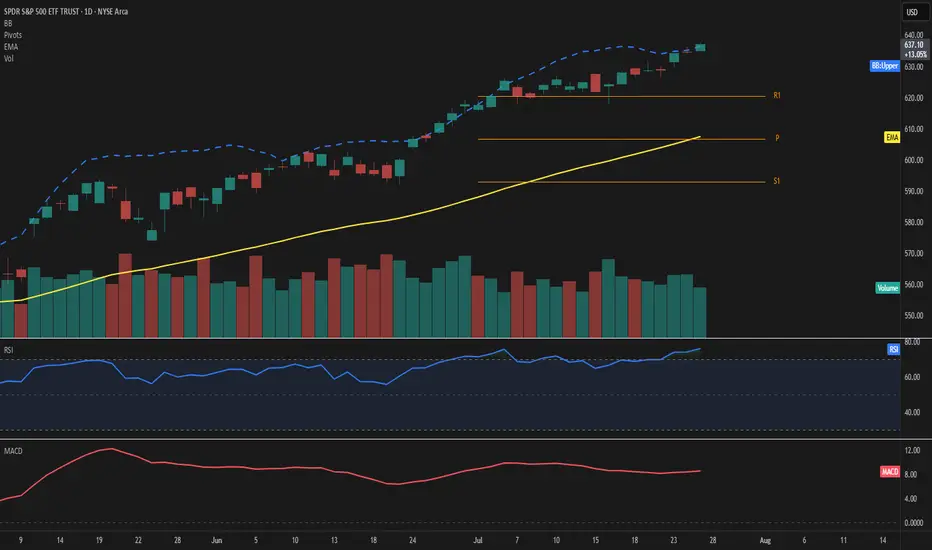
SPY – Explosive strength above resistancePrice extends well above the 50-day EMA and pierces through the upper Bollinger Band, highlighting strong bullish momentum. RSI stands at 76, confirming overbought conditions, while MACD remains firmly positive.
The ongoing move leaves the EMA50 at 608 and the Fibonacci pivot at 607—both now acting as key support levels. With R1 at 620 already surpassed, the next potential resistance zone lies in uncharted territory beyond 636.
Volume has decreased by over 20%, which tempers the move slightly and should be monitored closely.
As long as price holds above 620, the bullish scenario remains valid.
Watch for any sudden spike in volume or a drop back below 636 as a possible shift signal.