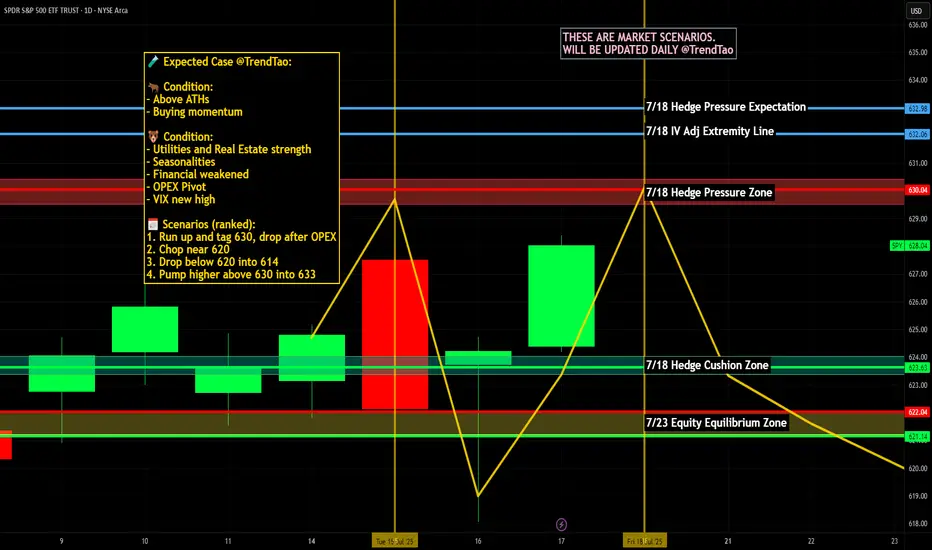
Nightly $SPY / $SPX Scenarios for July 19, 2025🔮 Nightly AMEX:SPY / SP:SPX Scenarios for July 19, 2025 🔮
🌍 Market-Moving News 🌍
🏢 U.S. Corp Buybacks Set to Propel Stocks
Citadel Securities expects U.S. companies to repurchase roughly $1 trillion of stock in 2025. With the blackout period ending in August, buybacks—historically strong in July, the stock market’s best month—could bolster valuations
⚖️ Fed Independence Debate Intensifies
President Trump’s continued criticism of Chair Powell has already weakened confidence in Federal Reserve autonomy. The fallout shows up in a weaker dollar, elevated Treasury yields, and rising inflation expectations—though stocks have remained resilient
🇺🇸 Immigration Rollback Sparks Economic Concern
The rescinding of Temporary Protected Status for ~900,000 immigrants could remove up to 1.1 million workers from the labor force. Analysts warn of potential stagflation risks, with GDP growth potentially down 0.3–0.4 percentage points and labor-market tightening ahead
💵 Massive T-Bill Issuance Incoming
Following the debt-ceiling deal, the Treasury plans over $1 trillion in T-bill issuance in the next 18 months. Money-market funds are expected to absorb much of it, influencing short-term rates and cash-market dynamics
📊 Key Data Releases & Events 📊
📅 Friday, July 19:
8:30 AM ET – Initial Jobless Claims
Weekly figure on new unemployment filings—a real-time indicator of labor-market resilience.
8:30 AM ET – Existing Home Sales (June)
Measures signed contracts on previously owned homes; key for gauging housing-market health.
All Day Events:
Ongoing corporate buybacks entering open window
Treasury auctions and T-bill issuance updates
⚠️ Disclaimer:
This information is for educational and informational purposes only and should not be construed as financial advice. Always consult a licensed financial advisor before making investment decisions.
📌 #trading #stockmarket #economy #monetarypolicy #debt #housing #labor #technicalanalysis
SPY trade ideas
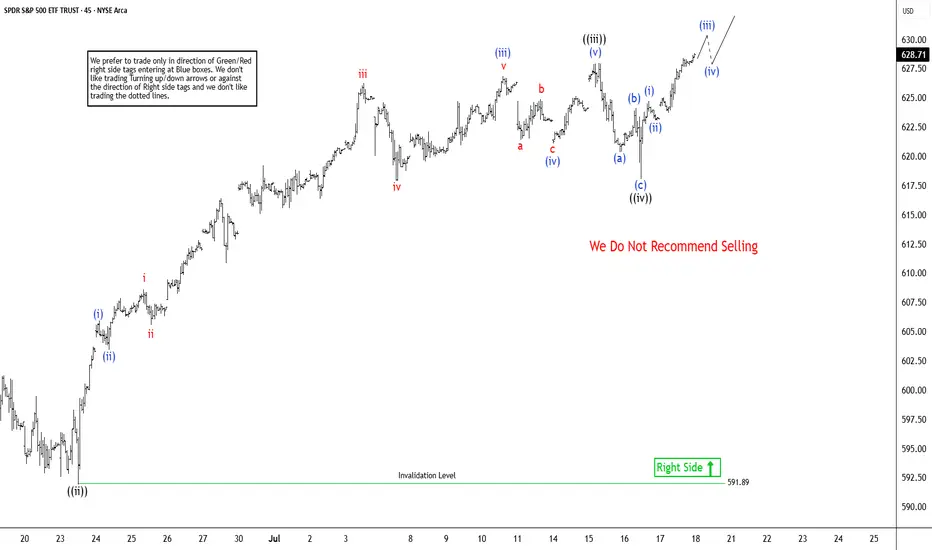
Elliott Wave Analysis: SPY Poised To Extend Higher In Bullish SeElliott Wave sequence in SPY (S&P 500 ETF) suggest bullish sequence in progress started from 4.07.2025 low. It expects two or few more highs to extend the impulse sequence from April-2025, while dips remain above 6.23.2025 low. SPY ended the daily corrective pullback in 3 swings at 480 low on 4.07.2025 low from February-2025 peak. Above there, it favors upside in bullish impulse sequence as broke above February-2025 high. Currently, it favors wave 3 of (1) & expect one more push higher from 7.16.2025 low in to 630.31 – 651.1 area before correcting in wave 4. In 4-hour, it placed 1 at 596.05 high, 2 at 573.26 low as shallow connector & extend higher in 3. Within 3, it placed ((i)) at 606.40 high, ((ii)) at 591.89 low, ((iii)) at 627.97 high & ((iv)) at 618.05 low.
In 1-hour above ((ii)) low of 591.89 low, it ended (i) at 605.96 high, (ii) at 603.17 low, (iii) at 626.87 high as extended move, (iv) at 620 low & (v) as ((iii)) at 627.97 high. Wave ((iv)) ended in 3 swing pullback as shallow connector slightly below 0.236 Fibonacci retracement of ((iii)). Within ((iii)), it ended (a) at 619.8 low, (b) at 624.12 high & (c) at 618.05 low on 7.16.2025 low (this week). Above there, it favors rally in ((v)) of 3 targeting in to 630.31 – 651.1 area before correcting in 4. Within ((v)), it placed (i) at 624.73 high, (ii) at 623.08 low & favors upside in (iii) of ((v)). We like to buy the pullback in clear 3, 7 or 11 swings correction at extreme area in 4 and later in (2) pullback, once finished (1) in 5 swings.
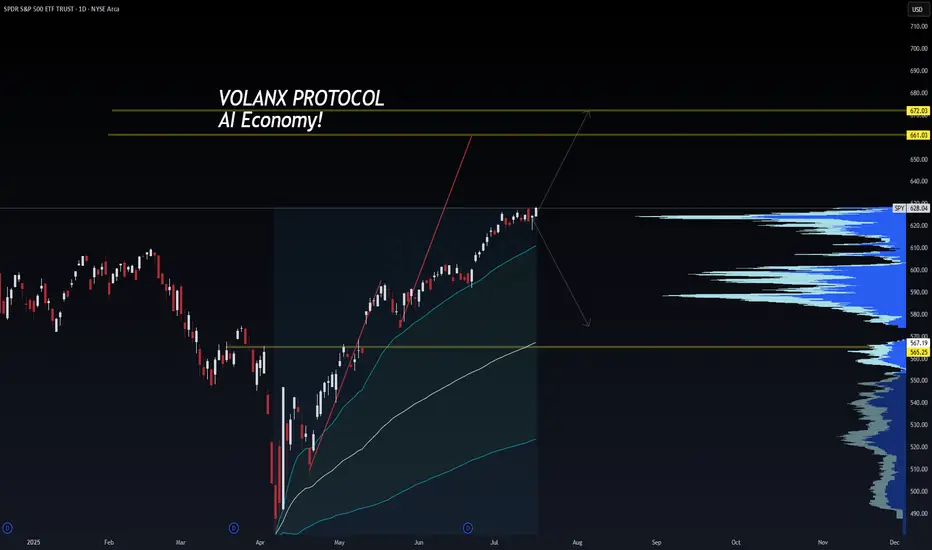
SPY 628 – Compression Before Expansion | VolanX Protocol Engaged🧠 SPY 628 – Compression Before Expansion | VolanX Protocol Engaged
📅 July 17, 2025
🔍 SPY (S&P 500 ETF Trust) | 1D Chart
📍 Current Price: 628.04
📈 Chart Thesis by: WaverVanir International LLC
🔗 Powered by VolanX Protocol
🌐 Macro Overview:
The market stands at a critical inflection point, with bulls and bears both pressing their narrative:
The Fed is expected to cut rates in September, with soft CPI and decelerating labor trends justifying a pivot.
Earnings season is bifurcated: Mega-cap tech is leading, while cyclicals are faltering. This raises the risk of a short-term rally masking deeper fragility.
Global macro risks – including rising geopolitical stress in the Asia-Pacific region and commodity volatility – increase the odds of a tail event.
📊 Technical Outlook:
SPY is now hugging a major supply zone near 628 with price stalling for multiple sessions. This area marks a compressed equilibrium where volatility is likely to expand soon. Key technicals:
Rejection candles suggest seller presence near 630.
Price is overextended but remains above all major EMAs.
Breakdown zone sits at 565, which aligns with prior resistance and a major volume shelf.
No current bearish divergence on RSI or MACD, but momentum is flat.
🎯 VolanX Probabilistic Bias:
The system currently anticipates three paths:
Bullish breakout toward 660–675 if the Fed confirms a dovish stance and tech continues to lead.
Neutral grind in the 600–615 zone if macro remains balanced and earnings don’t surprise.
Bearish breakdown to 565 or lower if macro stress emerges or dollar strength accelerates.
🛠️ Options Strategy Highlights:
Bullish Trade Idea: Buy 630C / Sell 660C (30–45 DTE) – Low cost, targets breakout above resistance.
Bearish Trade Idea: Buy 620P / Sell 565P – High R/R play into macro unwind.
Both are defined-risk strategies, ideal in volatile inflection zones like this.
⚠️ VolanX Note:
This is a classic binary event structure forming under institutional watch. DSS scans show compression is now mature. Whichever side confirms will likely trigger a large move, not a drift.
Let the narrative confirm the signal.
⚠️ This post is for informational and educational use only. Not financial advice.
#SPY #VolanX #MacroTrading #OptionsFlow #WaverVanir #FOMC #AIeconomy #LiquidityWave #TradingSignals
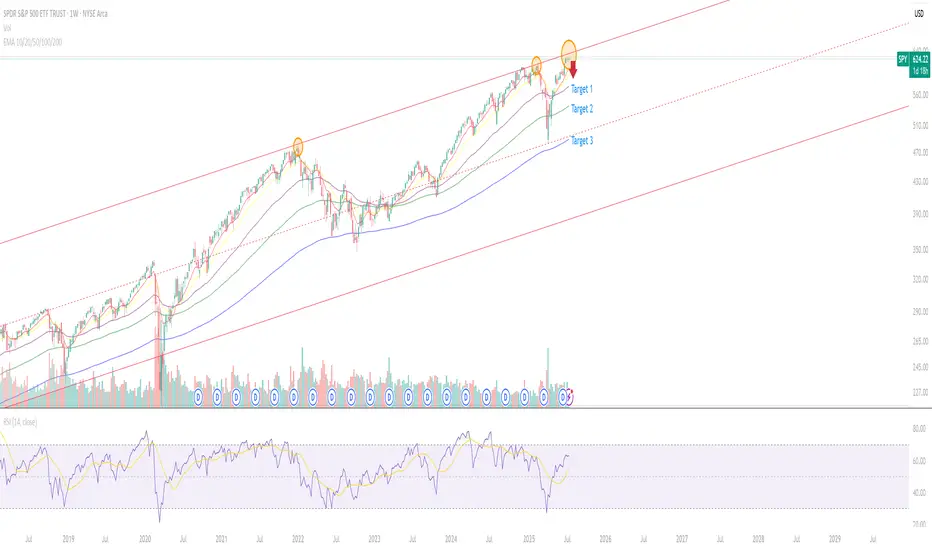
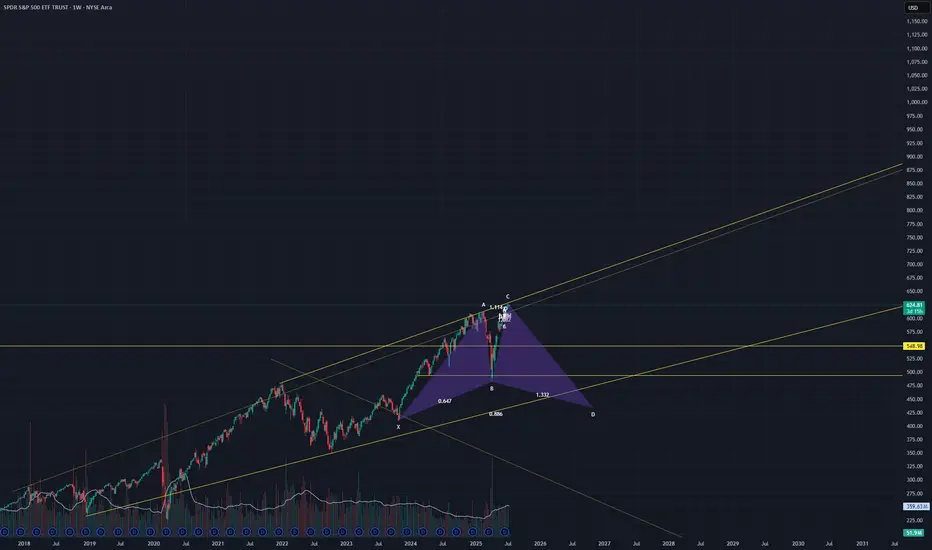
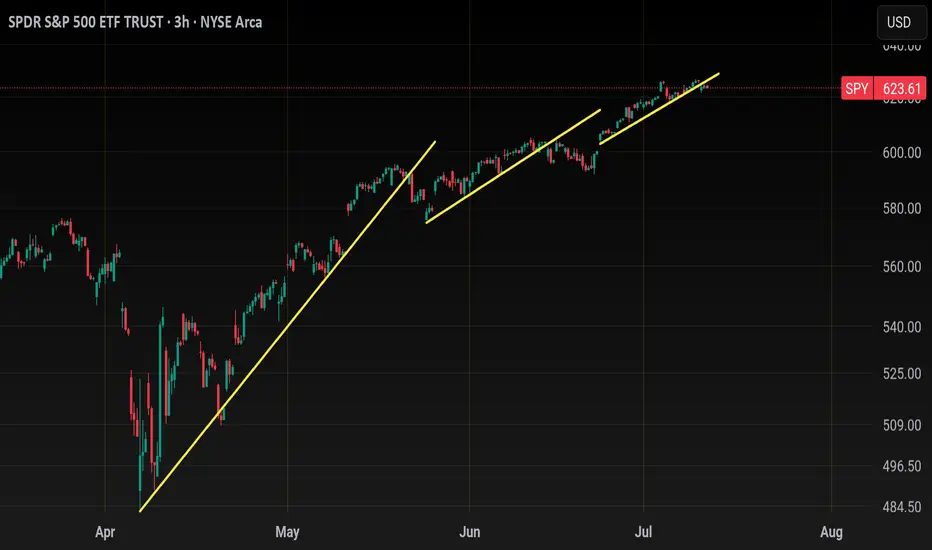
Climbed too fast to the top of the channel?Weekly chart on log - looks like its already topped out and will likely hit one of those targets in the coming weeks. Maybe a test or slight break above channel before going down.
Nightly $SPY / $SPX Scenarios for July 17, 2025🔮 Nightly AMEX:SPY / SP:SPX Scenarios for July 17, 2025 🔮
🌍 Market-Moving News 🌍
🇮🇳 India–U.S. Inflation Divergence Dampens Dollar
India’s June retail inflation tumbled to a six-year low, while U.S. CPI hit its fastest pace since February—driven by tariff effects. This divergence is weakening the U.S. dollar against the rupee, pushing down dollar‑rupee forward premiums
📜 Treasury to Ramp Up T-Bill Issuance
Following the recent debt-ceiling increase, the U.S. Treasury plans to issue over $1 trillion in T-bills over the next 18 months. Money-market funds, flush with cash, are expected to absorb the supply, which could influence short-dated yields
💱 Dollar Eases Amid Fed-Related Volatility
Headline news that President Trump “highly unlikely” to fire Fed Chair Powell, coupled with stable PPI data, calmed markets. The dollar dipped slightly after earlier turmoil, while gold and bonds saw modest gains
📊 Key Data Releases & Events 📊
📅 Thursday, July 17:
(No major U.S. economic releases)
Markets will track T-bill issuance plans, dollar forward dynamics, and statements from the Treasury and Fed regarding debt and rate strategy.
⚠️ Disclaimer:
This is for educational purposes only—not financial advice. Consult a licensed financial advisor before making investment decisions.
📌 #trading #stockmarket #economy #dollar #tbills #inflation #Fed #technicalanalysis
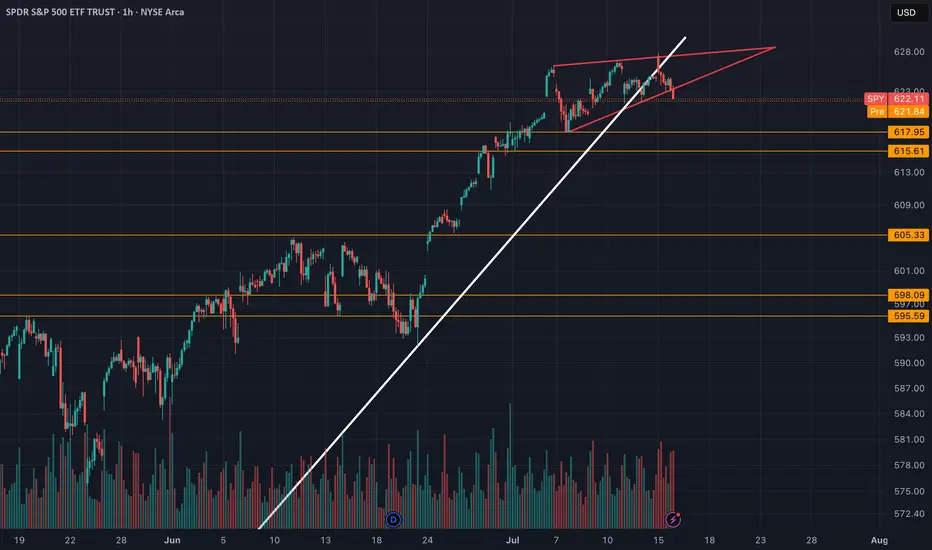
SPY (SP-500) - Rising WedgeYesterday we had a breakdown of the rising wedge on SPY. I draw out some important levels to look out for coming days/weeks. The trendline since april has also been broken. ICEUS:DXY is breaking out to which is increasing the risks for a "Risk off" scenario in tech stocks and crypto.
Nothing here should be interpreted as financial advise. Always do your own research and decisions.
SPY PRICE ACTION 16 JULY 2025This is the price action of spy at its very best as always. I have clearly discussed the important levels & have also discussed the momentum as well.
Feel free to leave your comment
NOTE:I AM NOT TRADING SPY

SPY/QQQ Plan Your Trade Special Update : BUCKLE UPThis video is a special update for all TradingView members. I felt I needed to share this information and present the case that I believe poses the most significant risk to your financial future - and it's happening right now.
Several weeks ago, I identified a very unique mirror setup in the SPY and kept an eye on how it was playing out. I needed to see confirmation of this setup before I could say it had any real likelihood of playing out as I expected.
As of today, I'm suggesting that we now have excellent confirmation that the US/Global markets are about to enter a deep consolidation phase, lasting through the rest of 2025 and possibly into 2026 and early 2027.
The interesting thing about this price pattern/structure is that it is almost exactly the same as the 2003-2007 structure, which I believe is the origin of this mirror setup. Almost down to the exact type of price bars/patterns I'm seeing.
Many of you are already aware that I've been calling for a critical low cycle in the SPY on July 18 for many months. What you may not realize is that the pattern is based on Weekly price data. The July 18 cycle low can have a span of +/- 1-3 weeks related to when and how the cycle low pattern plays out.
Watch this video. If you have any questions, message me or comment.
I'm still here, doing my best to identify and unlock the secrets of price action and to help as many traders as I can.
Price is the Ultimate Indicator.
Get some.
#trading #research #investing #tradingalgos #tradingsignals #cycles #fibonacci #elliotwave #modelingsystems #stocks #bitcoin #btcusd #cryptos #spy #gold #nq #investing #trading #spytrading #spymarket #tradingmarket #stockmarket #silver

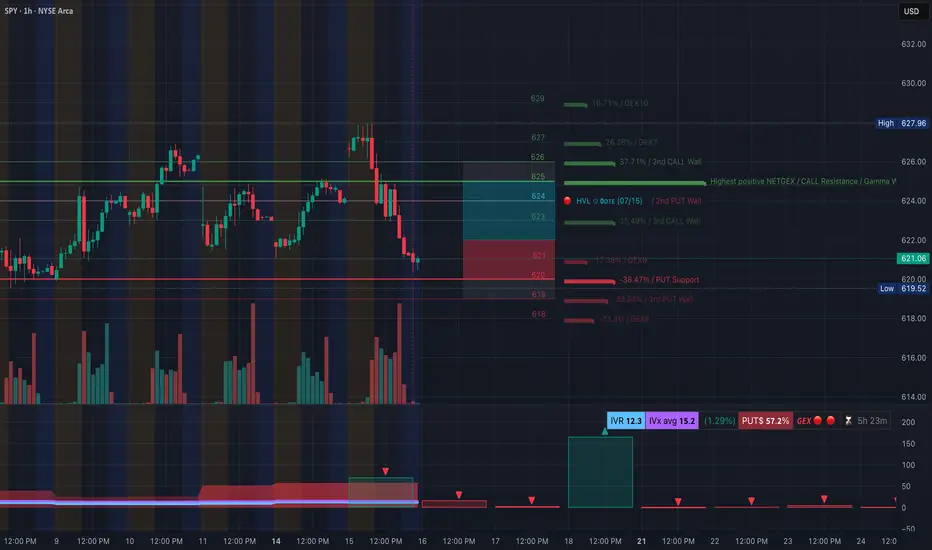
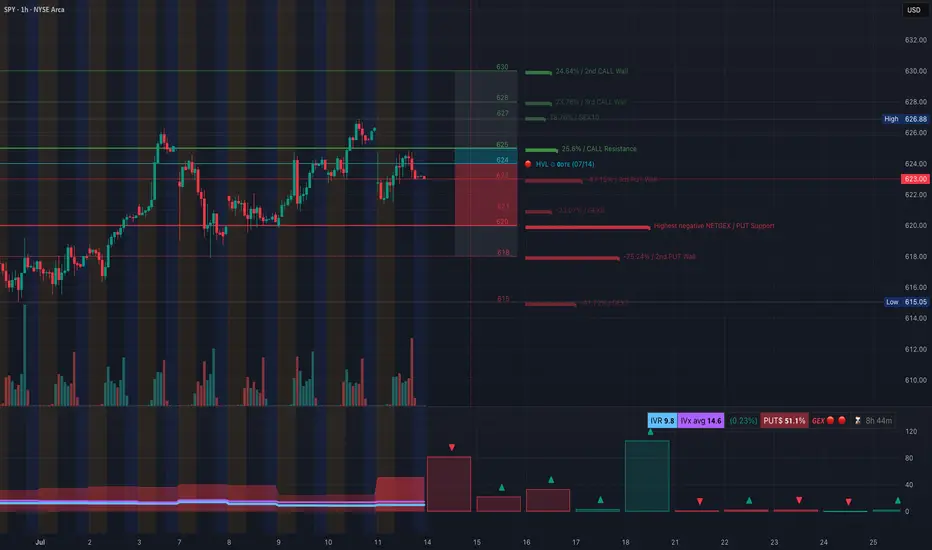
SPY at Key Support! Will It Hold or Break? TA for July 16🧨 GEX-Based Options Outlook:
* GEX Sentiment: Negative gamma dominates (🟥 GEX 🔻), indicating elevated dealer hedging risk.
* Put Wall & Support:
* Major PUT Wall at 620 (⚠️ -38.47%) is being tested.
* Additional downside liquidity lies below 618.
* Call Resistance:
* Upside resistance around 625–627, where both the 2nd CALL Wall and GEX7/8 sit.
* IV/Flow Summary:
* IVR 12.3 (low), PUTs 57.2% – bearish skew.
* Option flow is protecting downside → less confidence in upside follow-through unless we reclaim 624.5+.
* Conclusion: SPY is pinned around major support. A breakdown under 620 could accelerate downside into 616/614 range.
📉 1H Price Action & Trade Setup:
* SPY formed a CHoCH breakdown and is retesting the wedge base.
* Strong rejection from the 624.81–627.96 supply zone.
* Price is now hugging trendline support and could trigger a bounce or further breakdown depending on liquidity sweep.
Bullish Scenario:
* ✅ Entry: Above 621.50 reclaim with confirmation.
* 🎯 Targets: 624.50 → 626.80.
* ⛔ Stop: 620 or below trendline.
* ⚠️ Note: Only valid if SPY holds the CHoCH base and sweeps under 620 to trap bears.
Bearish Scenario:
* ❌ Entry: Clean break below 620, especially if it fails a retest.
* 🎯 Targets: 618 → 615.50 → 612.
* ⛔ Stop: Back above 622 with volume.
🎯 My Thoughts & Recommendation:
SPY is balancing on a major PUT wall and SMC support trendline. If 620 fails, the path of least resistance is down toward 615 and potentially 612 due to the lack of supportive gamma levels below. A relief bounce is possible only if dealers regain control above 624. Keep stops tight, as this zone could snap quickly.
This analysis is for educational purposes only and does not constitute financial advice. Always do your own research and manage your risk before trading.
Nightly $SPY / $SPX Scenarios for July 16, 2025 🔮 Nightly AMEX:SPY / SP:SPX Scenarios for July 16, 2025 🔮
🌍 Market-Moving News 🌍
📈 Record Bullish Sentiment Signals Rotation
Bank of America reports the most bullish fund-manager sentiment since February. With 81% expecting one or two Fed rate cuts this year, the group sees a rotation strategy replacing outright selling, with investors tipping toward sector shifts over wholesale exits
⚠️ Trump’s Fed Attacks Stir Policy Concerns
President Trump’s public criticism of Fed Chair Powell—calling for steep rate cuts and threatening removal—has raised market alarms over the central bank’s independence. Analysts warn such interference could destabilize confidence in U.S. monetary policy
🏦 Banks Prepare for Earnings Surge
Major U.S. banks are expected to report strong Q2 results this week. Enhanced trading and investment banking revenues are forecasted to offset economic uncertainties tied to tariffs
📡 Nvidia CEO to Visit Beijing
Jensen Huang is set to hold a high-profile media briefing in Beijing on July 16, signaling continued emphasis on China for Nvidia despite U.S. export restrictions—potentially a key narrative for tech markets
📊 Key Data Releases & Events 📊
📅 Wednesday, July 16:
8:30 AM ET – Producer Price Index (June)
Gauges wholesale inflation pressures; June expected +0.2% MoM vs May’s +0.1%
9:15 AM ET – Industrial Production & Capacity Utilization (June)
Monitors factory and utilities output and usage rates—key for industrial-sector health
Jensen Huang in Beijing
Nvidia CEO to lead media briefing in Beijing—a potential market mover for chipmaking and AI sectors
⚠️ Disclaimer:
This info is for educational purposes only—not financial advice. Consult a licensed professional before making investment decisions.
📌 #trading #stockmarket #inflation #Fed #tech #industrial #PPI
Potential Reversal - signs to look forSPY likely reaches 615 this week, if it gets under it will be a change of character. Gold still choppy, nothing decided just yet. Oil also undecided. Nat Gas may pullback from it's breakout. BTC looks like it may have at least a good pullback.

SPY is about to dumpThere isn't much to say. Chart speaks for itself. Possible shark farming if we hit resistance at this trendline that was resistance since 2022. Not shown but its also at the 707 extension of the October '24 and April '25 low.
$SPY Trading Range for 7.15.25 and everything in it for CPI
Tomorrow’s Trading range and everything in it. How are you playing it?
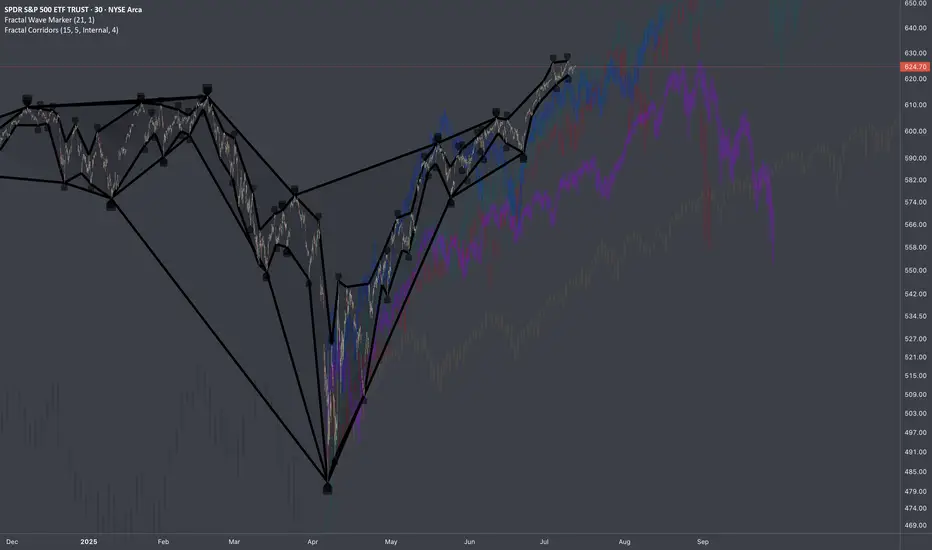
$SPY: Composite Sub-Cycles (Recursive)Research Notes Documenting Commonality
I’ve identified several bar patterns that formed following significant historical declines. They share notable similarities, as if suggesting that the magnitude of past major moves sets the structure of subsequent groups of sub-cycles (which I call "building blocks" sometimes).
I placed them in respect to current scaling laws so the method of exclusion can be applied in order to familiarize with typical "terrain" of price dynamics at such phase. Documenting them because a direct study is the most effective approach to uncovering the essence of recursive patterns.
Some of the bar patterns are lowered to highlight temporal aspect which matters more than price scale.
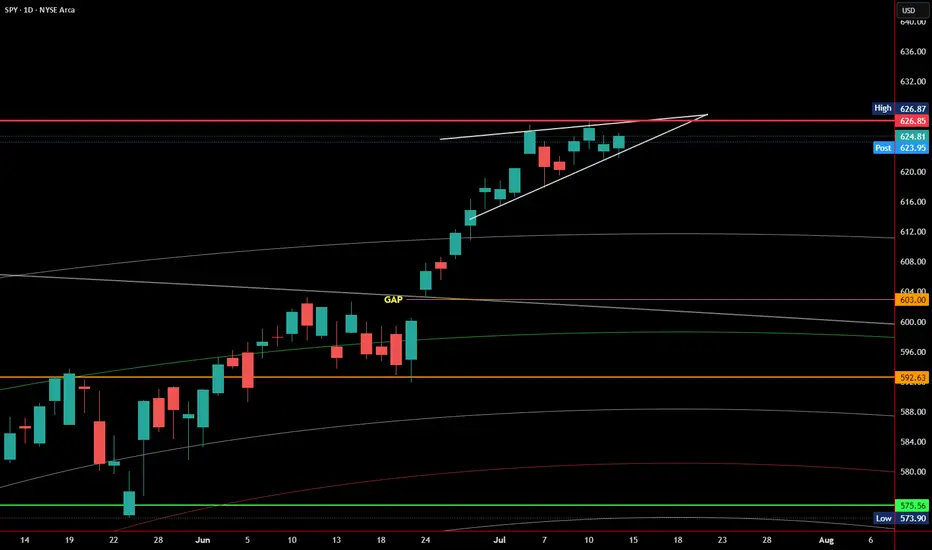
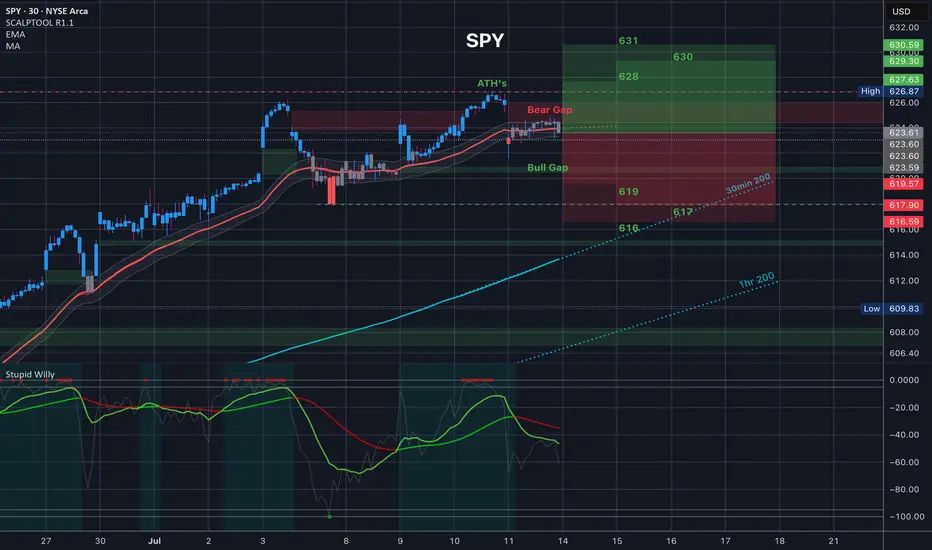
SPY Daily Chart – Rising Wedge at Resistance, RSI Near OverboughSPY continues to push higher, but today's candle reinforces a cautious tone as we approach a key inflection point.
The chart is currently forming a rising wedge pattern — historically a bearish structure that often precedes downside breaks, especially when forming after a strong upside move. Price is hugging the upper boundary of the wedge, with multiple failed breakout attempts near 626.87, which is acting as strong resistance.
The RSI sits at 68.59, just below the 70 overbought threshold. While this confirms strong bullish momentum, it also signals that the move may be getting stretched. A rejection here or a lower high on RSI while price continues higher could form a bearish divergence, a classic early reversal signal.
Volume remains moderate (~51.85M), and the candles have tightened — suggesting indecision. The rising wedge’s lower trendline and the short-term moving average (likely the 8 or 10 EMA) are immediate support. A break below these levels would shift the bias more clearly to the downside.
Key levels to watch:
Resistance: 626.87 (wedge top)
Support: rising wedge lower boundary and EMA (around 620–622)
RSI: break below 65 or a confirmed divergence would increase bearish risk
If the wedge breaks down with a drop in RSI and a flip in momentum indicators (such as Parabolic SAR), it may open the door for a pullback toward previous support zones near 603 or even 592.63.
No confirmation yet, but the risk-reward here starts to shift away from chasing longs. Caution is warranted.
Nightly $SPY / $SPX Scenarios for July 15, 2025🔮 Nightly AMEX:SPY / SP:SPX Scenarios for July 15, 2025 🔮
🌍 Market-Moving News 🌍
📦 Dow Futures Dip on New Tariff Announcements
President Trump announced new 30% tariffs on EU and Mexico, with additional duties on Japan, South Korea, Malaysia, Kazakhstan, South Africa, Laos, and Myanmar starting August 1. Dow, S&P, and Nasdaq futures each slipped ~0.3% as markets assess inflation risk ahead of key CPI data this week
📈 Tech & AI Stocks Lead Despite Tariffs
Stocks like Circle (+9.3%), CoreWeave (+5.2%), Palantir (+5%), Roblox (+5.8%), and Shopify (+4.1%) surged, showcasing sector resilience amid broader tariff fears
⚠️ Deutsche Bank Warns of Summer Volatility
With thin market liquidity and rising geopolitical tension (tariff deadline Aug 1), Deutsche Bank flags summer as a period prone to sudden corrections
📊 Key Data Releases & Events 📊
📅 Tuesday, July 15:
8:30 AM ET – CPI (June)
Core CPI is projected at +0.3% MoM (2.7% YoY) and headline CPI +0.3% MoM—signs tariff effects may be feeding into prices
8:30 AM ET – Core CPI (June)
Expected to come in around 3.0% YoY.
8:30 AM ET – Empire State Manufacturing Survey (July)
Forecast: –7.8 (less negative than June’s –16.0) — a modest sign of stabilizing factory conditions
Fed Speakers Throughout the Day
Watch for commentary from Fed officials (Michael Barr, Barkin, Collins, Logan) for fresh insights on inflation and monetary policy
⚠️ Market Interpretation:
Inflation Watch: A hotter-than-expected CPI could delay anticipated rate cuts and lift yields. A pick-up in core CPI above 3% would be a red flag.
Growth Signals: A less-negative Empire State reading may suggest improving industrial momentum but still signals contraction.
Political Risk: Tariff escalation could shift investor appetite, even if markets right now are focusing on broader macro narratives.
Volatility Setup: The combination of thin liquidity, tariff uncertainty, and critical data makes for a potentially choppy week.
📌 #trading #stockmarket #economy #inflation #tariffs #Fed #CPI #manufacturing #technicalanalysis
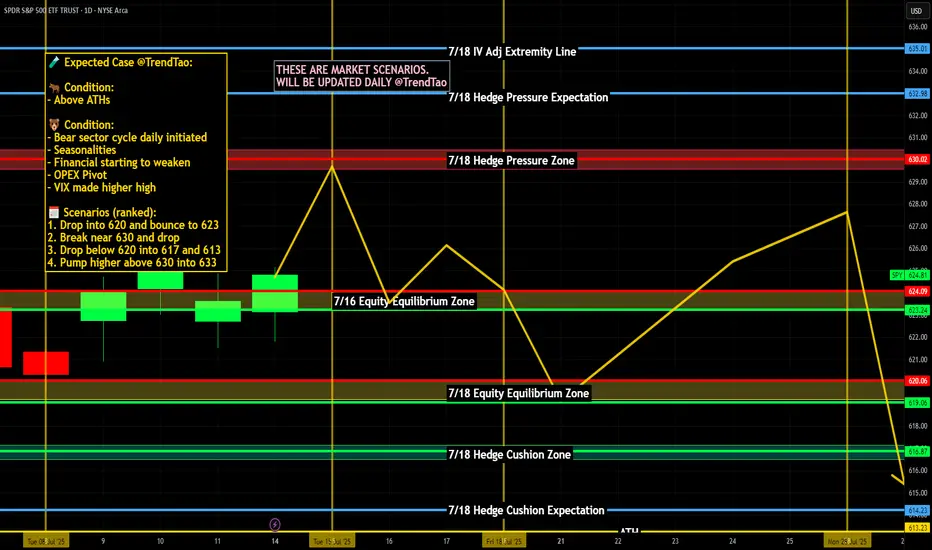
SPY: Bearish Gamma Pin Threatens Breakdown. TA for July 14SPY: Bearish Gamma Pin Threatens Breakdown – What to Watch This Week 🧨
🔸 GEX-Based Options Sentiment (Tanuki GEX Zone)
* GEX Summary:
* Highest Call Wall (Resistance): 625–628 → strong resistance zone.
* Highest Put Wall (Support): 618 → major gamma defense line.
* GEX Flip Zone / NETGEX Support: around 620, where negative gamma begins accelerating downside moves.
* Current GEX Bias: Bearish
* GEX: 🔴
* IVR: 9.8 (very low)
* PUTs %: 51.1% (risk off bias)
* Call walls stack above, forming a clear ceiling.
* Interpretation & Options Strategy:
* As long as SPY trades below 625, the call resistance stack and bearish gamma exposure favor PUT buyers.
* Breakdown below 620 may trigger an acceleration to 617 and even 615 where deeper PUT walls exist.
* Avoid calls until SPY reclaims and holds 626.88+.
* ✅ Suggested Options Play (Bearish Bias):
* PUT 620p / 618p, 0DTE–2DTE if under 623.
* Stop if price holds and reclaims 625.50+ with volume.
🟦 1H Chart Analysis – Price Action, SMC, and Trade Setups
* Market Structure:
* After the recent BOS, price formed a tight rising wedge, then broke CHOCH and now sits inside a retest box.
* This shows distribution behavior and vulnerability to breakdown.
* A clear CHOCH + BOS sequence is already completed on the 1H.
* Current Range & Zones:
* Consolidation Box: 621.50–625.50
* Trendline Support (lower channel): 621–620
* Demand Zone (H1): 617–618
* Critical Liquidity Below: 615–613.50
* Trade Setup – Scalp/Swing View:
Bearish Scenario (More Likely):
* 🔻 Entry: Under 623 with confirmation
* 📉 Target 1: 620
* 📉 Target 2: 617.50
* ❌ SL: 625.50
* 📈 Optional hedge/reversal: Flip long if 626.88 reclaims (very aggressive).
* Bullish Scenario (Low Probability unless reclaim):
* ✅ Entry: Above 627
* 🎯 Target 1: 629–630
* ❌ SL: Below 625
🧠 Final Thoughts:
* SPY is currently sitting in a gamma trap zone, where it’s pinned between major put support (620) and call resistance (625+).
* If price slips below 620, gamma forces could rapidly drive it to 617–615 zone.
* Until we see strength above 626.88, the path of least resistance remains down.
⚠️ Disclaimer:
This analysis is for educational purposes only. Always do your own research and manage risk properly before trading.
$SPY Tomorrow’s Trading Range and everything in it /// 7.14.25Tomorrow’s Trading range and everything in it. How are you playing it?
Weekly $SPY / $SPX Scenarios for July 14–18, 2025🔮 Weekly AMEX:SPY / SP:SPX Scenarios for July 14–18, 2025 🔮
🌍 Market-Moving News 🌍
⚖️ Powell Faces ‘Epic’ Trade‑Inflation Dilemma
Former Fed economists warn Chair Powell is navigating nearly unprecedented terrain: tariffs are pushing up prices even as the labor market cools. Striking a balance between inflation control and growth support remains a formidable challenge
📊 Tariff‑Driven Inflation May Peak This Week
June’s CPI is expected to show a 0.3% month-on-month increase, potentially lifting core inflation to ~2.7%—its highest level in 18 months. These data will heavily influence the Fed’s decision-making process
🏦 Big Bank Earnings Kick Off
Earnings season begins with JPMorgan ( NYSE:JPM ), Goldman Sachs ( NYSE:GS ), Wells Fargo ( NYSE:WFC ), and Citigroup ($C) reporting. Strong results could offset trade and inflation anxieties; expect volatility in financials
📈 Goldman Sees Broader S&P Rally
Goldman Sachs projects the S&P 500 to climb roughly 11% to 6,900 by mid‑2026, underpinned by firm earnings and expected Fed rate cuts. But warns that breadth remains narrow, increasing downside risk without robust participation
⚠️ Summer Volatility Risk Lingers
Deutsche Bank warns that summer’s low liquidity and the looming Aug 1 tariff re‑imposition deadline may spark sudden market turbulence—even amid bullish sentiment
📊 Key Data Releases & Events 📊
📅 Monday, July 14
Quiet start—markets digest back-to-back CPI, tariffs, and clearing post‑earnings.
📅 Tuesday, July 15
8:30 AM ET – Consumer Price Index (June)
Watch for potential tariff impact in CPI; core inflation data are crucial.
8:30 AM ET – Core CPI (June)
10:00 AM ET – Empire State Manufacturing Survey (July)
Early view on Northeast factory trends.
📅 Wednesday, July 16
8:30 AM ET – Producer Price Index (June)
Wholesale inflation signals to validate CPI trends.
10:00 AM ET – Housing Starts & Building Permits (June)
📅 Thursday, July 17
8:30 AM ET – Initial & Continuing Jobless Claims
A gauge on labor-market resilience amid talks of cooling.
📅 Friday, July 18
10:00 AM ET – Federal Reserve Beige Book Release
Fed’s regional economic snapshot ahead of next FOMC.
⚠️ Disclaimer:
This is for educational/informational use only—not financial advice. Consult a licensed professional before investing.
📌 #trading #stockmarket #economy #tariffs #inflation #earnings #Fed #CPI #technicalanalysis
SpyBig week here. Rarely do you get big banks and big tech earnings on the same week..
Jpm, Goldman sach, and JNJ are dow jones heavy weights.
This is important because I think Dow will close that gap at 44,850 and most likely retest ATH at around 45,000.
As long as dow closes above 44,200 Monday, they will do this move
Now logically you have to ask yourself, If Dow jones moves 800pts or 2% what will spy do?
Well unless Nasdaq gives it all up early in the week then Spy will grind higher..
NASDAQ:QQQ
2hour chart is mimicking
June's price action
Even similar bearish Divergence on RSI
So will tech Roll over this week?
TSM and NFLX both reporting..
Qqq 30min price action, as long as price holds above 548.50 I wouldn't short this at all
As you can see with the yellow channel price will be range trading between 551-555. Over 558 and 560 comes.. below 548 and 544 comes.
This is actionable trading, I know some of you want a bigger picture on the short side but until we break below the 20sma I really don't like going full bear at the beginning of earning season...
Yes, alot of things are flashing red signaling a major correction is looming , for Example here's XLC. This is the sector of NASDAQ:NFLX and NASDAQ:META
Here's the weekly chart and RSI
Very bearish bigger picture here, I could easily see this sector and the big names inside it going back to April lows
But then You have AMEX:XLY
The sector of NASDAQ:AMZN and NASDAQ:TSLA
Nothing is bearish Herr and as long as it holds 217 they are going to push this back to ATH.
NASDAQ:AMZN chart is completely identical
So let's say NFLX and Meta have down days similar to last Friday but Amzn and Tsla pumps then you will get a small pullback unless the chipsector dumps also 😉. Remember there's always a bull in the market, they'll just rotate into something less overbought..
Only time you really see majority selling off is when there is a catalyst (Carry trade, tariffs) or Seasonality (March, Sept)..
So I'm bearish on Chips NASDAQ:SMH and I'm bearish on AMEX:XLC but you have to be selective..
I wouldn't short
NASDAQ:TSLA
NASDAQ:AMZN
NASDAQ:GOOGL
NASDAQ:AAPL
Those stocks will likely outperform this Quarter.
As far as the banks earnings , even if they pop, I think this will be a sell the news event and this sector AMEX:XLF (Big banks) is headed for a massive correction
The Small banks AMEX:KRE
Have almost completed their V shape recovery and will most likely correct after this week
Daily technicals are overbought similar to IWM but the weekly is where you see caution
Top of weekly Bollingerband always leads to a major sell the following week
AMEX:SPY
15min chart
I'm bullish early in the week, I think they will buy the dip ahead of earnings so if they open up near Friday's low or the 15min 200sma they could buy it there, below 621 and they will go for the gap close at 620; that will be another dip buy opportunity . Stop loss 619.00
Below 619.00 and they have a gap left open at 614.84 to close. Stop loss 15min 200ma
Trade Idea of the week is NASDAQ:GOOGL
Bullish ascending triangle forming under 182.00 resistance.. Price may breakout this week
4hour chart Friday finished with a Shooting star so we could start the week with a pullback but I think googl will hold 177.00 support and that's a good entry for a long.. or wait for conformation which would be a break above 182.00..
So 177 or 182 is my entry
Googl is only bearish below 172.00 or 200ma
Personal opinion This administration Has promised 200 trade deals and have gotten only 3 so far. As we get closer and closer to August investors will get nervous and I think we will see another major sell! He's has kicked the tariff can down the road as far as it can go and still these countries are calling his bluff. Becareful because I think the next time trump won't fold
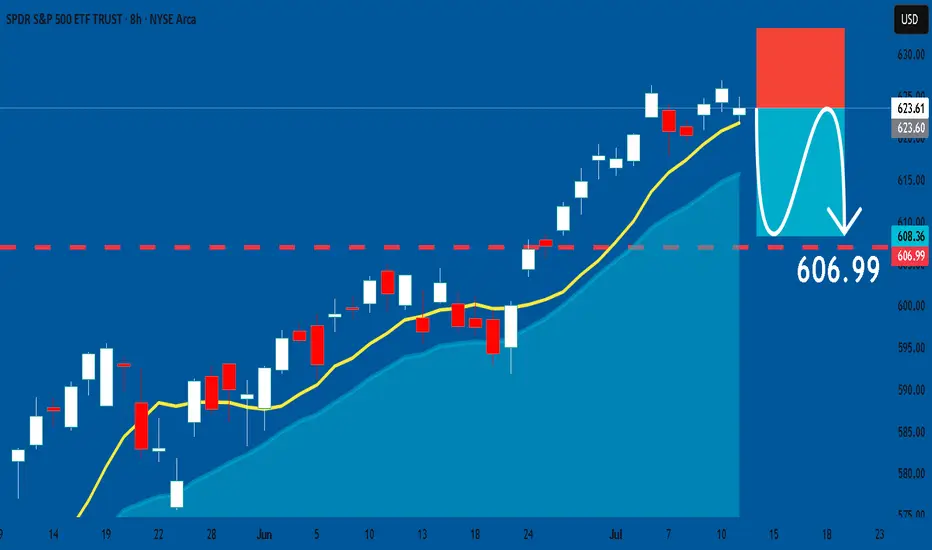
SPY: Short Signal Explained
SPY
- Classic bearish formation
- Our team expects pullback
SUGGESTED TRADE:
Swing Trade
Short SPY
Entry - 623.61
Sl - 633.09
Tp - 606.99
Our Risk - 1%
Start protection of your profits from lower levels
Disclosure: I am part of Trade Nation's Influencer program and receive a monthly fee for using their TradingView charts in my analysis.
❤️ Please, support our work with like & comment! ❤️
Select Your Trading Time
There’s an old saying:
“Plan your trade, and trade your plan.”
But I want to add something even more important:
“Pick your time to trade.”
---
💰 The Market Is Not Your ATM
Everyone enters trading with one goal: make money.
Some even think of the market as an ATM — pull the handle, cash comes out.
But the truth is:
❌ The market doesn’t care about your goals
❌ It won’t move just because you need to make money today
This is a brutal game. And you don’t control the clock.
---
⚠️ When You Force a Trade...
Too many traders say:
“I have to make money today.”
“I need to hit $X this week.”
“I just took a loss, I must come back now.”
That kind of thinking leads to:
Bad entries
Overtrading
Emotional decisions
Big losses
❗ Trading success doesn’t come from forcing outcomes — it comes from waiting for the right moments.
---
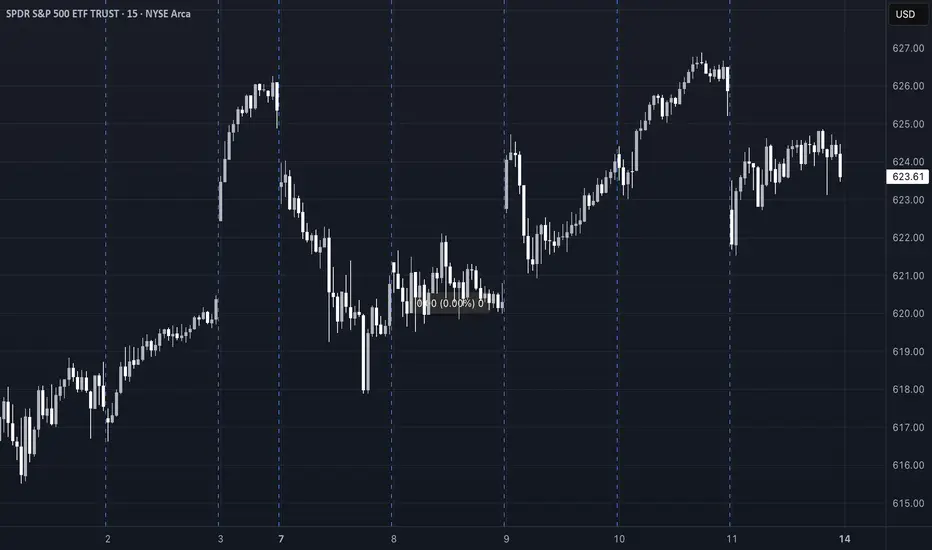
🧠 What Happens on Low-Volatility Days
Let’s take today as an example.
SPY moved in a 2-point range all day.
No momentum, no trend, just chop.
Some traders:
Ran one QS signal after another
Forced trades just to feel busy
Got chopped up by fast reversals
Then blamed the signals
But here’s the truth:
AI or not , you can’t expect any long-volatility trade to work when the market is dead still.
The only winners on days like today? Market makers and options sellers.
---
❓ Why Trade at All on a Day Like This?
If the market isn’t offering opportunity,
Why force it? Why chase trades? Why burn your energy?
The smarter move is:
Sit out
Observe
Wait for better setups
Preserve your mental and financial capital
---
🔄 Recovery? Yes — But on Your Terms
Some traders lose money and say:
“I need to make it back today.”
That’s emotional revenge trading.
What if the market doesn’t give you a clean opportunity today?
Are you still going to go all-in, out of frustration?
❌ That’s not a strategy. That’s gambling.
---
📍 QS Signals Are a Map — Not a Magic Button
QS AI signals help you find opportunities — but even the best map won’t help if:
You're in the wrong city (bad market environment)
You’re rushing without checking road conditions (volatility, news, timing)
Even with QS, you don’t have to trade every day, every hour.
---
✅ What You Should Do
Be patient
Respect market conditions
Take a break on slow or tricky days
Come back when the odds are in your favor
---
🧘♂️ Final Words
You don’t have to win every day.
You don’t have to trade every day.
You don’t even have to be active to be successful.
🎯 Trade less. Trade smarter. Select your time wisely.
That’s how real traders survive and thrive in this game.
Friday afternoon UpdateSPX looks like it's consolidating only. Gold has broken above resistance. OIL and Nat Gas looks like they want to go higher. BTC should go higher, but not too much more.
