Inverse cup and handle update!! Saw this earlier at lunch time and now the handle is complete we can see a slow trend down tomorrow. But I highly see a falling knife. Let’s see how it plays out.
SPY trade ideas

The 3pm sessionanalysis of the market at different times during the hour. I stayed short. AMEX:SPY SP:SPX #ES_F

Real GDP vs SP500Real GDP and the S&P 500 are interconnected indicators of economic health, though they measure different aspects of the economy. Real GDP reflects the total value of goods and services produced, adjusted for inflation, and serves as a broad measure of economic growth. The S&P 500, on the other hand, represents the performance of 500 large-cap U.S. companies and is often seen as a barometer of corporate profitability and investor sentiment. Generally, when Real GDP grows, it signals a healthy economy, which can boost corporate earnings and drive stock prices higher, positively impacting the S&P 500. Conversely, a decline in Real GDP, such as during a recession, can weigh on corporate profits and lead to declines in the S&P 500. However, the relationship isn't always direct or immediate. For example, the S&P 500 is forward-looking and often reacts to expectations of future GDP growth rather than current data. Additionally, factors like monetary policy, interest rates, and global market conditions can influence the S&P 500 independently of Real GDP trends. In periods of economic uncertainty, the S&P 500 might rally on hopes of stimulus or recovery, even if Real GDP data remains weak. Thus, while Real GDP and the S&P 500 often move in tandem over the long term, their relationship can diverge in the short term due to market sentiment and external influences.

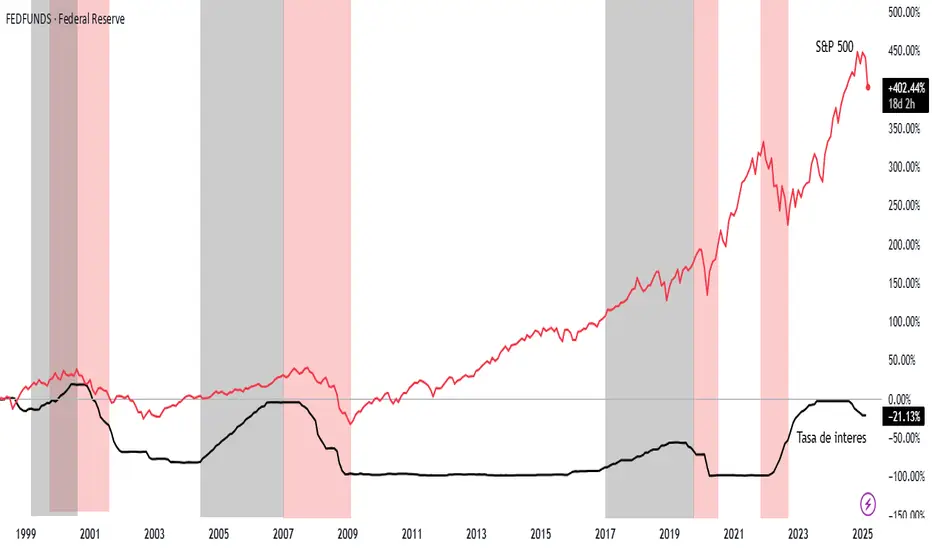
SP500 vs fedfundsrateThe interest rate and the S&P 500 share a complex yet significant relationship in financial markets. When interest rates rise, the cost of borrowing typically increases for companies, which can reduce their profits and, in turn, put downward pressure on S&P 500 stock prices. Additionally, higher rates make bonds and other fixed-income assets more attractive compared to stocks, potentially leading to a shift of capital away from the equity market. Conversely, when interest rates are low, companies can borrow more cheaply, which tends to boost earnings and, consequently, the performance of the S&P 500. However, other factors such as economic growth, inflation, and market expectations also play a role in this dynamic, making the relationship neither linear nor entirely predictable.
1pm sessionAnalysis of AMEX:SPY at 1pm March 13, 2024 and my reasoning for holding shorts into the close. If anything changes I will stop out
AMEX:SPY SPX #ES_F

A Huge Technical Re-Test of This Important TL Has Just Occurred!Trading Family,
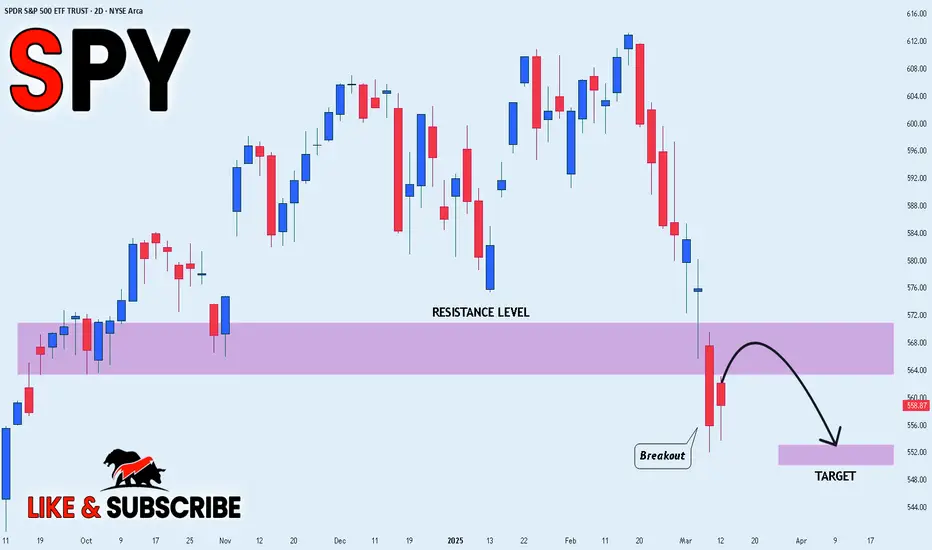
Tariff FUD is recking traders rn. After breaking important support which started in Nov. '24, I knew the SPY was in trouble. My first target down was 563. We hit that and broke it. My second target down was 550. We are there right now! Will it hold? I don't know. TBH, I don't think any analyst that is honest knows. Investors have never seen Tariffs levied like they have been recently by the Trump admin. Noone really knows how this is going to impact the current economy, which is now global (big diff from the last U.S. tariff econ in the late 1800's).
But I can say that this is a big support which is the neckline of our large long-term Cup and Handle pattern started all the way back in Jan. of 2022! We did have one retest already. Usually, this is all that is needed. But apparently, the market wants another. Though the support is strong, remember, every time it is tagged, it weakens. Thus, if it can't hold this current downturn, I suspect it will drop hard from here should it break, possibly dropping all the way to 460. Be prepared for this and watch your trendline closely!
On the other hand, if it holds, I see a huge bounce incoming! We'll probably then go all the way back up to test the underside of that support (red with two with lines) that we broke. Hold on to your hats! We are living in unprecedented times with unprecedented market volatility.
The last item to note is that, once again, this all seems to be occurring at the same time that U.S. congress and senate are voting on a continuing resolution. Correlation does not necessarily equal causation however, in this case, I would suggest that should a U.S. gov't shutdown occur, our support will break and down we'll go. Should a CR pass, big bounce incoming. Stay tuned and watch the news closely for this. It seems to be a news driven event.
✌️ Stew

SPY Demand Zone on 4H chartLook for a bounce on SPY at the 4H demand zone around 550. Also, reversion to the 21 EMA mean.
SPY/QQQ Plan Your Trade Update For 3-13-25 - Fear Settling InWith the US government only about 39 hours away from a complete SHUT DOWN, I want to warn everyone that metals are doing exactly what they are supposed to do - hedge risks. While the SPY/QQQ are continuing to melt downard.
I created this video to show you the Fibonacci Trigger levels on the 60 min SPY chart, which I believe are very important. Pause the video when I show you the proprietary Fibonacci price modeling system and pay attention to the fact that any upward price trend must rally above 563.85 in order to qualify as a new Bullish price trend.
That means we need to see a very solid price reversal from recent lows or an intermediate pullback (to the upside) which will set a new lower Bullish Fibonacci trigger level.
Overall, the SPY/QQQ are in a MELT DOWN mode and I expect this to last into early next week unless the US government reaches some agreement to extend funding.
This is not the time to try to load up on Longs/Calls.
The US and global markets are very likely to MELT DOWNWARD over the next 2 to 5+ days if the US government does SHUT DOWN.
FYI.
Gold and Silver may EXPLODE HIGHER.
Get some.
#trading #research #investing #tradingalgos #tradingsignals #cycles #fibonacci #elliotwave #modelingsystems #stocks #bitcoin #btcusd #cryptos #spy #gold #nq #investing #trading #spytrading #spymarket #tradingmarket #stockmarket #silver

SPY/QQQ Plan Your Trade For 3-13-25: Carryover PatternToday's pattern suggests the markets may attempt to continue to find support and move into a sideways pullback (upward) price channel.
I believe the markets have reached an exhaustion point that will move the SPY/QQQ slightly upward over the next 5 to 10+ days - reaching a peak near the 3-21 to 3-24 Bottoming pattern.
This bottoming pattern near March 21-24 suggests the markets will move aggressively downward near that time to identify deeper support.
I believe metals will continue to move higher as risks and fear drive assets into safe havens.
Bitcoin should continue to slide a bit higher while moving through the consolidation phase.
Watch today's video to learn more about what I do and how I help traders find the best opportunities.
Get some.
#trading #research #investing #tradingalgos #tradingsignals #cycles #fibonacci #elliotwave #modelingsystems #stocks #bitcoin #btcusd #cryptos #spy #gold #nq #investing #trading #spytrading #spymarket #tradingmarket #stockmarket #silver

STOCK MARKET ANALYSIS! BEAR MARKET IS HERE? I hope you guys enjoyed the video, If you have any questions or comments feel free to comment down below! Thanks for watching.

SPXSP500 is ready to fly again.
Don´t panic, it´s not real the currently situation.
Buy to pessimist.
Still movement up at least till september-october.
thks.

Is it done yet or will we see 540?! Bear sentiments but short term Bullish momentum after this months hard fall. Watch out for fake outs. Up or down I’m swinging with the market. GL traders just was I see. Not a professional. Take no advice. Happy Thursday ‼️‼️‼️

SPY STRONG BREAKOUT|SHORT|
✅SPY made a bearish breakout
Of the key horizontal level
Of 568.00$ which is now
A resistance and the breakout
Is confirmed so we are bearish
Biased and we will be expecting
A further bearish move down
SHORT🔥
✅Like and subscribe to never miss a new idea!✅
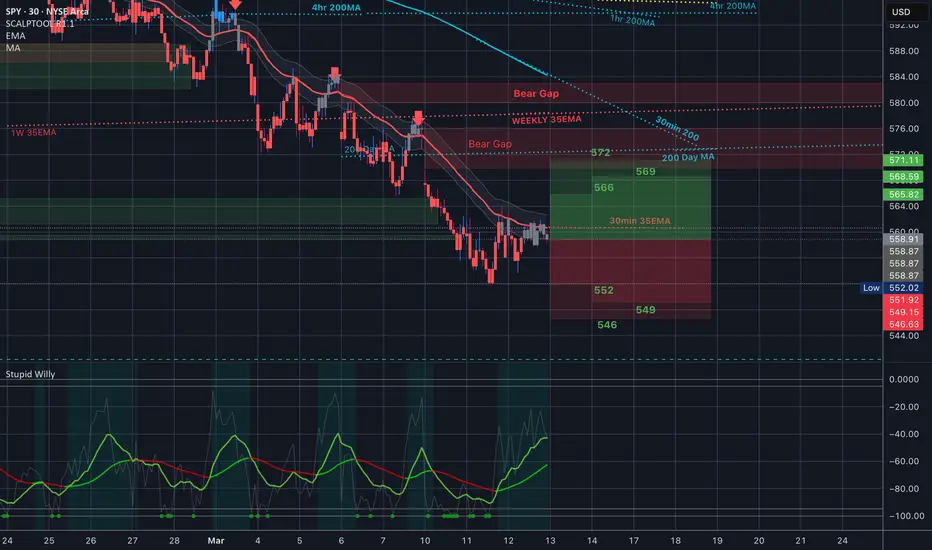
$SPY - Trading Levels for March 13 2025
Alright, y’all. We are dangling, unsupported underneath the 200DMA and that Bear Gap. I am trading cautiously today because inflation data days I tend to make a lot of mistakes.
35EMA - this level is a BEAST. We were unable to get above it yesterday. Trace it back 3 weeks and you’ll see it’s been there every time to push us back lower.
I will be looking to the outer spreads and even then I might push it out a little.
If and when I take a position I will update it here.
GL, y’all.
SPY=541We are still a long way to the bottom of the chaos. While enjoying the free fall I expect SPY to move a bit towards the resistance of $564 in order to catch a good movement to the next support level at $541. Let's hope the investors keep hoping so we can keep taxing on the short run.

Time for lift off?!Feels like the bulls have stepped back into the game at least to rally through tomorrow! What do you think 👍 or 👎 comment below!
