$UNG NatGas Analysis, Key levels, and Targets $UNG NatGas Analysis, Key levels, and Targets
My average is 23.25 here… I’m 4,000 shares deep. Let’s rally, nat gassers… lol… I’m long here… big time..
UNG trade ideas

deep accumulation as supply is offloadedthe fed has quietly halted bottom line reductions of the balance sheet, markets should rally leading into the holiday season and then tank once again. Energy commodities are experiencing more supply than usual leading into the winter. This is necessary in the current economic conditions to prevent civil unrest and casualties in colder climates. Speculation that supply is being subsidized.
Bullish for companies that rely on cheap natural gas, bearish for gas price. Deep accumulation for 6 months or so, could shoot up at any time if the supply flow is reduced. Hard to trade. Have calls but looking to exit.

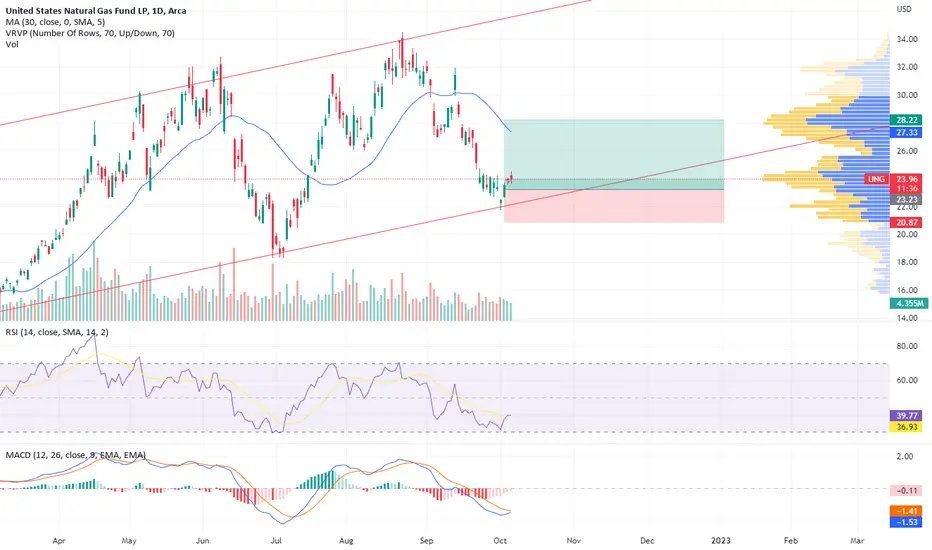
UNG LongI think here is a very good long opportunity. We can reach the volume defined area at the price 28. The daily MACD also confirms the higher low and the turning point. RSI is not overbought.
$UNG: Next leg up in Nat Gas pricesI think we may see a rapid advance in Nat Gas here, the technical setup in $UNG paves the way for a 18.4:1 reward to risk potential trade. I'm long equity here, but you could trade this with options, or an equivalent fund in the EU or UK (if you're EU based). Futures or options on futures are also an option, but more complicated to execute with maximum efficiency. I suggest you explore this if you're more experienced, and able to determine which strategy to use to maximize RR and performance vs capital allocated to this idea.
Best of luck,
Ivan Labrie.
$UNG my position $UNG Analysis, Key levels & Targets
I have 2000 shares of UNG at 26.50… looking for 30.06 for 13.43%… let's go...

UNG natgasLooking for one last pump up to 35 or 38 by end of October.
30/8-69 for the next move up.
Long position to 35 or 38.
ozindustriesforecasting.com to subscribe to Crypto, Forex, Stocks and more.

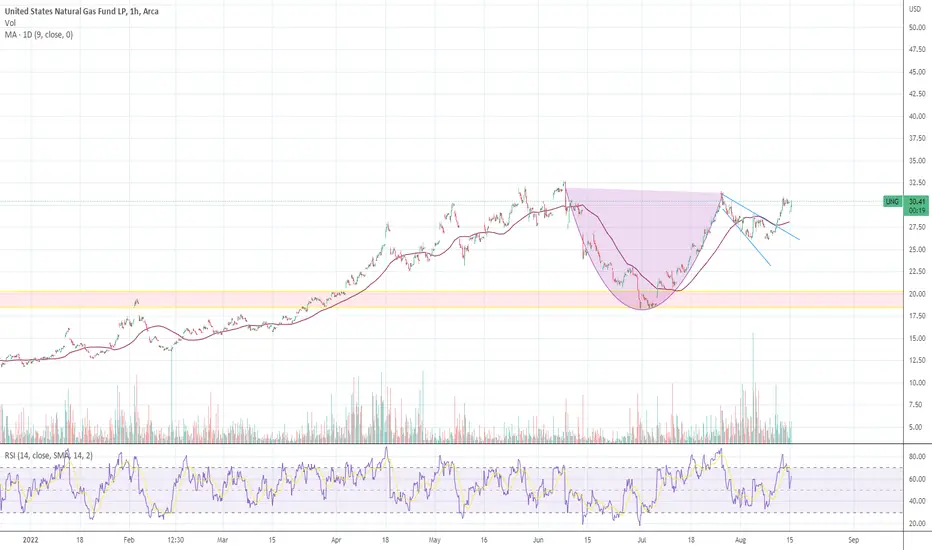
Natural gas looking to go higherSomething a little different than my main focus. Natural gas forming a text book cup and handle. Lets see if this will materialize into a bigger move.
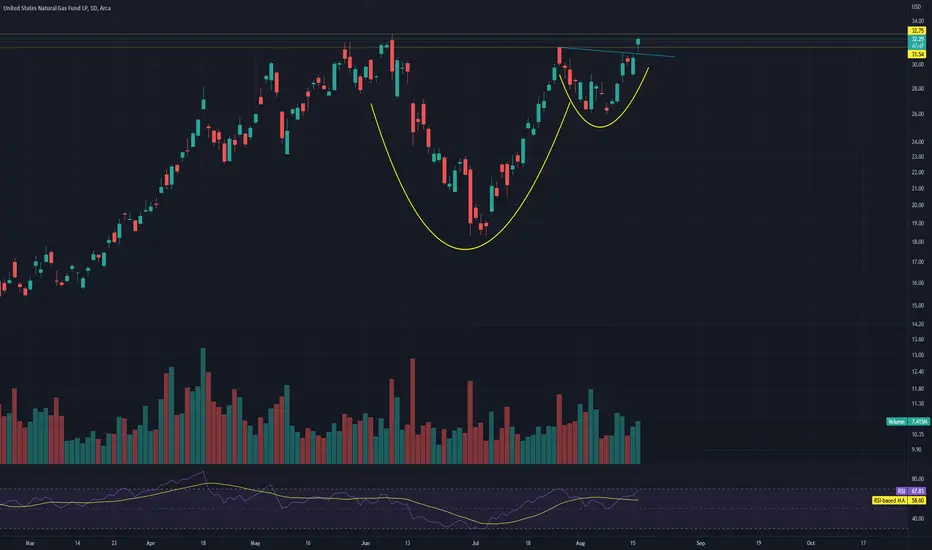
Commodities are back, $UNG near breakoutThe natural gas ETF is forming a cup & handle with pivot buy at $31.60. This behavior signals a comeback for stocks in the gas industry.
Some of them are NASDAQ:NFE , which I was stopped out in June. NYSE:VET and AMEX:LNG . These 4 are in the top of my watchlist.
All are in confirmed uptrends and leading the sector. Several oil stocks also look good but I think that they are just following the gas stocks. I say this as the oil ETF AMEX:USO isn't as near of a new high as AMEX:UNG .
Look for stocks with gas exposure.

Cup and handle UNGtime to Buy UNG
cup and handle pattern
from a fundamental point Gas is looking to go higher there are not to much supply

Bullish on $UNG - $30 Strike for Calls 8/26 is goodUNG looking bullish, I am taking a $30 Call Exp 8/26
UNG - why didn't I dare to buy?UNG is really a leader that has fundamental reasons to be one.
But let's look at it technically- It was a inverted head and shoulders.
And there was an attempt to break the shoulder, but we got a strong reaction.
Was it possible to start a position there? I think it really MUST have been.
So, the price is gone, let's wait for more setups.

UNG Reversal time?Nice breakout so far.
Waiting for confirmation above 21, above that level could test previous highs.
UNG (Natgas) defying the ST trend in the energy marketsNatty has been dancing to the beat of its own drum lately while oil, uranium and xle components have been struggling. Elliott Wave is a tool I often use, but I still consider it esoteric in nature, and often difficult to read, so, reader beware. So, while the bottom may be in for Natty, at recent support just under 18, I suspect a re-test is coming, as well as a possible, even if unlikely, gap fill around 14.
$UNG Analysis, Key levels & Targets$UNG Analysis, Key levels & Targets
NatGas is starting to look very interesting again… what a monster drop today, though!! I will be looking to get into a position tomorrow… I’ll update here with whatever long position I end up taking…
I love trading natgas and it has been too long…
—-
I am not your financial advisor. Watch my setups first before you jump in… My trade set ups work very well and they are for my personal reference and if you decide to trade them you do so at your own risk. I will gladly answer questions to the best of my knowledge but ultimately the risk is on you. I will update targets as needed.
GL and happy trading.
IF you need anything analyzed Technically just comment with the Ticker and I’ll do it as soon as and if possible…

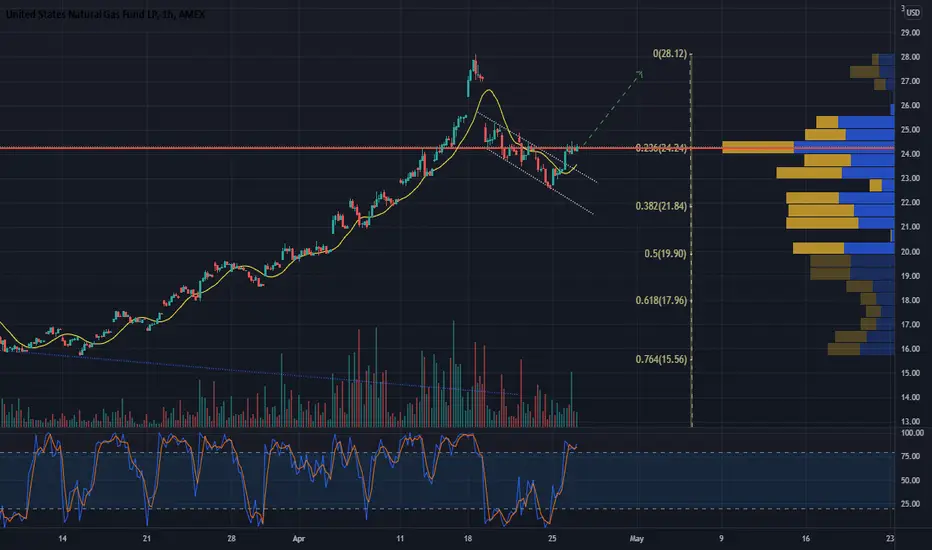
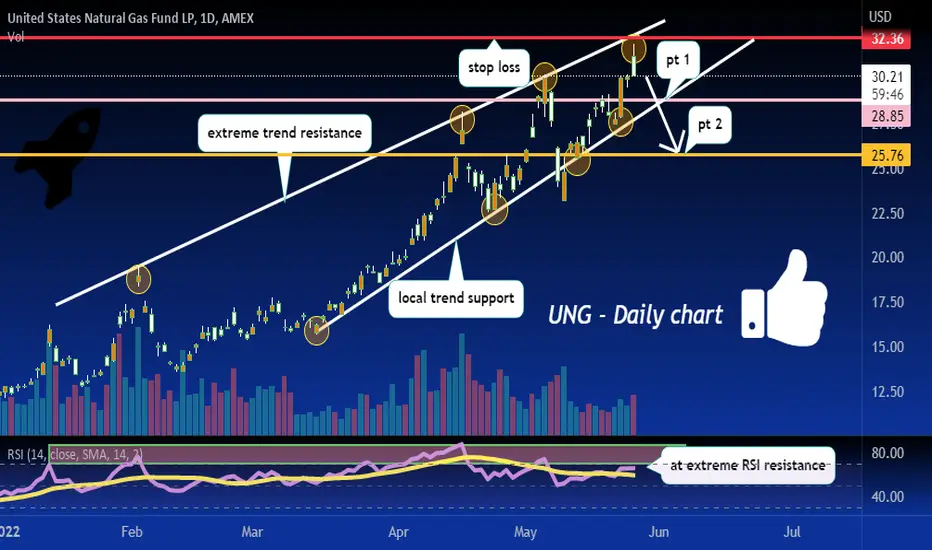
another rejection at the TL resistance, not good for longs >.<after a nasty rejection from trend resistance we can expect more downside, my targets are 28.85-25.76
UNG Short SetupUNG is forming Rising Wedge
Long term we can see its forming a perfect Bearish Head and Shoulder pattern
Short term target is at $23
Mid Term target is $21
Long Term target is at $12

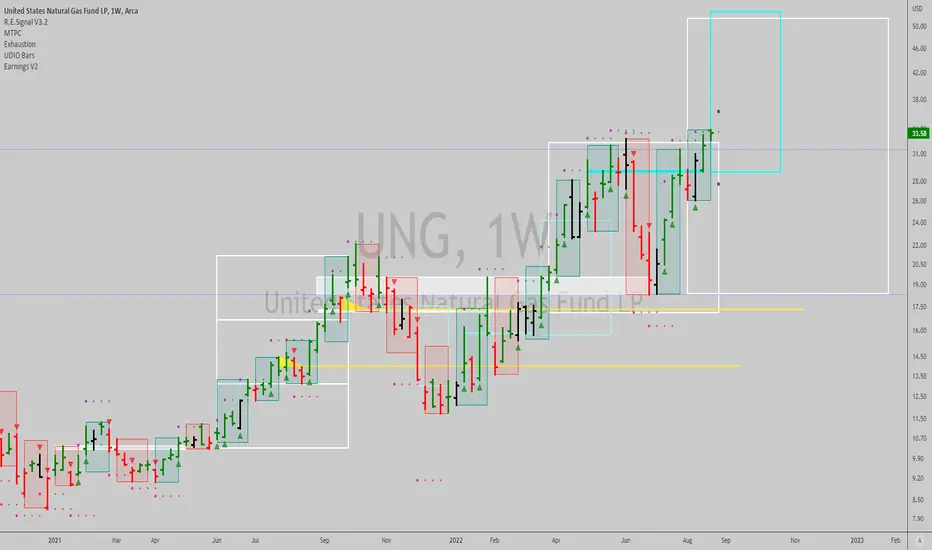
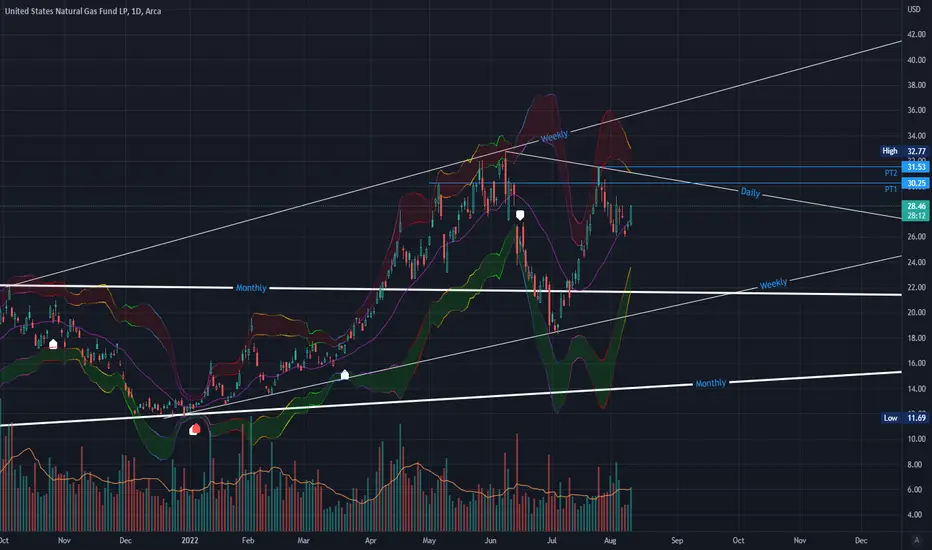
UNG (US Natural Gas ETF) - Weekly - Support, Resistance, TrendUNG (US Natural Gas ETF) - Weekly chart.
Support, Resistance, Trendlines for reference.
note: chart is on a Logarithmic scale.
05/11/2022.

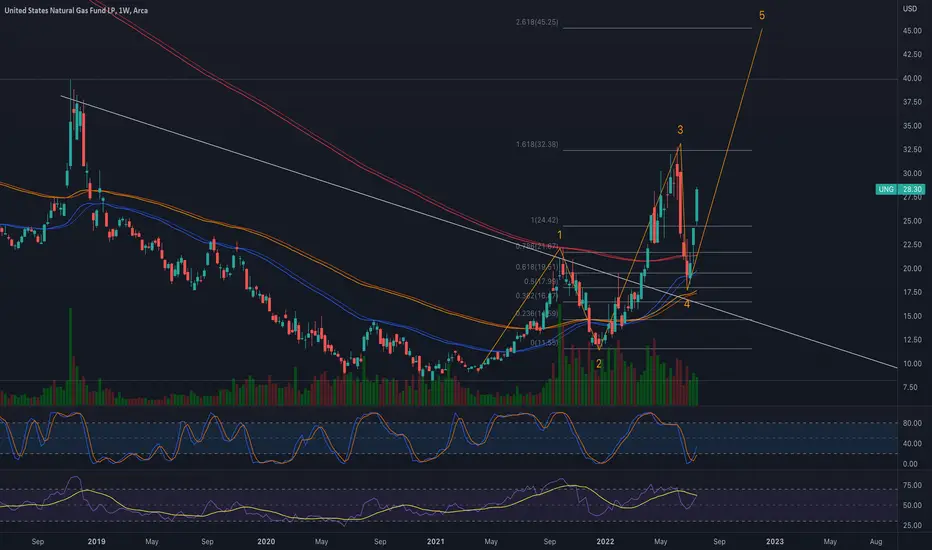
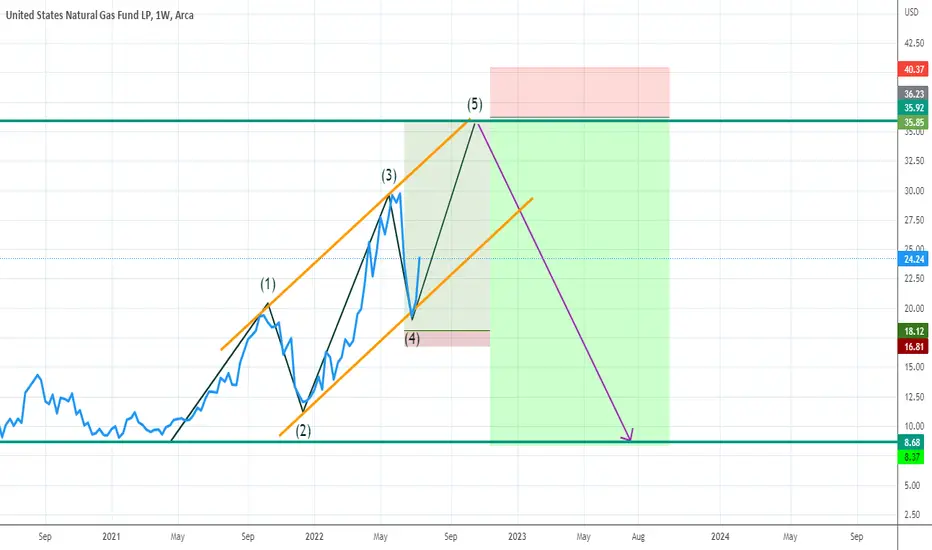
UNG bullish;W3 OF III extended;may retrace to 25.34 midbox firstIn this weekly chart, UNG Natural Gas still has a long way to go. It is currently doing wave 3 of 3 but is already over-extended in its Bollinger Band. It is likely to retrace very soon to the middle of the latest DARVAS consolidation box which is 25.34 before continuing the wave 5 of III. 25.34 is also the low of the latest big green weekly breakout candle.
Supply crisis is not going away soon.
Not trading advice

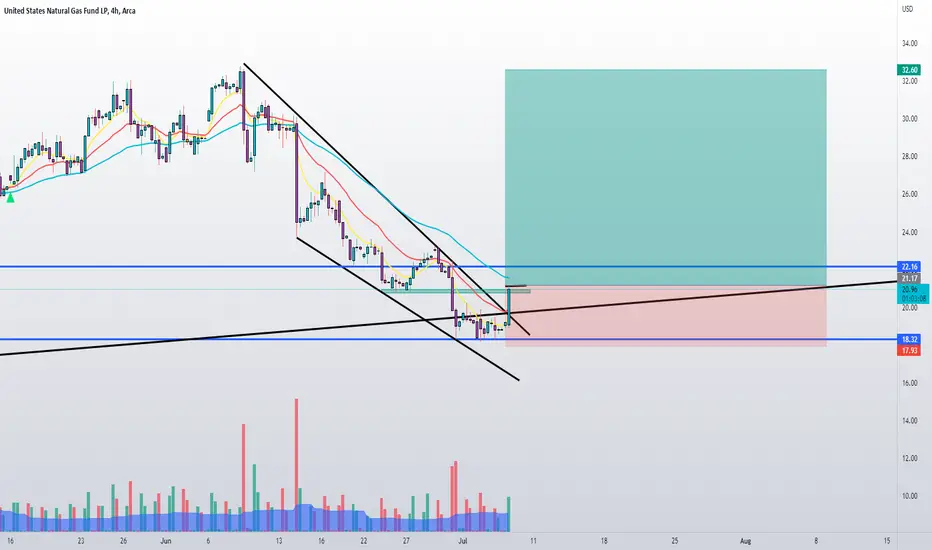
UNG: A Great Buy Setup to Capture the Bullish Continuation Earlier this month, UNG has reached a three-year high at $28 level. Immediately, the price gapped down to $25 level. The market has been moving in a short-term descending channel. This week, the price broke the channel by forming an inverse head and shoulder pattern. After breakout, the price retested the neckline and formed a bullish doji. This is a good indication that bullish momentum has taken over the market. First buy target is set in the gap area at $27 level. Second target is set at $28 level or higher, as the market is very bullish at the moment.
If you liked our analysis, please hit the “like“ button, comment, and follow us for more! We only create high quality ideas and charts, with each idea thoroughly explained :)

Uptrend about to resumeMinor pullback, flag consolidation and breakout to the upside. May back test the top of the flag.
In terms of macro events, we have the blizzard in N. Dakota/Montana shutting down the oil/gas fields. Still much colder than normal nation wide and Russia starting to cut off gas supplies to Europe as Poland got smacked today. More to follow?