Long | XLFAMEX:XLF
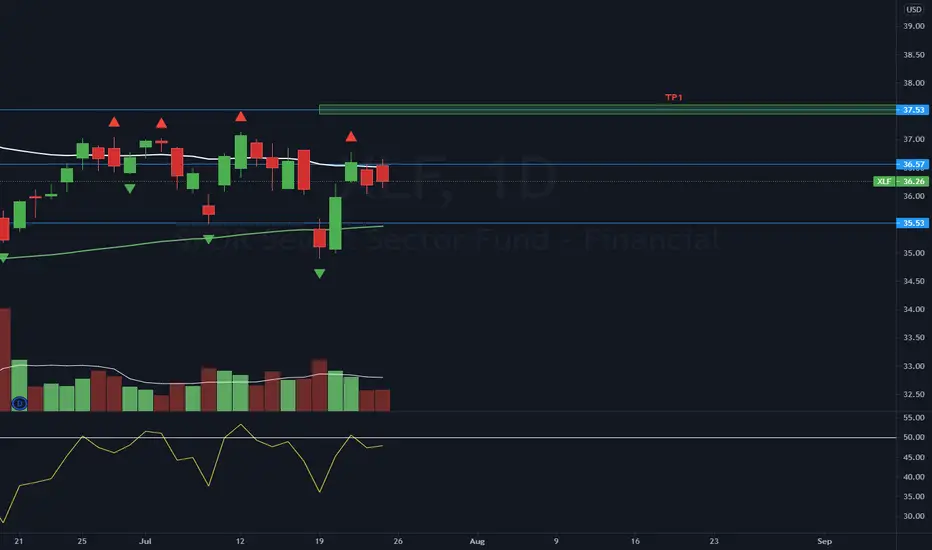
Possible Scenario: LONG
Evidence: Price Action
TP1: 37.5
Call options 10/15/21 strike 38$
Financial sector lagging for few weeks and now it's ready to take the lead again.
This is my idea and could be wrong 100%, not a buy/hold/sell signal.
XLF trade ideas
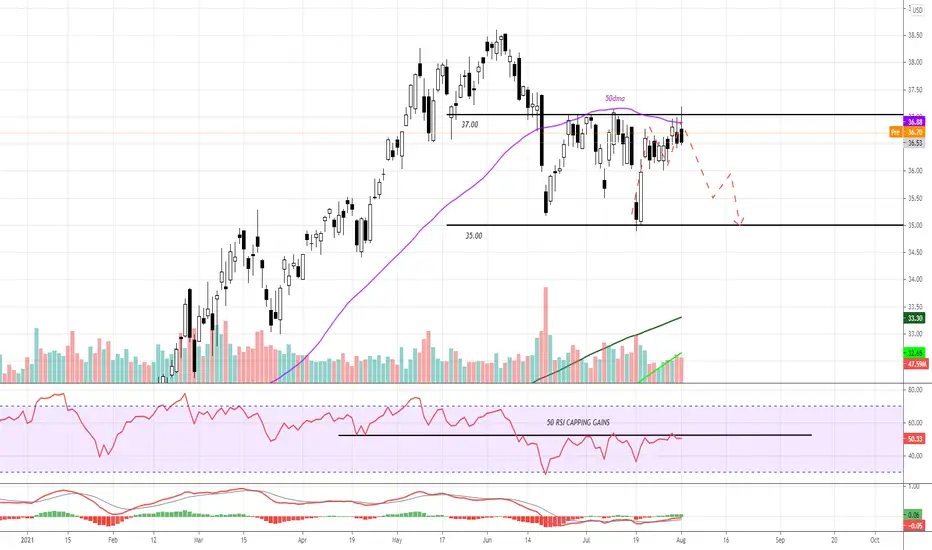
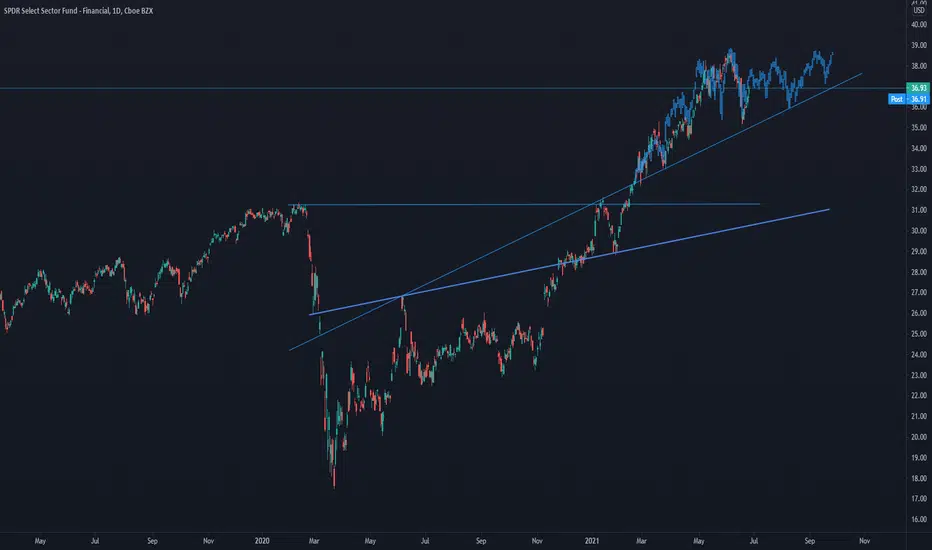
$XLF Financials failing at resistanceThe XLF ETF which tracks the financial sector of the U.S market has been battling to break resistance at $37 and the 50 day moving average. With the push lower in yields, fundamentally this is generally quite negative for banks and financial firms as this substantially decreases their profit margins.
We could potentially retest the bottom of the range at $35.00 and if that breaks then $33 could be in site which is around the 200 day moving average.
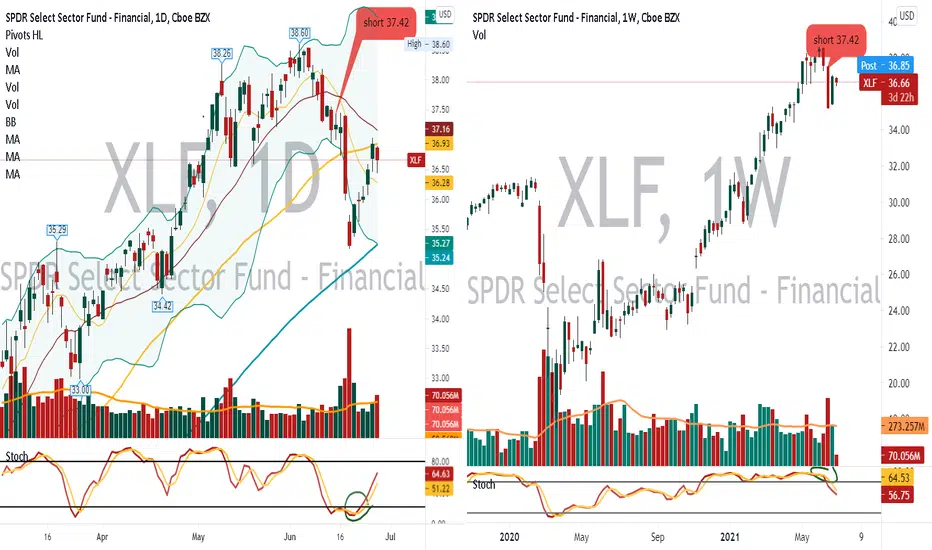
XLF STAYING SHORT @ 37.42Daily wants to roll over vol not bad
Weekly heading down staying short small shares

Long term Elliot Wave analysis for financialsIn this video I've shown the longterm price action for the financials. The take away here is that a ~2 year bear market which corresponds to wave C has most likely begun.

look this guys xlf EXAMPLE
Say u ahrt at 38 off daily stoch rolling over and it made a lower high hitting resistance
ok so know shrt off daily why hitting r1 and stoch rolling over. what i do next is watch my weekly and I wait for that stoch break 70-68% weekly stoch on bottom then i can add why trend down
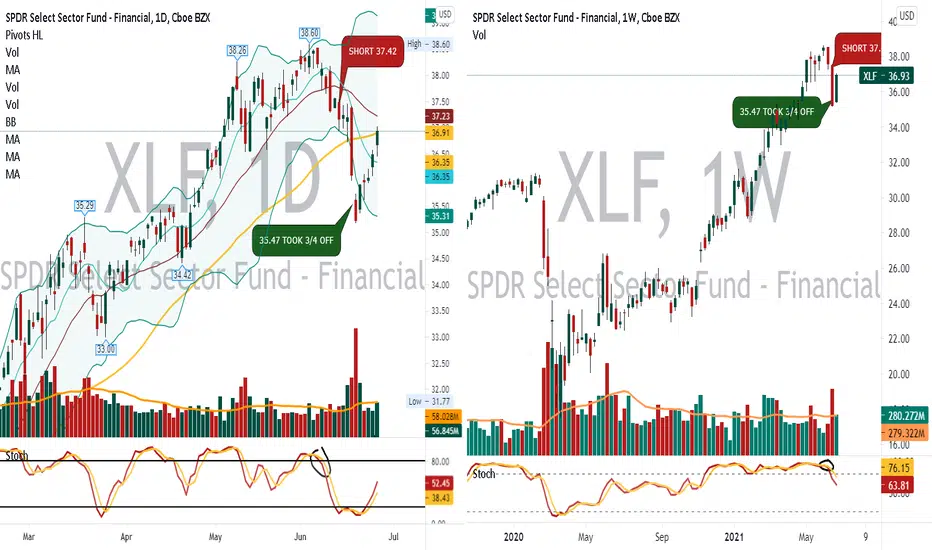
ok drop to 35.18 daily stoch on bottom so u take 3/4 off the short keep 1/4 on
know she runs up daily stoch and boom stops at 50 day, but as she is running up look weekly stoch when it hit 50 day ma weekly stoch heading down and little tip stoch wide apart very neg, so it said stay shrt once it did not break thru add back on the 3/4 took off. Dont get scared out position this is for swing trading

XLF STAYING SHORT @ 36.60 smallDaily say wants to go higher but again look vol bad and under the 50 day MA.
Ok again daily stoch weekly bottom
see how the daily going up and weekly heading down that is called a head fake rally
why weekly holds more weight its heading south TRUST THAT WEEKLY
it never lies.
TA on IWM shortIWM a short I am not in this just showing TA
Look daily heading down on bottom should get a dead cat
bounce to the 50 day 225 support 213.58 -211.54
they break we go 206.55 200 day
Know look weekly stoch heading south trend is down
Ok lets go back to daily we can get a rally dead cat bounce 50 day
and fail why as long as that weekly stoch stays heading down while the daily
stoch rises it will fail. Trust that weekly just when it rallies reduce shares on short and trail the rest
then when ready add back to short. Very simple process

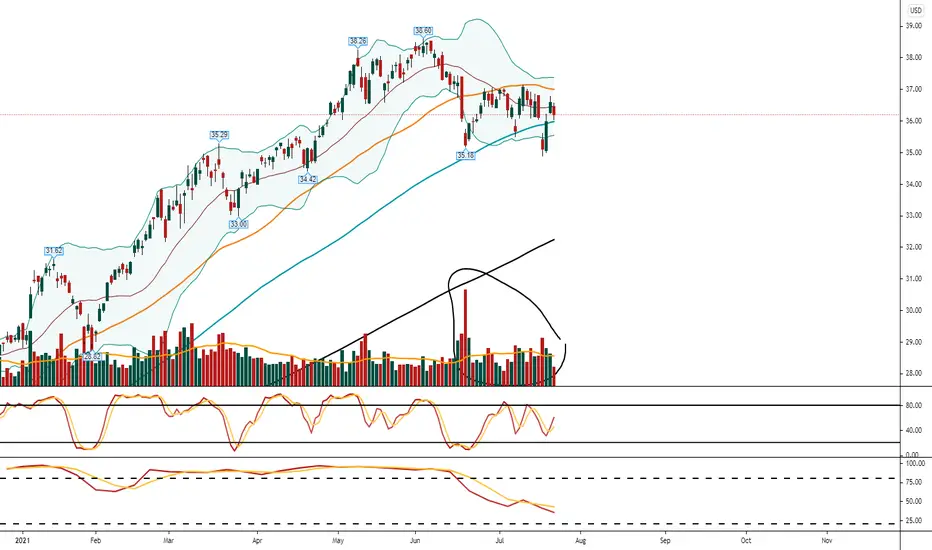
Rotation out tech into banks know Swing tradeEARNINGS BANKS START 7/13/2021
Daily prefect buy off 100 day MA 35.66
Stoch heading up
Weekly nice higher lows and stoch turning up
Stop under 100 day ma 35.37 use odd number at the end . Market maker goes after even numbers
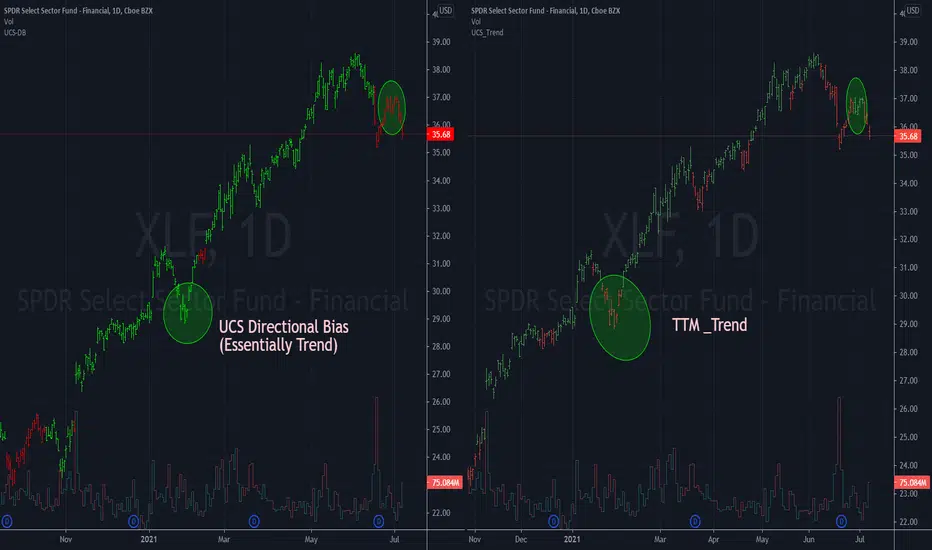
New Trend (Directional Bias)I have developed to Simply your lifeNotice is the difference between the other trend indicators available in the market vs the new and improved directional bias indicator. I have prepared to help my friends in this community.
It keeps you in the trade when you have to, not exit you out when there is a short pull back. However, when the pullback is not a fake one, It pulls you out.
FEEDBACK PLS.
I miss this stuff.
Long XLF @ 36.35 off weekly stochlook weekly I shorted at top when it rolled over
took profits when short got to bottom. Know long
Play that stoch to top when ready short it again
Continuously making money.
XLF Will be switching from a short to a long Daily says pull back more the stoch
Weekly says careful long but trying turn up

XLF STAYING SHORT @ 37.42Weekly heading south trend is down and making lower highs
More selling than buying on vol

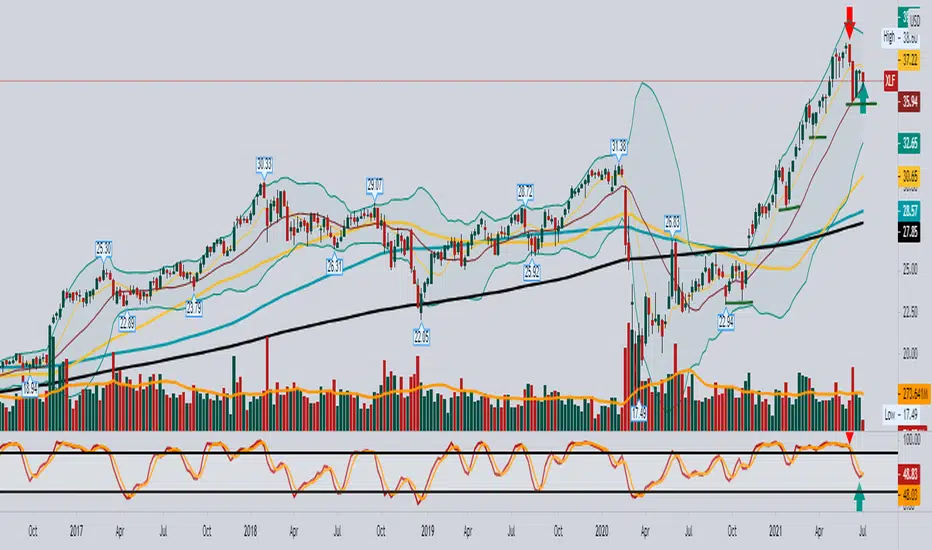
Financials suggessting yields aren't going to completely pukeI'm still bullish Financials, for now at least. Macro data is still showing growth and inflation rising (quad 2) but we will run out of runway on that as we move into 2nd half of the year proper.
Momentum is still to the upside, and may have bottomed for now. Also, we are rising on lower volumes last couple of days.
Let's see.

XLF STAYING SHORT @ 37.42Daily stoch says snap back up boom hit 50 day stopped. Look at Vol more selling then buying
Weekly says stay short don't get out. Daily lower highs
What A Scout isThis explains what a scout is. It is like buying ticket ball game but u have not entered stadium.
Most folks go in 200 300 400 or more hundred shares and goes against them they panic or cost average in. 25 shares allows stock wiggle room always add free commission. I am long 37.42

XLFNot really a Fib guy but I'm watching this. That extension at $40 has my interest. If price can get there it might time up with a pullback on SPY around 445ish (which I'm also eyeing).

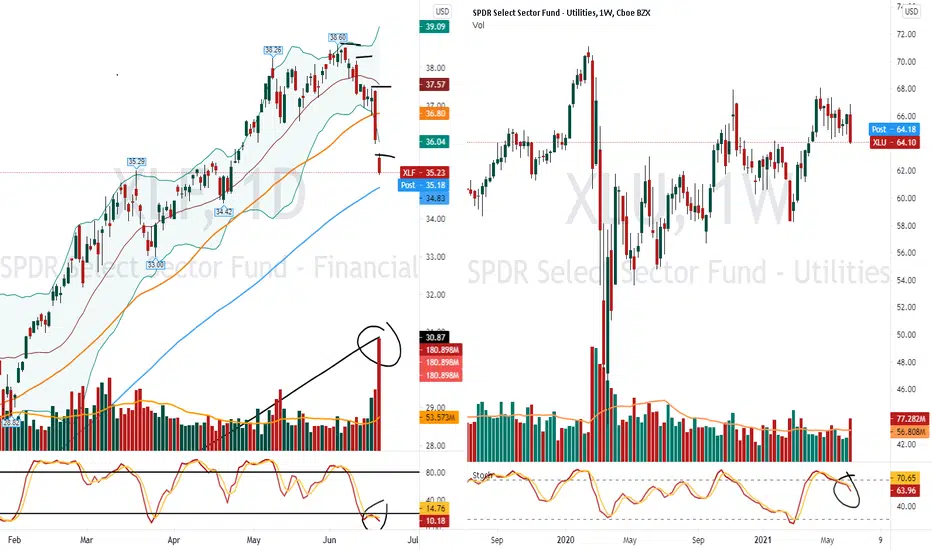
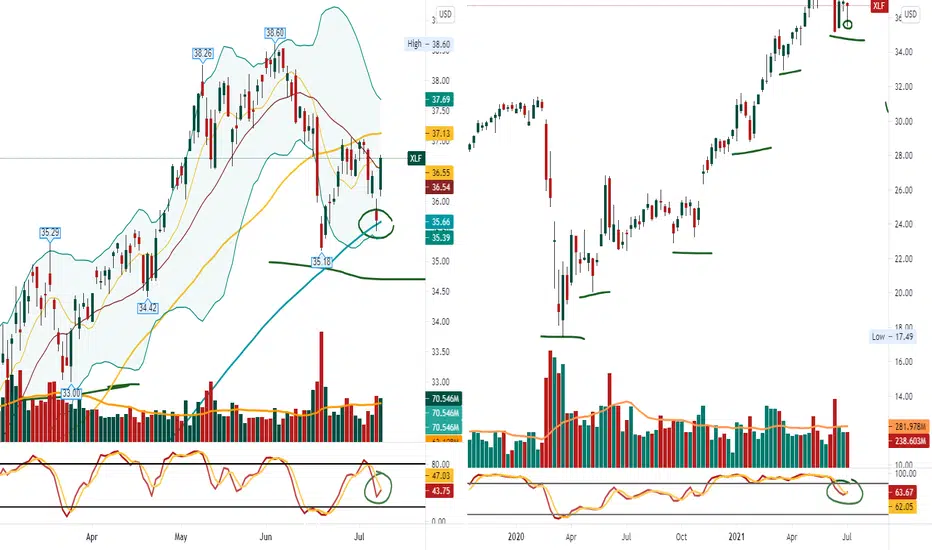
XLF STAYING SHORT @ 37.42In these charts I am going show u how I play the weekly stoch and how I am never late.
37.42 I am short. Look at daily stoch heading down and look weekly heading down. So what weekly does allows me stay in trade longer I am never late if anything I get in to early
Daily stoch heading up but weekly stoch heading down.. Its called a snap back into a down trend.
XLF - IWM fractalXLF has been following a perfect IWM fractal so far. i overlayed IWM recent accumulation pattern on xlf. Lines up with what i think will be a further rotation away from value and into tech/growth next few weeks. accumulated longs at the lows last friday, and will leg into couple month out calls if it can consolidate like this.
XLF STAYING SHORT @ 37.42Daily stoch heading up can go a little higher
more selling buying and we have doji
Weekly just beautiful stoch heading down
and look candles pretty took 3/4 off when we hit support 35.46
waiting to add

all im saying is watch XLF tomorrowrising wedge looking great for the upside, would make a call option but im out of day trades, 10/10 recommended

XLF STAYING SHORT @ 37.42Daily stoch oversold more selling power then buying nice lower highs
under the 50 day
Weekly heading down so trend is down, any rally will fail as long as that weekly stoch heads down
called a snap back into a DOWN TREND

XLF STAYING SHORT @ 37.42Daily lower highs lower lows stoch heading down
vol good we need break that 100 day. But We can bounce here
35.18 100 day.
Weekly look fantastic trend is down