Wedge up for xlf recently the banks have pretty much sold off which is expected while the S&P lingers at the top... usually when the large indice is up and down creating and compleating H&S formations into other formations we catch a wedge up. now brk.b latest movement to ath was created by movement in coca cola. so largest holdings are bac brk b well Fargo black rock etc.... large bank holdings. if these guys even move back to support here from $39.58 closer to $40 Monday morning were looking at putting the $42 call in the money by end of December and the $43 call for January 21st is on .5 now with a quick move up can print these bad boys to .35 + easily. I know inflation is bad for banks for is fed not force feeding the banks' bad? Also, if you're not bullish look at the last time we got a solid trend bounce on the yearly and just imagine the ideas of a bull.
XLF trade ideas

XLF next leg lower? Month price action!Hey yall this is where I see the bank sector going in the next 2 years. i can be 1% wrong tho.

XLF (Banks) early 2022 looks goodYellow line - Secondary support and resistance
White lines- Primary channel
Should hit support 37.50-38$ next week from there we rally .. Might not see a breakout until Bank earnings which are the second week of Jan


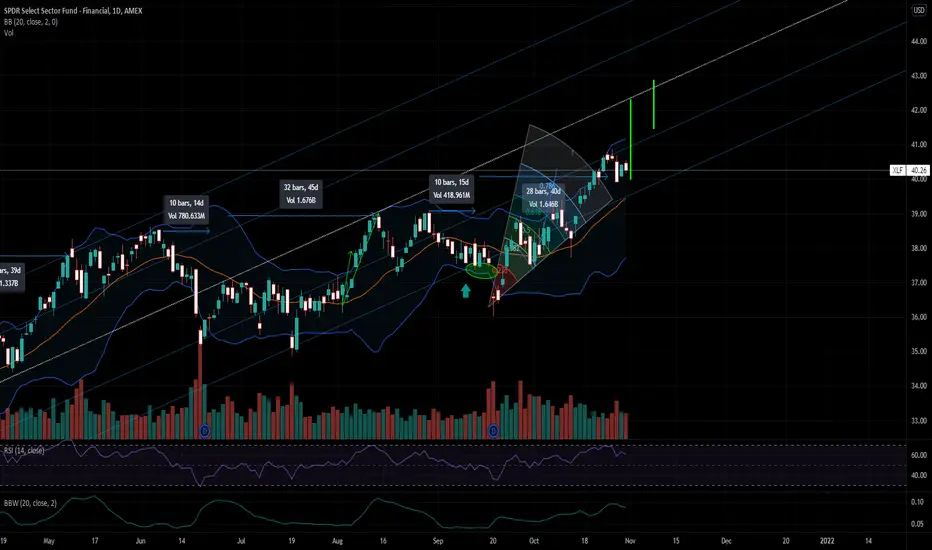
Tough to be too bearish when the $XLF is strong...Approaching the geometric line, so we will see if it serves as resistance...

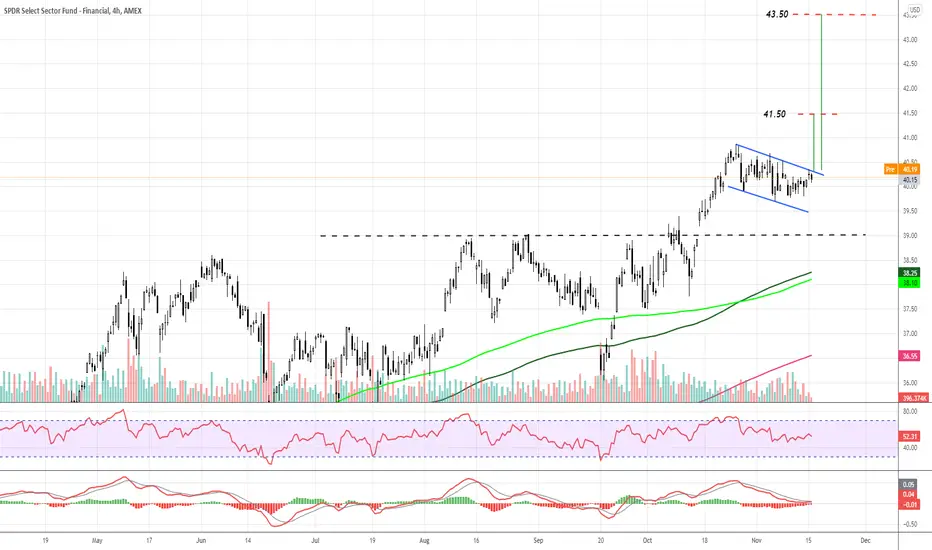
$XLF US Financial stocks looking healthyNice flag consolidation in the financial names (XLF ETF). If this flag breaks up I have two potential targets. Shorter term based on the range of the consolidation channel targets $41.50, and if you project using the distance of the flag pole from the breakout, extended targets sits at $43.50
$spy $xlf Better hold the line or elseOr it's about to get ugly up in here. Financials are on diagonal support that needs to hold

XLF STAYING SHORT @ 40.15 small Stop at 41Daily stoch heading up but look VOL, and making lower highs.
Weekly turning down has not broke 68% but putting pressure on it along with TNX dropping.
Stop at 41.

XLF Daily Bull Flag setupXLF is looking to confirm a daily bull flag pattern and test the ATH. Then looking for continuation to the 42.5 lvl.

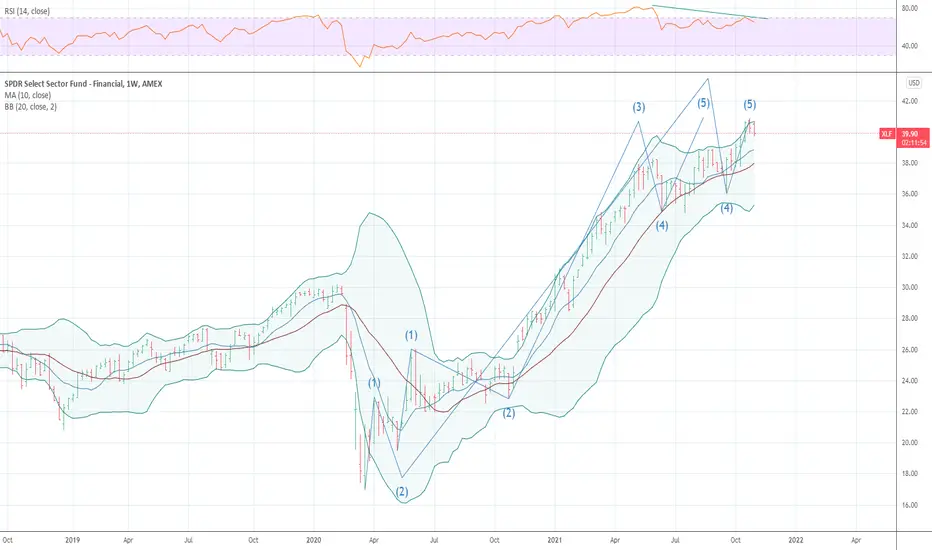
SELL ALL BANKS XLF TOP We have now ended a nice 5 of 5 waves up in xlf banks sector I see deflationary move in bank assets
Banks ready to run again?XLF looks like it's formed a bull flag. Possible sector run coming, it is it's best quarter... add in inflation and rate increases for 2022.

XLFAlso expecting financials to trend back up. The Fed is meeting this week for a press conference and interest rate decision. Commodity prices are indicating high inflation, so I expect the fed to announce a plan on tapering soon. I expect TNX to start trucking back up with financials following. This is supported by TA
XLF what will happen nextXLF had a lon long run until today and the volume profile seems to be abnormal what means this range will either be more present or fastly lost.
To determine the next steps we have to watch the $40 zone, if we break we could step higher if it is holding we could might be fall lower into the more accepted area between $38 and $36

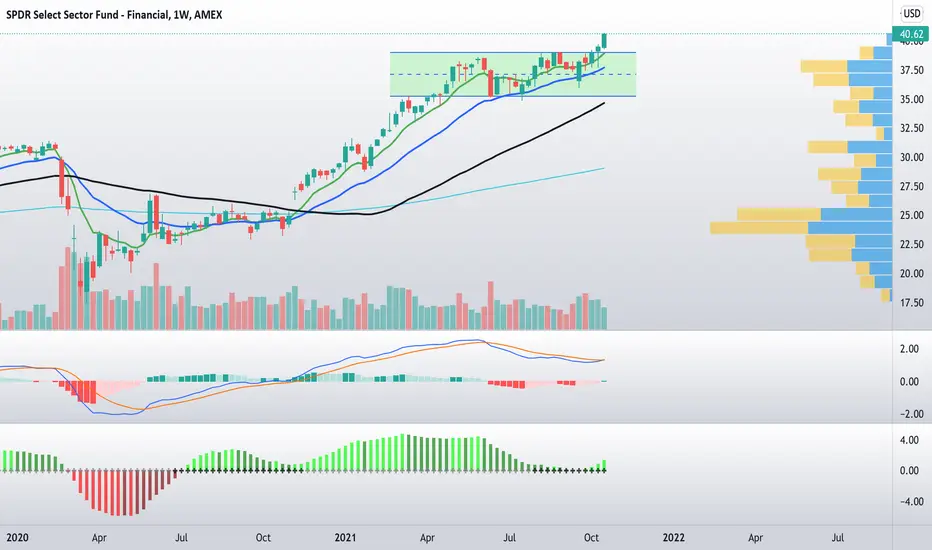
$XLF Financial Sector Breaking OutFinancial Sector (XLF here but all financials looking primed to me) breaking out on the weekly here.
Went long XLF and KRE (Regional Banking ETF) calls for December
Blue skies gotta buy
Momentum has fallen, price will follow- The MACD indicator is a very common and useful indicator to measure momentum
- You can clearly see how XLF had a bearish cross for the MACD while price has crawled higher for 4 months
- This is a very clear sign of dying momentum and almost always precedes a correction
- If you see the linked chart below, XLF has been going through a clear distribution phase for a few months now
takeaway: ~11% correction to the ~35 level in the very near future. (couple weeks)

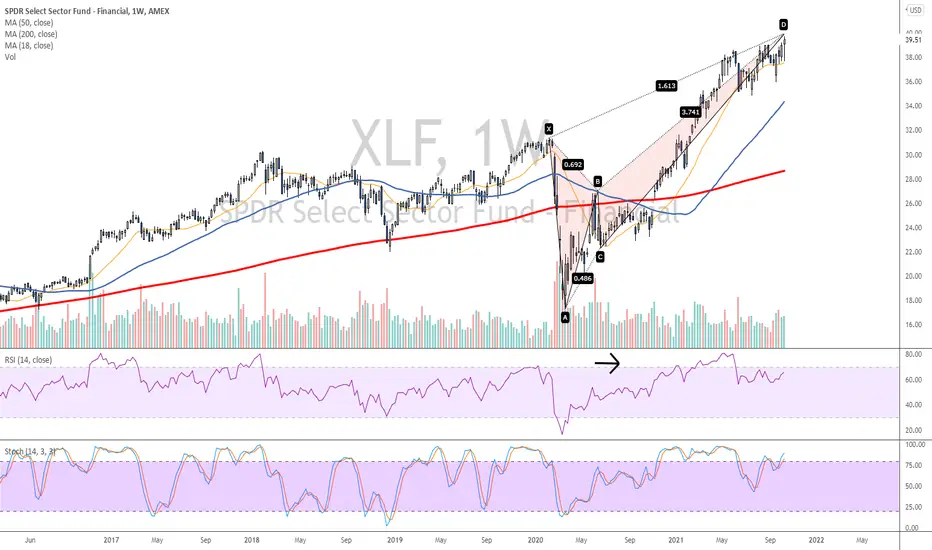
Weekly Harmonic PatternAn interesting pattern has developed in recent weeks... The reversal pattern was triggered last week following Banks Earnings.
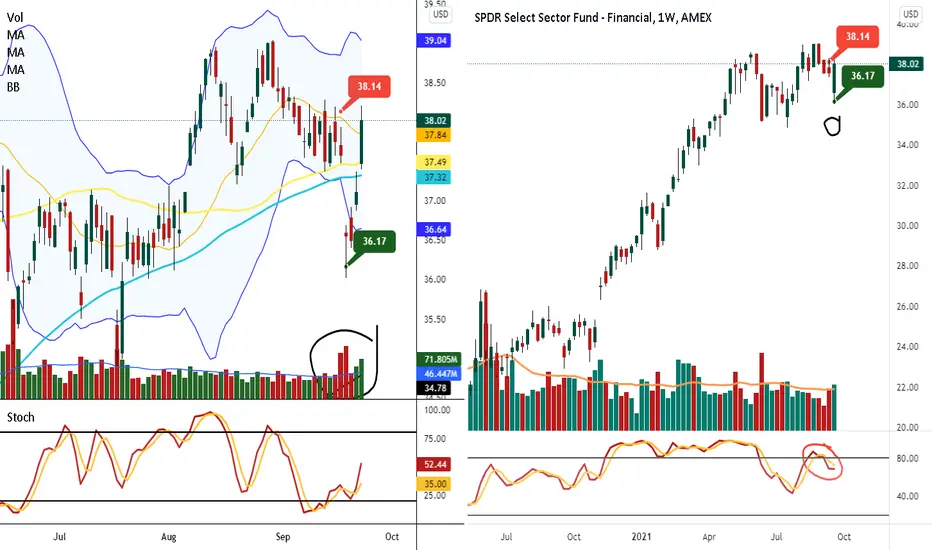
XLF STAYING SHORT @ 38.14Daily stoch heading up snap back short covering. Look VOL and lower highs
took some profits 36.17 5%, still short few shares
weekly rolling over.
Clear distribution last 5 monthsThis is a very simple and clean chart which shows the areas of distribution taken place. The red zones are generated by looking at the volume profile indicator. As you can see, those zones exactly correspond to choppy price action which is very typical of a distribution.
If you want to be bullish, I would at least wait till ~35 level which is approximately the 200d SMA. This would be ~10% correction from current levels
Don't buy into this week's earnings hype; its a trap.

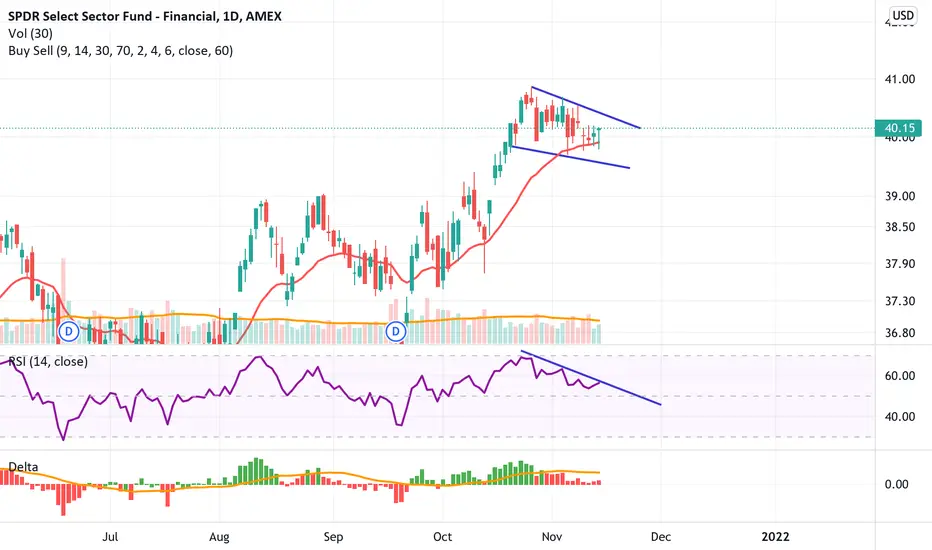
Long idea on XLFNice ascending triangle setup here, with bullish divergence . Stock is near ATH levels. LT trend is up. Always manage your risk

Long idea on XLFNice ascending triangle setup here, with bullish divergence. Stock is near ATH levels. LT trend is up. Always manage your risk

XLF STAYING SHORT @ 39.31Daily stoch rolled over. More selling buying
Weekly starting roll over again. Most important thing is TNX rally and XLF not breaking out that means bull run over. Bank earnings most likely already baked in as with all earnings imho. TNX keeps rising banks don't wow get ready we can wake up 1 morning 1000 points down keep going .

Will the banks move higher? XLF struggling at the top of the range . I notice the banks pulled back when XLF got rejected.. Banks have earnings next week so let's see if this makes new 52week highs
