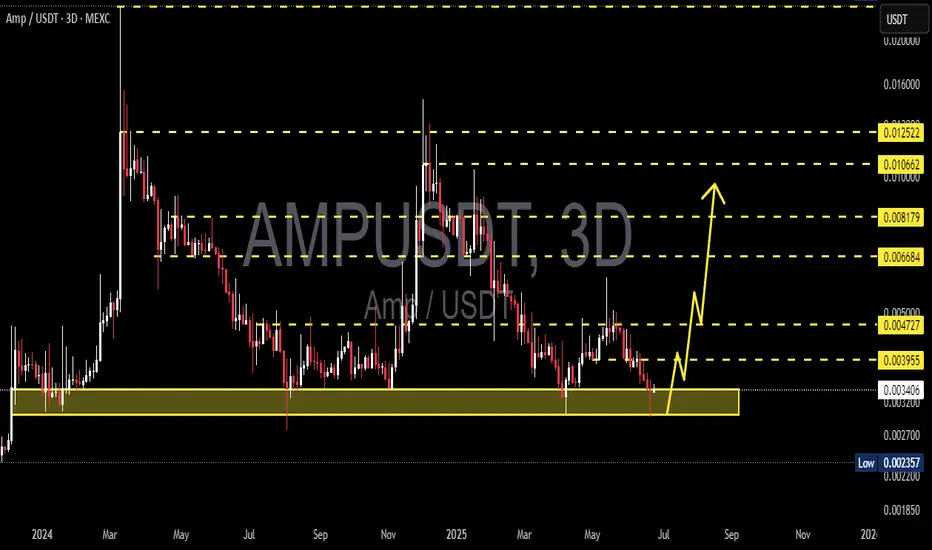
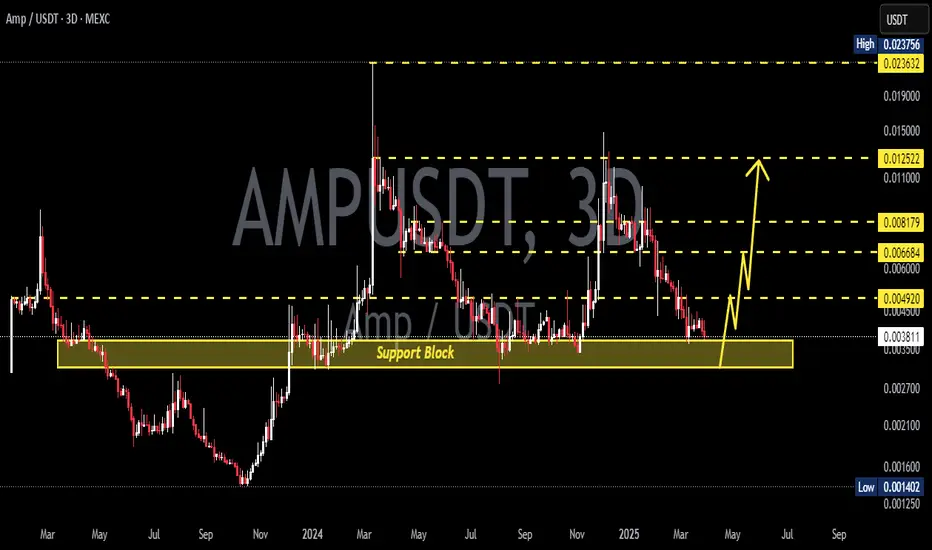
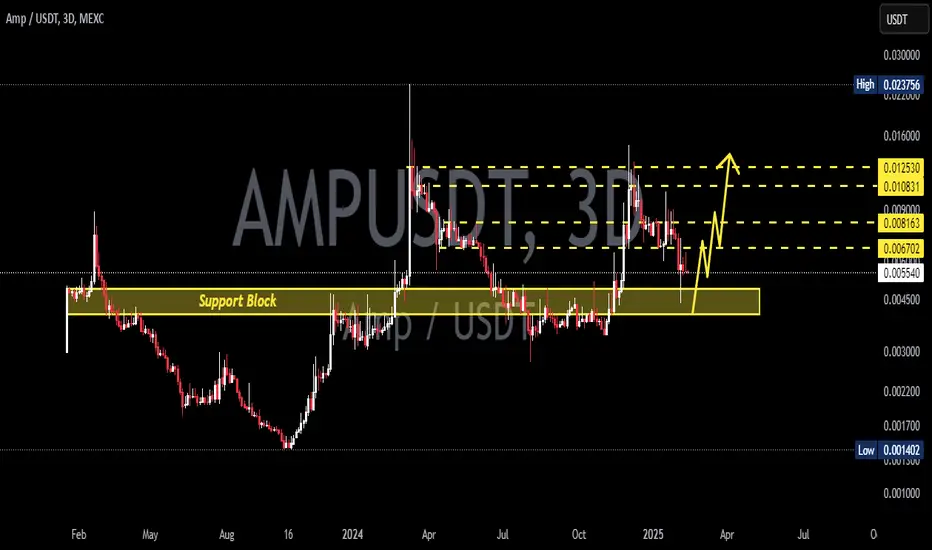
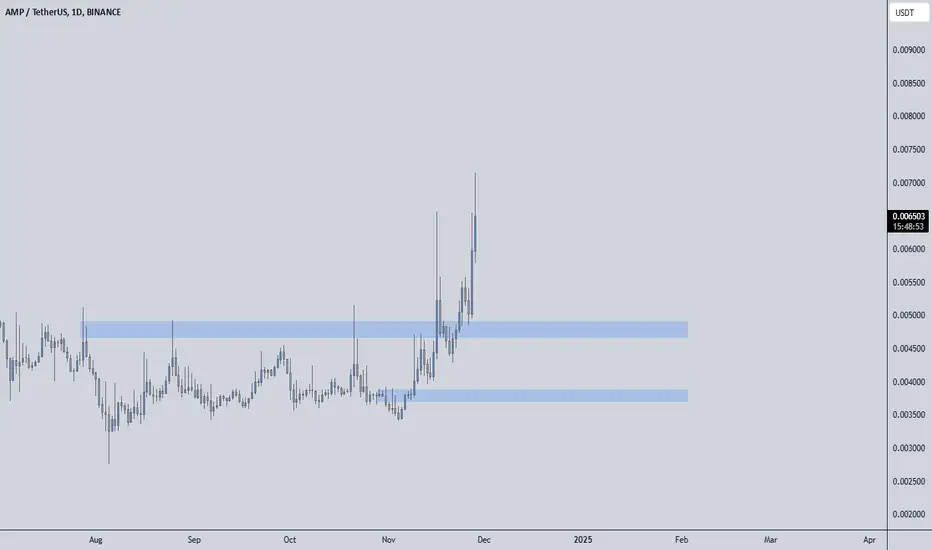
AMPUSDT 3D AnalysisAMP ~ 3D Analysis
#AMP Buy back gradually from here with a short term target of at least 15%+ from this support.
AMPUSDT trade ideas
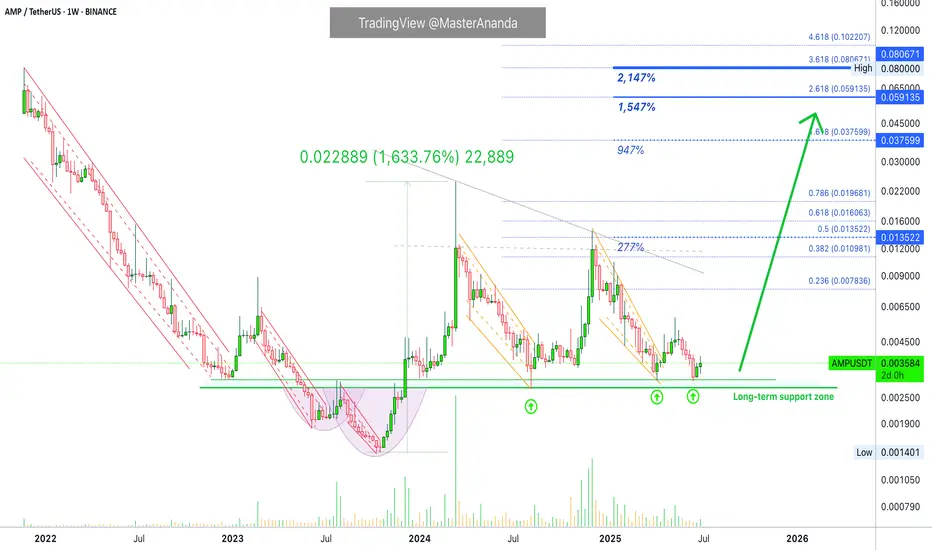
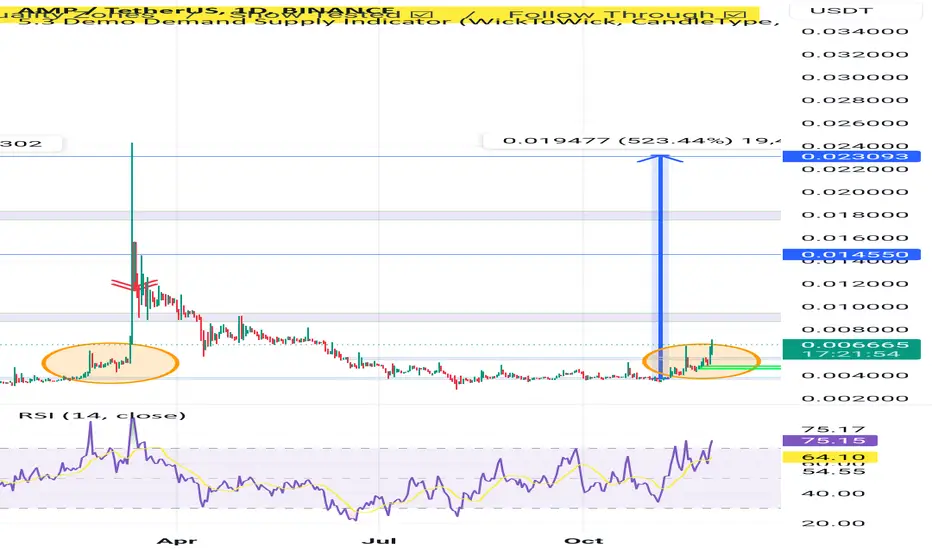
AMP Grew 1,634% in 2023; What About 2025? Follow My ReasoningBetween October 2023 and March 2024 AMPUSDT grew 1,634%. So you could say this move—the one that I am mapping—the next move, is a continuation of the previous cycle, right? Wrong.
It is not necessary. The long correction and consolidation period with a flat base nullifies the previous cycle. We are back to square one. We are at the baseline level. Anything that happens now can be considered new.
Instead of a continuation of a previous period, a new phase/cycle can develop. So growth potential is not limited to past actions or happenings, everything is possible based on current market conditions which are great and getting better with each passing day. Ok? I think we can agree so let's continue.
The last strong bullish wave gave us a taste of what is possible. It showed us that 17X is possible even when the market is in a transition period, the recovery year I dubbed it. That is, 2023. And it was the recovery year because the market recovered from its 2022 bear market bottom.
2025 bull market targets
My aim would be the one around 1,547%. I show higher targets because it can go higher. I show lower targets because different people approach the market in different ways. If you want to aim for the maximum and aim high, you have the high targets. Those that want to get paid short-term also have some targets on the chart. But I am always somewhere in-between the high and the low.
I normally like 1.618 and 2.618. It all depends on which peak I use to plot the Fibonacci extension tool. If we are looking at projections based on the last wave, then the 1.618 is pretty standard and easy to hit, so we can aim even higher.
If we are looking at the last bull market, then going beyond 1.618 might be too optimistic.
I keep saying that it can go higher but truly, it is always the same. The biggest difference is due to inflammation, everything grows in a controlled way because it is not a crazy market, it is very well organized, everything is calculated so that the market can continue to grow and evolve long-term.
There is something for the serious, for the slow, for the fast, for the greedy, for the humble, for the grateful, for the ungrateful, for the egoist and for the spiritualist. There is a little bit of everything for everybody. That's Cryptocurrency for you. It is censorship proof.
They continue to attack us, to censor us and to block us on all fronts, but they have not found a way to block our Bitcoins... Uhhh. It is working just as intended. Peer to peer electronic cash, no middleman, no intermediary. The future of finance. Money for the age of the Internet.
Thanks a lot for your support.
Namaste.
AMPUSDT 1D AnalysisAMP ~ 1D Analysis
#AMP This trade is very high risk
Buy gradually after successfully breaking through this resistance line with a short-term target of at least 10%++
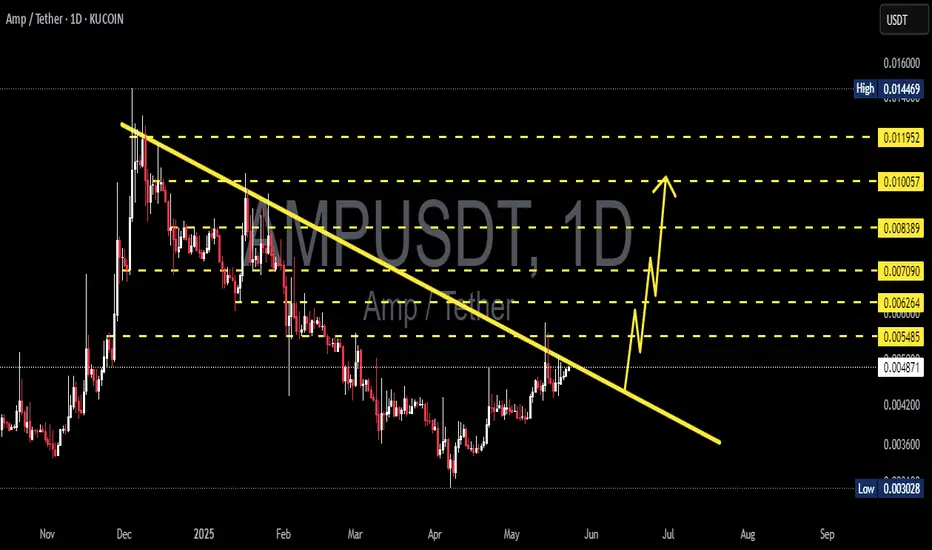
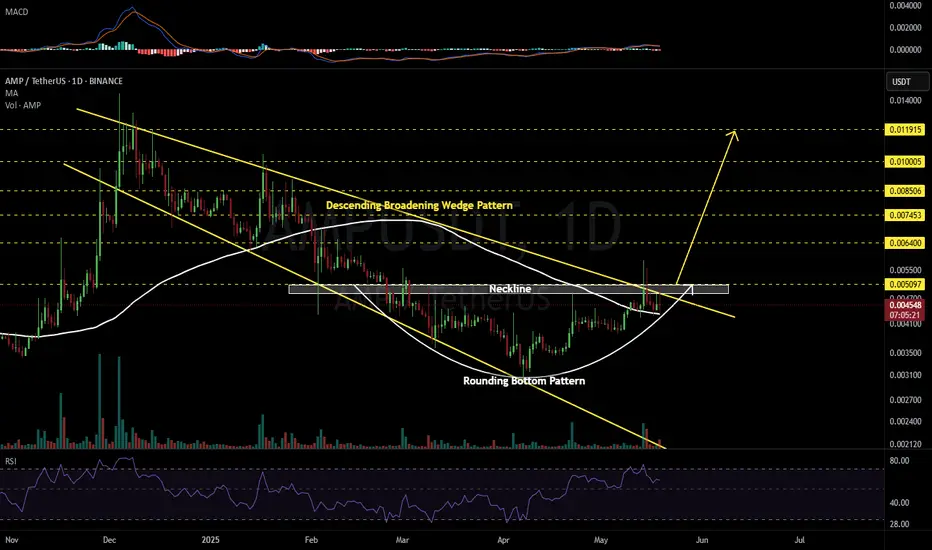
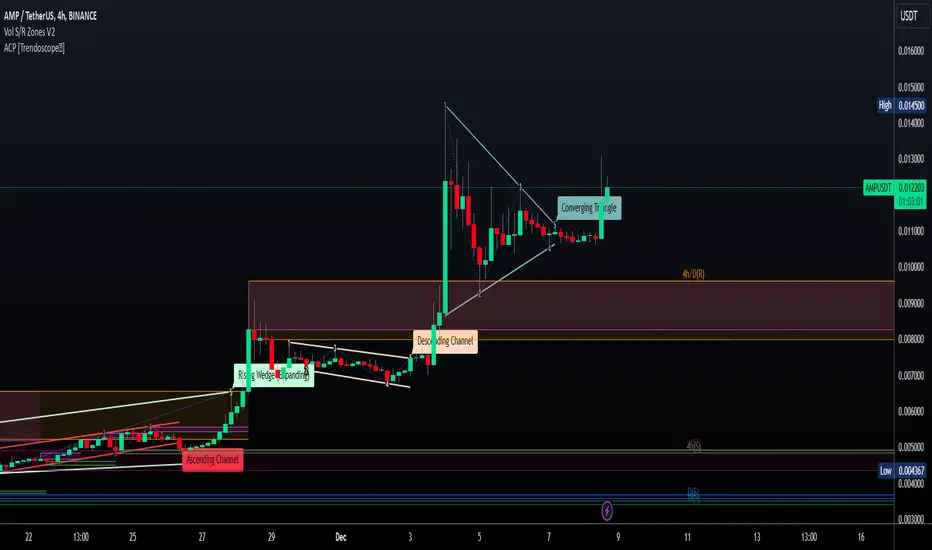
AMPUSDT 1D#AMP is moving inside a Descending Broadening Wedge and also forming a Rounding Bottom Pattern on the daily chart. Currently, it is holding above the daily MA100. In case of a breakout above the neckline of the rounding bottom pattern and the descending resistance, the targets are:
🎯 $0.006400
🎯 $0.007453
🎯 $0.008506
🎯 $0.010005
🎯 $0.011915
⚠️ Use a tight stop-loss.
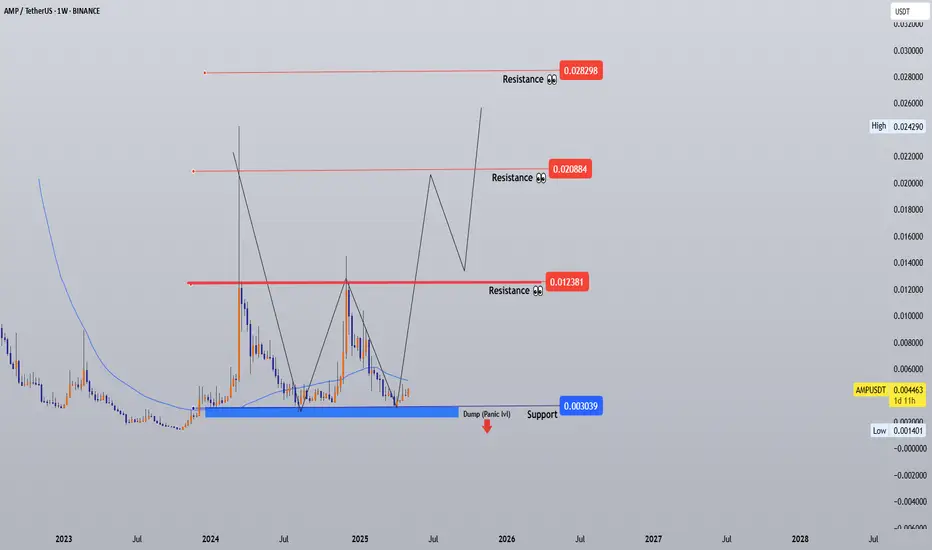
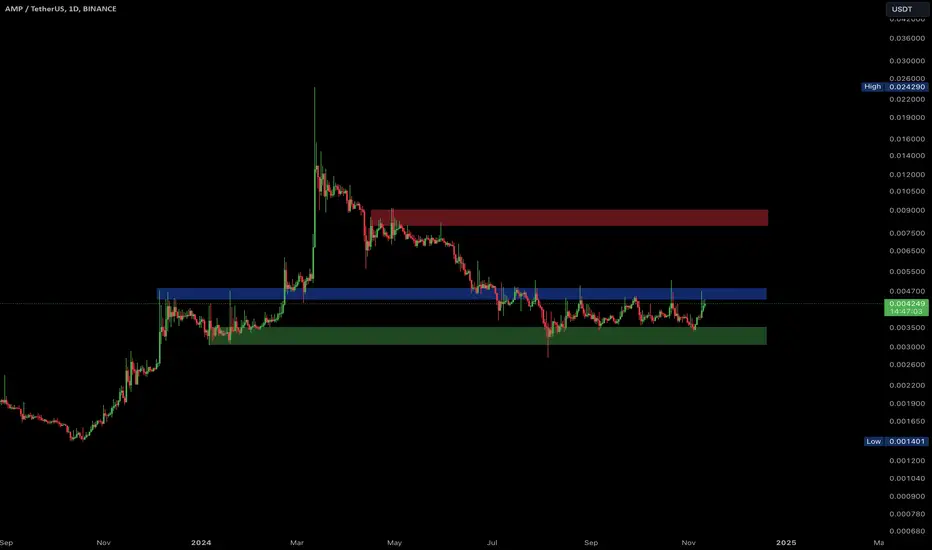
#AMPUSDT Weekly Analysis — Preparing for Macro Wave Recovery?⚡️ #AMPUSDT Weekly Analysis — Preparing for Macro Wave Recovery?
🗓 Published: May 10, 2025
📊 Timeframe: 1W | Exchange: Binance
🔍 Market Structure Overview
AMP is currently retesting its long-term base zone near $0.003, which has held multiple times over the past two years. The structure is now suggesting a potential double bottom forming, with higher timeframe breakout setups aligning into 2026.
📌 Formation:
✅ W-reversal structure forming
✅ Base reclaim with bounce from key demand zone
✅ Higher lows vs. 2023 bottom
✅ 200 MA curling upward slowly
🟦 Support Zone:
Main Support / $0.003039
Buy Area: 0.0044-0.0038
Panic Level: Close below this support could trigger a drop to the low of $0.0014
🔻 Breakdown below = structural invalidation
🎯 Upside Resistance Targets:
TP1: $0.012381 – Mid-range recovery level
TP2: $0.020884 – Major multi-year resistance
TP3: $0.028298 – Full breakout extension target
📈 These zones mark potential profit-taking levels across the expected multi-leg structure shown on chart
🧠 Strategy Insight
• AMP is sitting at a high-confluence support with a tight invalidation
• DCA or range entries here = favorable R:R
💡 Market patience is key. If BTC stabilizes, AMP is technically ready for a mid-cycle breakout leg
🗣 What’s Next?
Watch for weekly close above $0.006–$0.007 = W-pattern ignition
Break above $0.012 confirms trend change
Panic below $0.003 = exit, reassess lower structure
📢 AMP may be writing its next major leg. The base is in — now the market just needs to believe.
we ask Allah reconcile and repay
#AMP/USDT Trade Setup 200% Profit rally expected.AMP (Flexa) is a digital collateral token designed to provide instant, verifiable transactions on blockchain networks. It's widely used in the Flexa payment network, enabling payments with cryptocurrencies like Bitcoin and Ethereum. AMP acts as collateral to ensure the security of transactions and enhance speed. With its increasing adoption in crypto payments, AMP has solidified its place as an essential utility token.
AMP/USDT Trade Setup
Entry Point: 0.00398 to .4400
Stop Loss (SL): 0.003628
Target: 50% to 200% on Spot.
I will post the futures chart in LTF below this post with the updated idea.
The AMP token shows bullish momentum after a period of consolidation in a descending wedge. This setup suggests a potential breakout, with price moving toward the upper target zone.
Chart Analysis:
- The price has recently bounced off key support levels, signalling a potential reversal.
- A strong increase in volume supports the upward price action.
Disclaimer: Always perform your own research (DYOR) and trade responsibly. The content here does not constitute financial advice.
Do hit the like button if you like it, and share your views in the comments.
Thank you
#PEACE

AMPUSDT 1WAMP ~ 1W Analysis
#AMP Buy gradually from here if you still have a Conviction on this Coin. This is support that holds prices not to fall even lower.
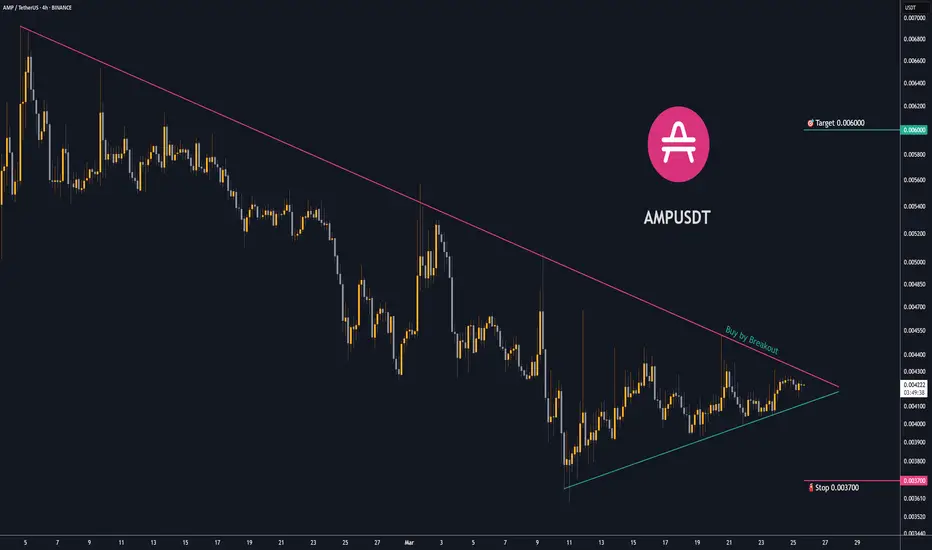
Trading opportunity for AMP AMPUSDTBased on technical factors there is a Buy position in :
📊 AMPUSDT
🔵 Buy Now or by Breakout
🪫Stop loss 0.003700
🔋Target 0.006000
📏 R/R 3,5
💸RISK : 1%
We hope it is profitable for you ❤️
Please support our activity with your likes👍 and comments📝
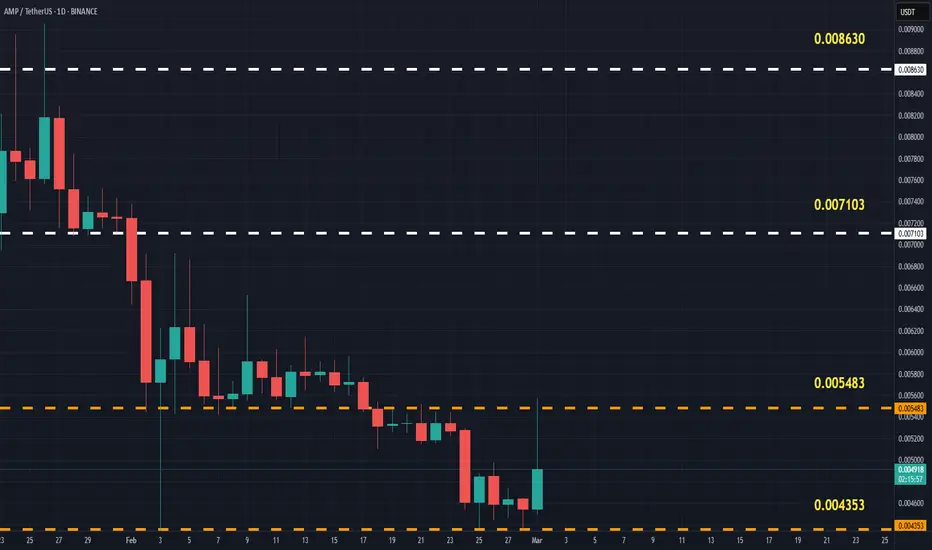
AMPUSDT(Amp) Updated till 01-03-25AMPUSDT(Amp) Daily timeframe range. PA tried to get out of 0.005483 need little bit more volume here for that. it got long way to go. if PA can stay above 0.004353 breaking its recent resistance wont be a problem.
AMPUSDT 3DAMP ~ 3D Analysis
#AMP If you still have a Conviction on this Coin, Maybe this support is very good to start buying. Short -term target 20%+
AMPUSDT %400 DAILY VOLUME INCREASE!Massive Volume Spike and Promising Buy Zones
A remarkable 400% volume increase combined with a significant rise in buyer activity makes this setup very appealing.
Highlights:
Volume Surge: A 400% daily increase signals strong market interest and potential for a solid move.
Buyer Activity: Noticeable growth in buyer presence, confirmed by CDV and other indicators.
Entry Zones: The blue box and areas below the green line are excellent levels to consider for entries.
Key Observations:
"The blue box is very carefully picked using volume footprint, volume profile, cumulative delta volume, and liquidity heatmap. When trading this zone, I will look for buyers and upward market structure breaks in lower time frames for confirmation."
This is a high-probability opportunity backed by strong metrics. Let’s monitor these zones and wait for confirmation. 🚀
Let me tell you, this is something special. These insights, these setups—they’re not just good; they’re game-changers. I've spent years refining my approach, and the results speak for themselves. People are always asking, "How do you spot these opportunities?" It’s simple: experience, clarity, and a focus on high-probability moves.
Want to know how I use heatmaps, cumulative volume delta, and volume footprint techniques to find demand zones with precision? I’m happy to share—just send me a message. No cost, no catch. I believe in helping people make smarter decisions.
Here are some of my recent analyses. Each one highlights key opportunities:
🚀 RENDERUSDT: Strategic Support Zones at the Blue Boxes +%45 Reaction
🎯 PUNDIXUSDT: Huge Opportunity | 250% Volume Spike - %60 Reaction Sniper Entry
🌐 CryptoMarkets TOTAL2: Support Zone
🚀 GMTUSDT: %35 FAST REJECTION FROM THE RED BOX
🎯 ZENUSDT.P: Patience & Profitability | %230 Reaction from the Sniper Entry
🎯 DEXEUSDT %180 Reaction with %9 Stop
🐶 DOGEUSDT.P: Next Move
🎨 RENDERUSDT.P: Opportunity of the Month
💎 ETHUSDT.P: Where to Retrace
🟢 BNBUSDT.P: Potential Surge
📊 BTC Dominance: Reaction Zone
🌊 WAVESUSDT.P: Demand Zone Potential
🟣 UNIUSDT.P: Long-Term Trade
🔵 XRPUSDT.P: Entry Zones
🔗 LINKUSDT.P: Follow The River
📈 BTCUSDT.P: Two Key Demand Zones
🟩 POLUSDT: Bullish Momentum
🌟 PENDLEUSDT.P: Where Opportunity Meets Precision
🔥 BTCUSDT.P: Liquidation of Highly Leveraged Longs
🌊 SOLUSDT.P: SOL's Dip - Your Opportunity
🐸 1000PEPEUSDT.P: Prime Bounce Zone Unlocked
🚀 ETHUSDT.P: Set to Explode - Don't Miss This Game Changer
🤖 IQUSDT: Smart Plan
⚡️ PONDUSDT: A Trade Not Taken Is Better Than a Losing One
💼 STMXUSDT: 2 Buying Areas
🐢 TURBOUSDT: Buy Zones and Buyer Presence
🌍 ICPUSDT.P: Massive Upside Potential | Check the Trade Update For Seeing Results
🟠 IDEXUSDT: Spot Buy Area | %26 Profit if You Trade with MSB
📌 USUALUSDT: Buyers Are Active + %70 Profit in Total
🌟 FORTHUSDT: Sniper Entry +%26 Reaction
🐳 QKCUSDT: Sniper Entry +%57 Reaction
📊 BTC.D: Retest of Key Area Highly Likely
This list? It’s just a small piece of what I’ve been working on. There’s so much more. Go check my profile, see the results for yourself. My goal is simple: provide value and help you win. If you’ve got questions, I’ve got answers. Let’s get to work!

AMP Token spot challengeAmp token broken the daily TF diagonal resistance with a successful retest.
1H close looking good, primed for reaching the previous daily high.
Looking forward to close the trade at the red line.

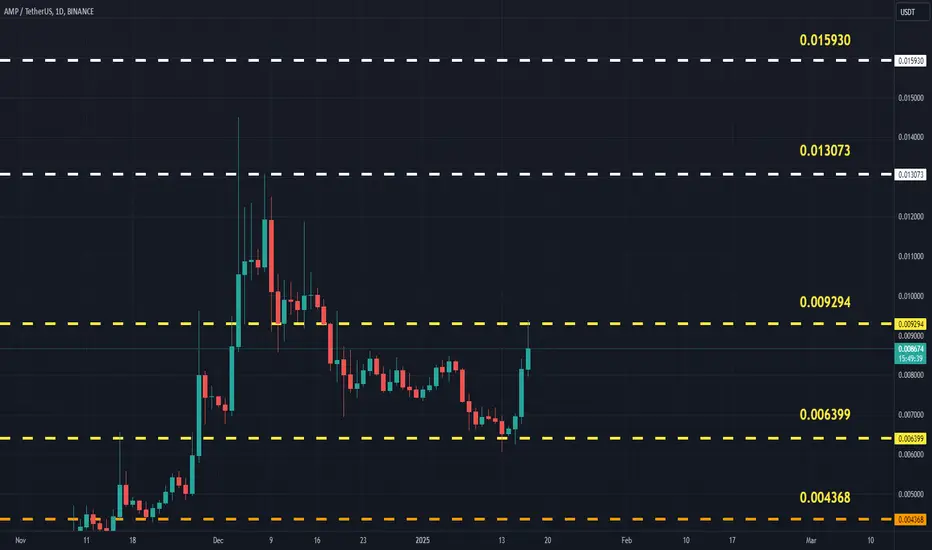
AMPUSDT (Amp) Updated till 17-01-25AMPUSDT (Amp) Daily timeframe range. another alt trying for a retrace back. market still needs fuel. a valid close above 0.009294 can push it to 0.013073. as long PA can stay above 0.006399 it got chances. local support at 0.006399.
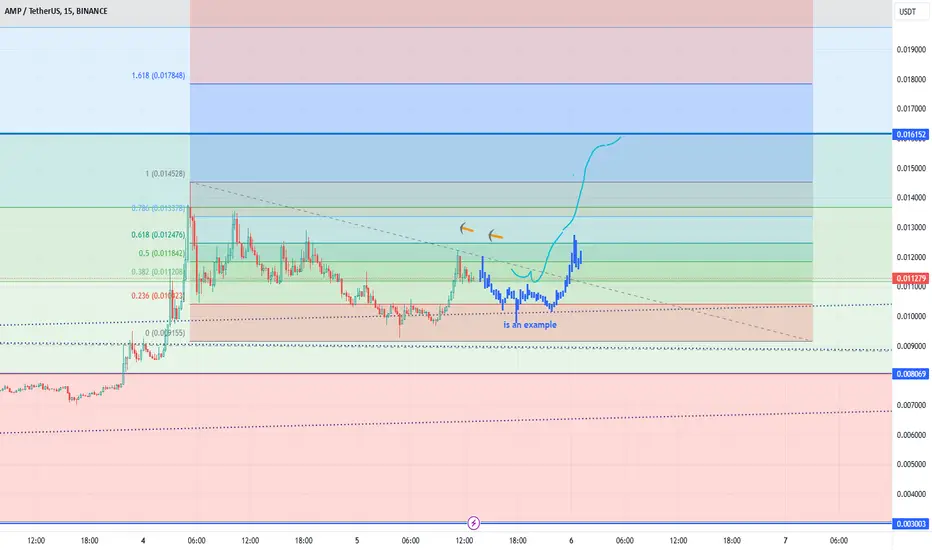
AMP/USDT 15 MİN UPDATE
Fibonacci Levels: The chart shows Fibonacci retracement levels (0.236, 0.382, 0.5, 0.618, etc.), which often act as support and resistance zones for price movement.
Price Movements:
Current price is around 0.01130.
Resistance is observed just below the 0.382 level (0.01135).
Expected Movement:
The blue line indicates a potential upward price movement. The first target aligns with the 0.618 Fibonacci level (around 0.01400).
Support and Resistance:
Support: 0.01100 level.
Resistance: 0.01135, followed by 0.01400.
Volume and Momentum:
It's crucial to monitor volume and price response. If volume supports, the upward move might sustain.
Game-Changing Insights for AMPUSDT: Act Before It’s Too Late ...◳◱ On the BINANCE:AMPUSDT chart, the Bband Breakout pattern suggests an upcoming trend shift. Traders might observe resistance around 0.009632 | 0.012011 | 0.016777 and support near 0.004866 | 0.002479. Entering trades at 0.012149 could be strategic, aiming for the next resistance level.
◰◲ General Information :
▣ Name: Amp
▣ Rank: 144
▣ Exchanges: Binance, Kucoin, Huobipro, Gateio, Mexc, Hitbtc
▣ Category / Sector: Financial - Payment Platforms
▣ Overview: On July 21, 2022, the SEC stated that AMP is a "crypto asset security". Note: (1) Messari does not provide financial or trading advice - our services are for informational purposes only; and (2) Messari's services are impersonal - do your own due diligence. Please refer to our Terms of Use for more info.
Amp is a digital collateral token that offers instant, verifiable collateralization for any kind of value transfer. Projects like Flexa use Amp to secure transactions and build networks that accrue value both securely and transparently.
◰◲ Technical Metrics :
▣ Current Price: 0.012149 ₮
▣ 24H Volume: 43,041,485.408 ₮
▣ 24H Change: 12.47%
▣ Weekly Change: 66.26%%
▣ Monthly Change: 220.43%%
▣ Quarterly Change: 235.04%%
◲◰ Pivot Points :
▣ Resistance Level: 0.009632 | 0.012011 | 0.016777
▣ Support Level: 0.004866 | 0.002479
◱◳ Indicator Recommendations :
▣ Oscillators: NEUTRAL
▣ Moving Averages: STRONG_BUY
◰◲ Summary of Technical Indicators : BUY
◲◰ Sharpe Ratios :
▣ Last 30 Days: 7.66
▣ Last 90 Days: 4.17
▣ Last Year: 1.35
▣ Last 3 Years: -0.04
◲◰ Volatility Analysis :
▣ Last 30 Days: 1.82
▣ Last 90 Days: 1.20
▣ Last Year: 1.38
▣ Last 3 Years: 1.07
◳◰ Market Sentiment :
▣ News Sentiment: N/A
▣ Twitter Sentiment: N/A
▣ Reddit Sentiment: N/A
▣ In-depth BINANCE:AMPUSDT analysis available at TradingView TA Page
▣ Your thoughts matter! What do you think of this analysis? Share your insights in the comments below. Your like, follow, and support are greatly valued and help sustain high-quality content.
◲ Disclaimer : Disclaimer
The content provided is for informational purposes only and does not constitute financial, investment, or trading advice. Always conduct your own research and consult a qualified professional before making any financial decisions. Use of the information is solely at your own risk.
▣ Explore the Power of Charting with TradingView
Unlock a wide range of financial analysis tools, data, and features to elevate your trading experience. Take a tour and see the possibilities. If you decide to upgrade your plan, you can receive up to $30 back. Discover more here - affiliate link -
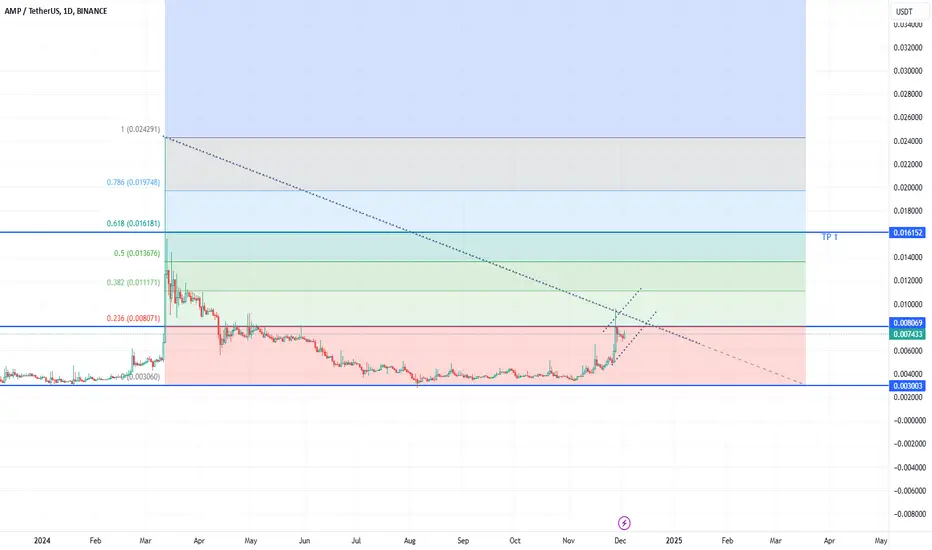
AMP/USDTKey Observations:
Fibonacci Retracement Levels:
The 0.236 (0.008077), 0.382 (0.010161), 0.5 (0.011948), and 0.618 (0.013730) levels are visible on the chart. These are critical areas where the price may face resistance or find support.
The 0.236 level currently acts as the closest resistance. The price seems to be approaching this zone.
Trend Direction:
The overall trend appears to be recovering after a long-term downtrend.
There is a visible diagonal resistance (trendline) that has been drawn. This line might signal an area where the price could face selling pressure.
Key Levels to Watch:
Support Zone: Around 0.007 or slightly below. If the price falls, this level may provide support.
Resistance Zone: 0.00807 (Fibonacci 0.236 level) is the first major resistance. A breakout above this level could see the price aiming for 0.01016 (Fibonacci 0.382 level).
Volume and Momentum:
Volume seems low relative to previous spikes, which might indicate consolidation before a significant move.
If volume increases near resistance zones, a breakout becomes more likely.
TP1 Level:
A target price (TP1) is marked near 0.016181. This suggests a potential bullish scenario if the price continues climbing.
Possible Scenarios:
Bullish Scenario:
A breakout above 0.008077 with strong volume could drive the price toward 0.01016 and potentially 0.01194.
If the diagonal trendline resistance is also breached, the recovery trend could strengthen further.
Bearish Scenario:
If the price fails to break 0.008077, it may retrace back to 0.007 or even lower.
A break below the support zone could signal further downside, targeting lower Fibonacci extensions.
Suggestions:
For Long Positions: Wait for a clear breakout above 0.008077 with strong volume confirmation.
For Short Positions: Look for rejection near the 0.008077 resistance or a breakdown below the 0.007 support.
Monitor momentum indicators like RSI or MACD to confirm potential reversals or continuation signals.
AMPUSDTWe can attempt to short AMPUSDT from specified level as it makes HL , also 0.618 FIB level intact indicate that it moves upward.
SL , TP mention in chart
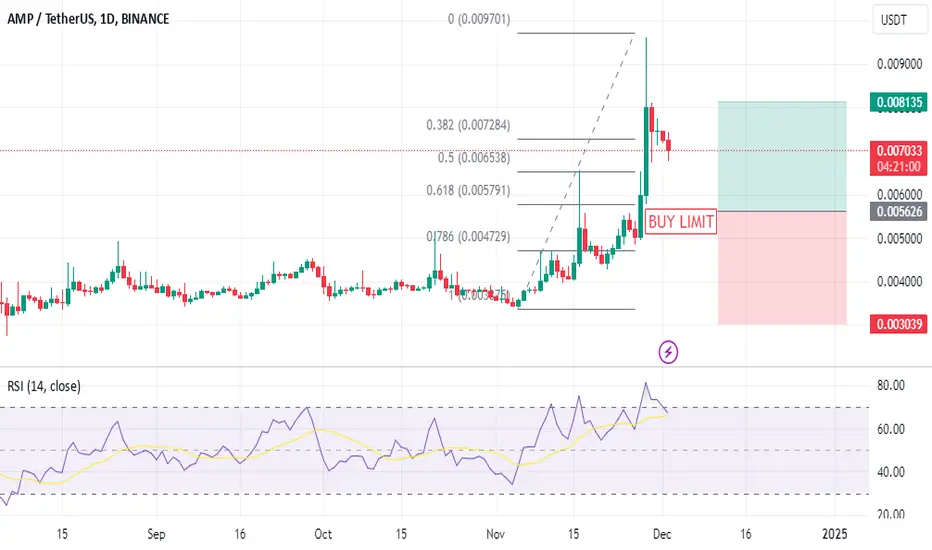
AMPUSDT (Amp) Updated till 28-11-24AMPUSDT (Amp) Daily timeframe range. its having quite a nice run. but its a high risk and reward alt. it got huge free space to cover but there is chance of getting wicked out. 0.008687 resistance holding if it gets cleared out it can push further.
AMP UpdateAMP has finally reached the supply zone after a massive rally of over 100%. This is a critical level where selling pressure is expected. It's a good opportunity to secure your profits and wait for the next setup. Always trade with discipline and proper risk management! 🚀

AMP | Where to Join ?There is no need to be fomo, the parity has a characteristic that can provide good transaction opportunities. I want to be involved with the down pin in the order flow because you see the pins, ordering the blue boxes makes sense for now.
I don't overcomplicate things and add a ton of dirty crap to my charts, but you can check out the success of my analysis below.
I approach trading with confidence backed by experience and past success in identifying high-probability setups.
While I don’t claim to be the best, my track record speaks for itself, and I strive to let my analysis and results do the talking. Watch these levels closely—markets can confirm what charts already whisper. Let’s see how this plays out together.
My Previous Ideas
DOGEUSDT.P | 4 Reward for 1 Risk much more if you hold it.
RENDERUSDT.P | HTF Accuracy
ETHUSDT.P | Accurate Buyer Zone Identification | High Risk Reward if you hold it.
BNBUSDT.P | Accurate Buyer Zone Identification | High Risk Reward if you hold it.
Bitcoin Dominance | Great Characteristic Detection and Accurate Analysis
Will this sentiment and breakout repeat?The chart indicates a breakout from a long consolidation phase, suggesting a potential explosive move.
The marked circles highlight areas of significant accumulation and breakout points
AMP/USDT Consolidation Breakout Potential AMP has been consolidating within a tight range, forming strong support and resistance zones. Currently, it’s trading near a critical level, with a potential breakout in either direction.
Key zones to monitor:
Red Zone: This upper resistance zone around the $0.009 level could act as a major barrier. A breakout above this could lead to substantial upward movement.
Blue Zone: This area is a crucial pivot, marking the current trading range. If AMP flips this zone into a support, it could act as a foundation for a bullish trend.
Green Zone: A strong support zone around $0.003, providing a lower boundary in case of a pullback.
With AMP trading at the upper range of the consolidation zone, it’s crucial to watch for confirmation of a breakout or rejection. Volume and momentum will be key indicators to assess the strength of the move.
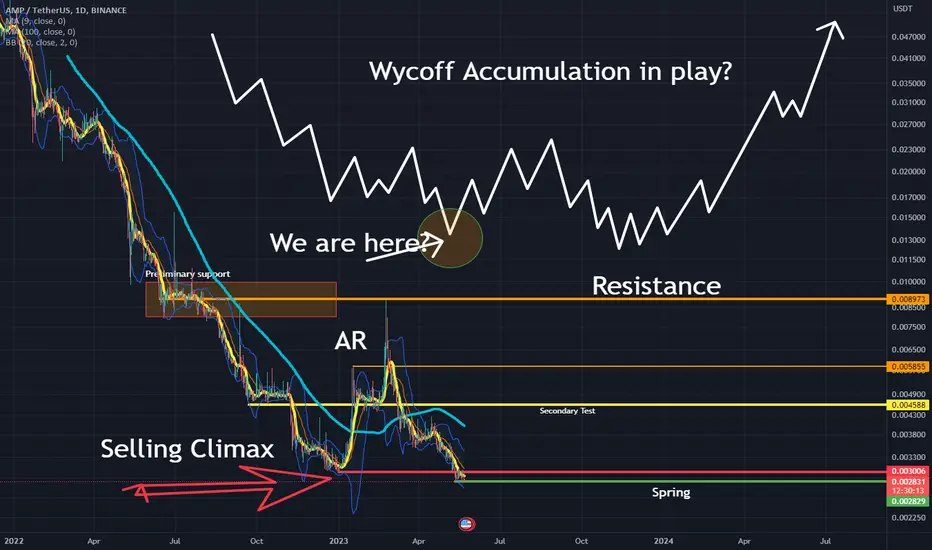
Looks like Wycoff?It looks to me like early Wycoff spring phase? if it drops significantly more will have to review my idea. Please comment what are your thoughts on this?