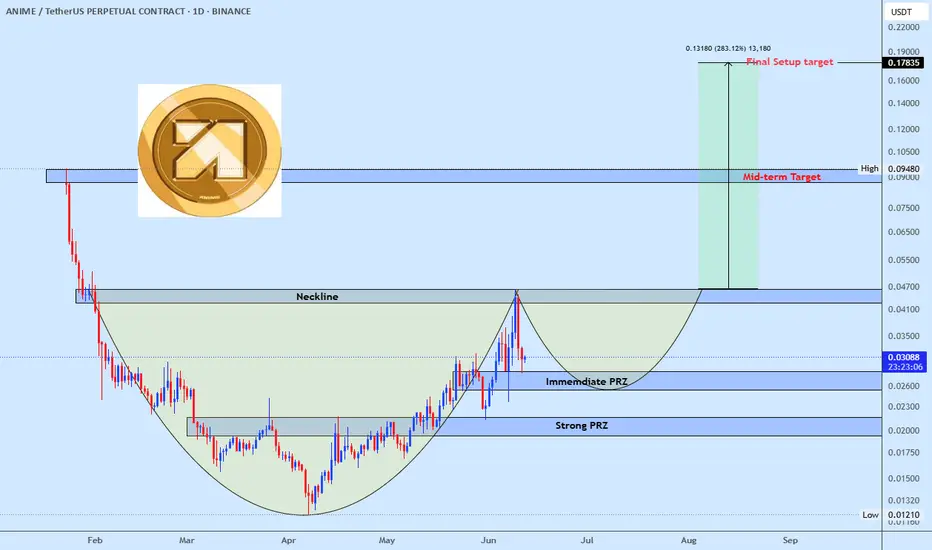
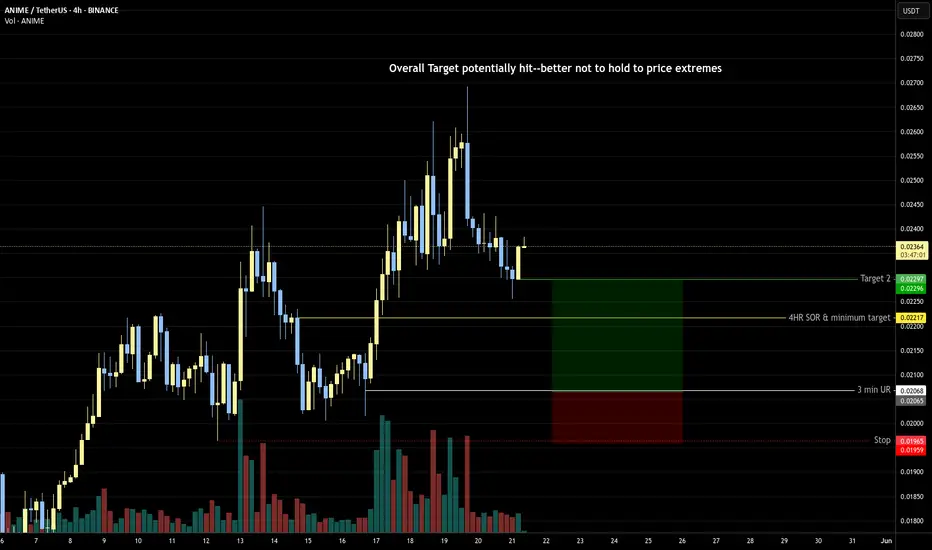
ANIMEUSDT Eyes Bullish Continuation Cup & Handle SetupANIMEUSDT is shaping a potential cup formation, with current price action working on the handle. Focus remains on the immediate and strong PRZs for potential buy entries. A breakout above the neckline will confirm the pattern and may trigger a strong upside rally toward the final target shown on the
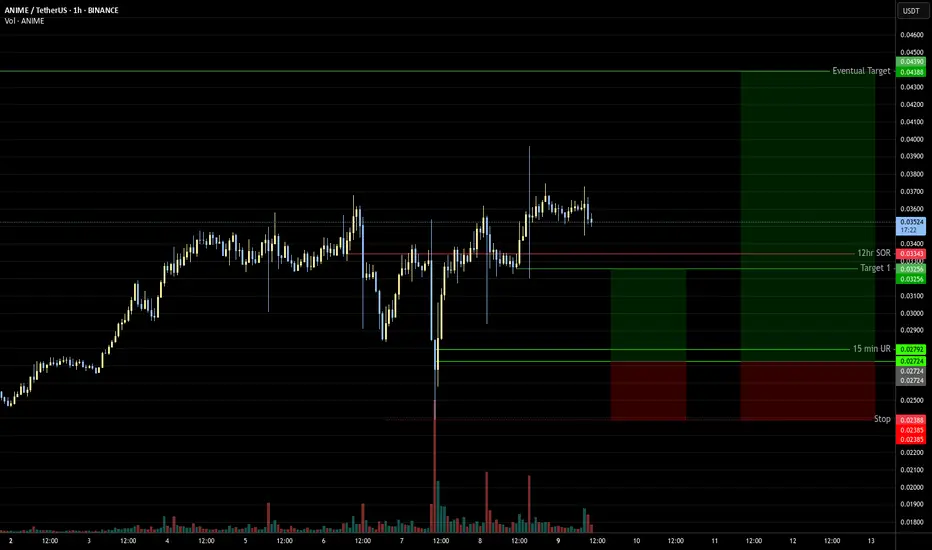
1.57 RRAnime seems to continue to be upward bound toward the indicated eventual target, a safe exit is shown for the 1.%7 RR, although one could potentially hold it higher for almost a 5 RR--or something in-between.
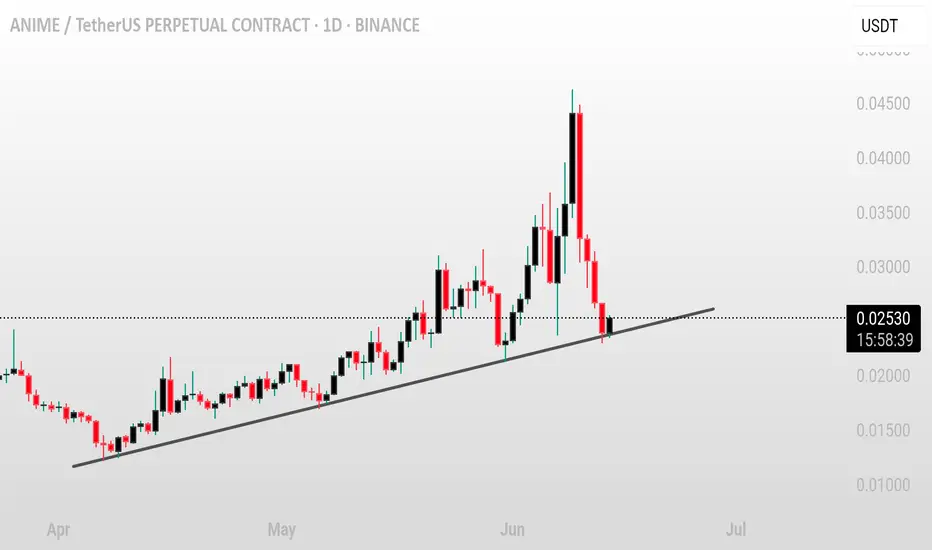
ANIME/USDT – Key Ascending Trendline Support Holding Pair: ANIME/USDT 💱
Timeframe: 1D 📅
Pattern: Ascending Trendline Test 📉
ANIME is currently testing a key ascending trendline on the daily chart. This structure has supported price action for weeks, and the current candle is sitting right at the trendline, suggesting a potential inflection point 🔍⚖️.
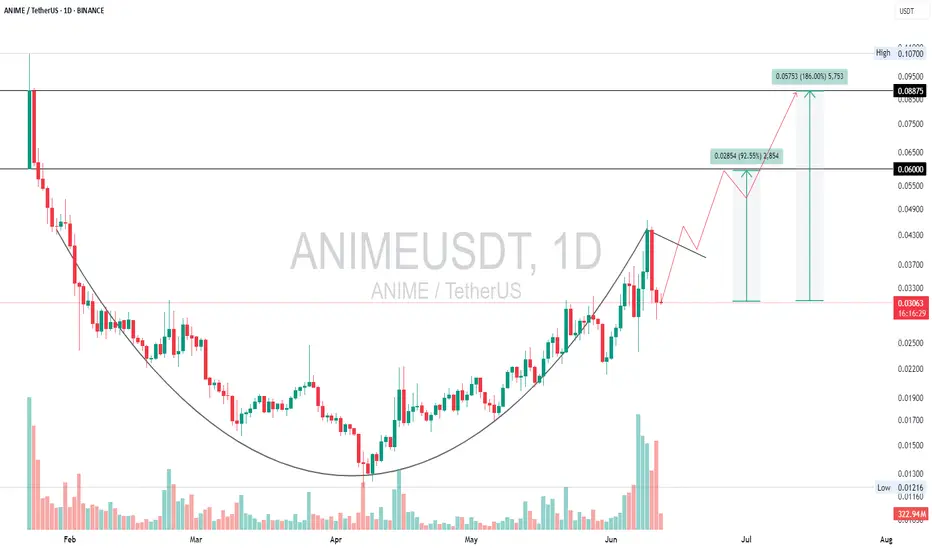
ANIME | Cup & Handle PatternANIME shows a classic cup and handle pattern, which is a bullish continuation signal. After a prolonged downtrend, the price formed a rounded bottom, indicating accumulation and a gradual shift from sellers to buyers. The handle portion appears to be forming as a slight consolidation or pullback, wh
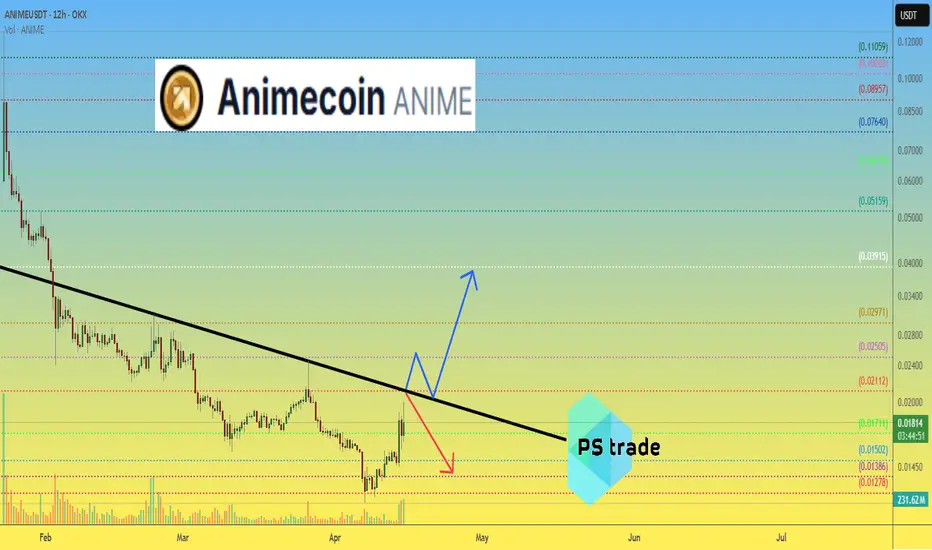
Animecoin ANIME price analysisThose who took part in the jumpstart should have some #Anime coins left over, which were distributed to participants.
In recent days, there has been an increase in OKX:ANIMEUSDT trading volumes, perhaps buyers are preparing to exit the downward trend.
🔴 The critical level is $0.021
1️⃣ A break
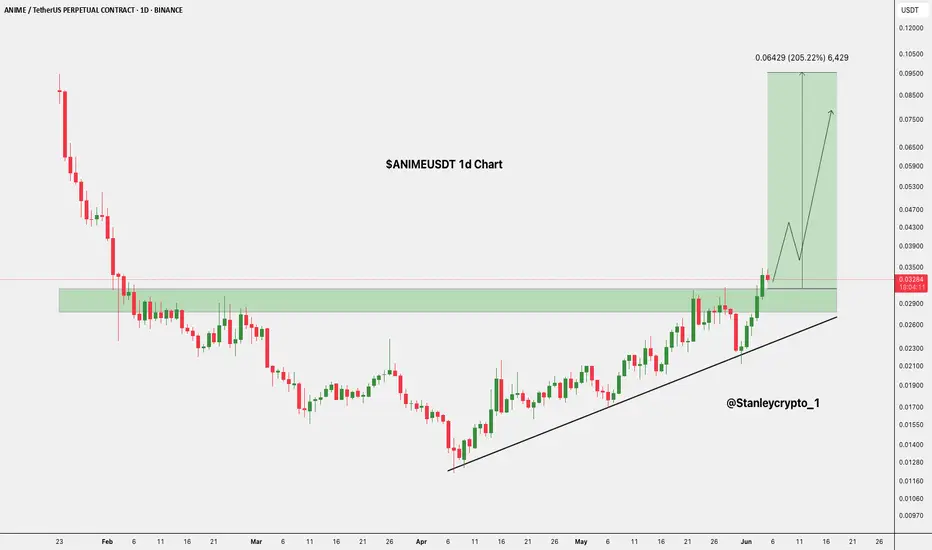
$ANIME Brreakout Ahead?- BINANCE:ANIMEUSDT is breaking out of a key resistance zone after weeks of higher lows.
- If this breakout holds, a move of 200% or more toward $0.09505 could be next.
- Watch for a retest. This could be the start of something big. 👀
DYRO, NFA
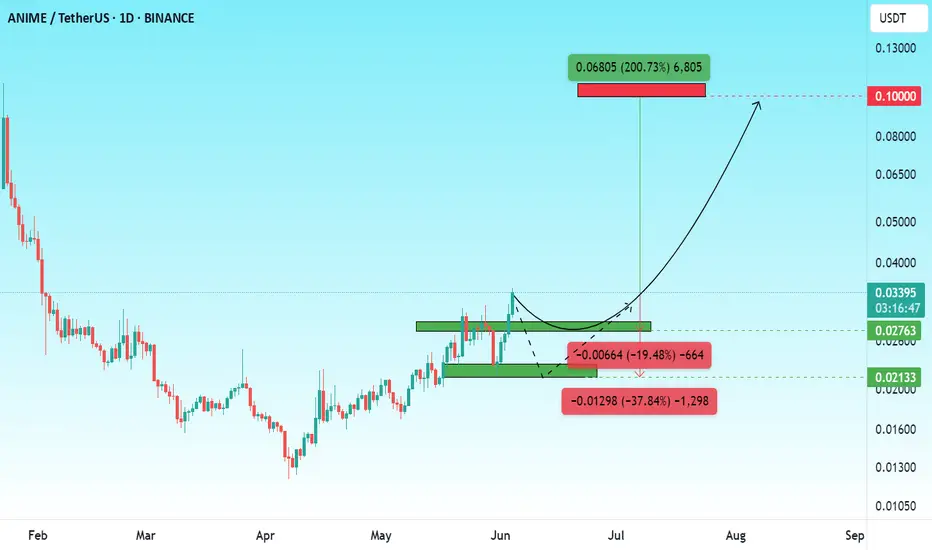
ANIME – Can It Reach $0.10? A 200% Rally Potential? ANIME – Can It Reach $0.10? A 200% Rally Potential?
The ANIME/USDT chart on the daily timeframe is showing signs of a potential strong upward movement, possibly up to $0.10, which would represent a 200% increase from the current price.
As shown in the chart:
A correction to the first support zon
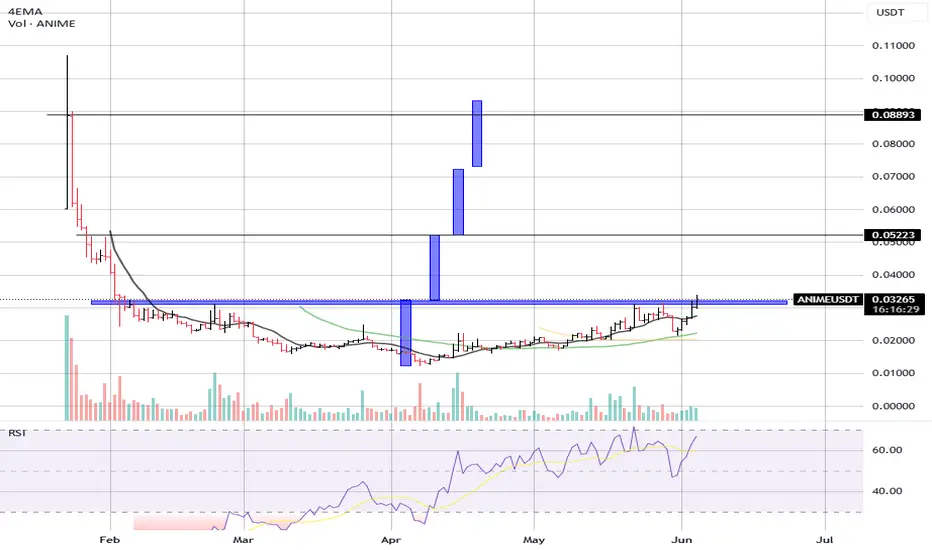
ANIME/USDT – Breakout Triggered After Long Accumulation
Date: June 4, 2025
ANIME/USDT has finally broken out of a key resistance zone that had capped price action for several months. The chart reveals a prolonged accumulation phase followed by a clear breakout, supported by rising volume.
📊 Technical Overview:
Current Price: $0.03233
Breakout Zone:
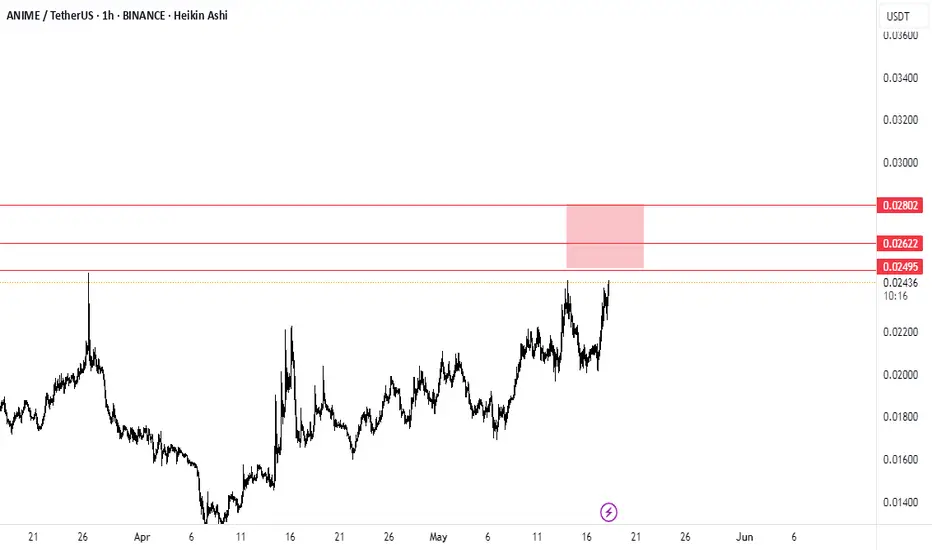
1.45/2.1 RR tradeIf price gets to the entry on the current down move, should be a nice trade. Yellow line should be the minimum target (1.45 RR), target 2 will change based on how the price action develops!
See all ideas
Summarizing what the indicators are suggesting.
Oscillators
Neutral
SellBuy
Strong sellStrong buy
Strong sellSellNeutralBuyStrong buy
Oscillators
Neutral
SellBuy
Strong sellStrong buy
Strong sellSellNeutralBuyStrong buy
Summary
Neutral
SellBuy
Strong sellStrong buy
Strong sellSellNeutralBuyStrong buy
Summary
Neutral
SellBuy
Strong sellStrong buy
Strong sellSellNeutralBuyStrong buy
Summary
Neutral
SellBuy
Strong sellStrong buy
Strong sellSellNeutralBuyStrong buy
Moving Averages
Neutral
SellBuy
Strong sellStrong buy
Strong sellSellNeutralBuyStrong buy
Moving Averages
Neutral
SellBuy
Strong sellStrong buy
Strong sellSellNeutralBuyStrong buy