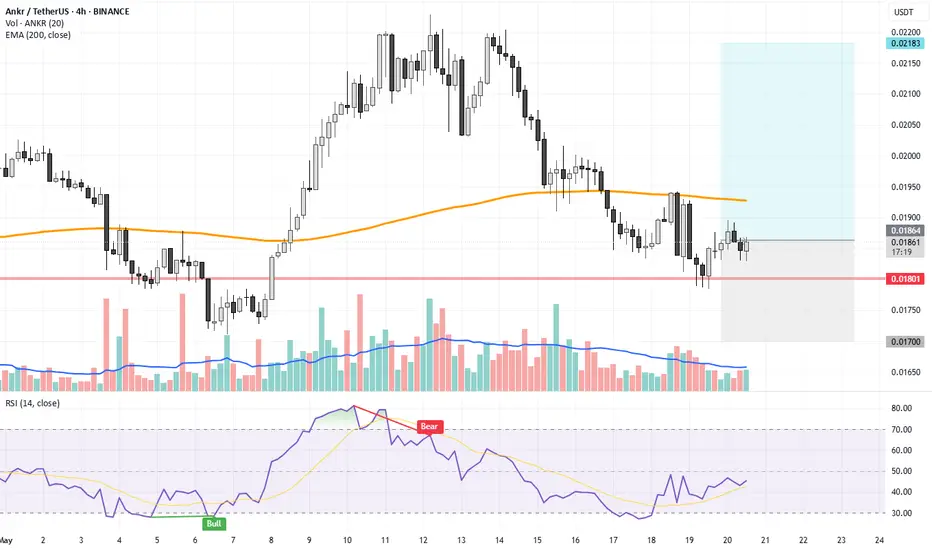
ANKR USDTCP 0.01863
Buy: 0.017 0.019
Sell: 0.0218
SL: 0.017
1x2 ratio
Strong project
Very low value
Only Spot Trading with STOP LOSS.
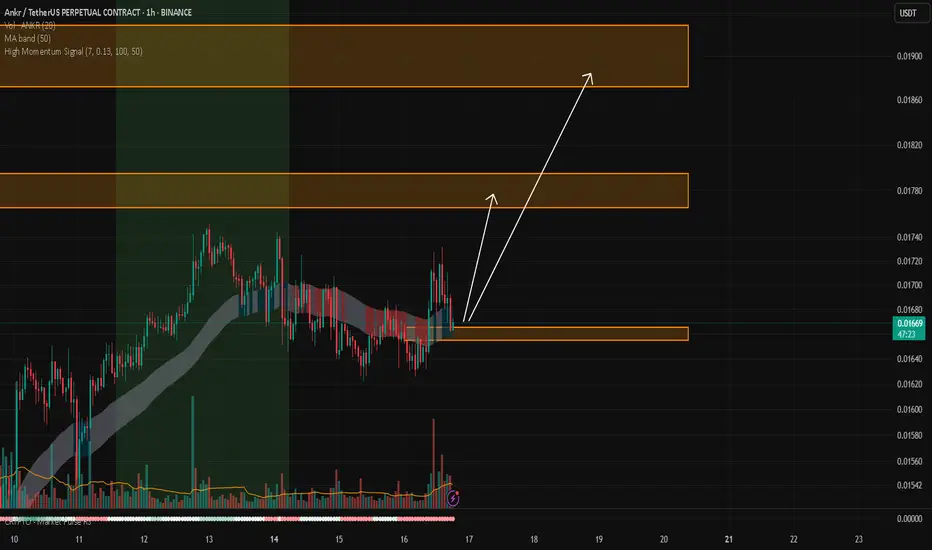
ANKR/USDTKey Level Zone: 0.01655 - 0.01665
HMT v8 detected. The setup looks promising, supported by a previous upward/downward trend with increasing volume and momentum, presenting an excellent reward-to-risk opportunity.
HMT (High Momentum Trending):
HMT is based on trend, momentum, volume, and market str
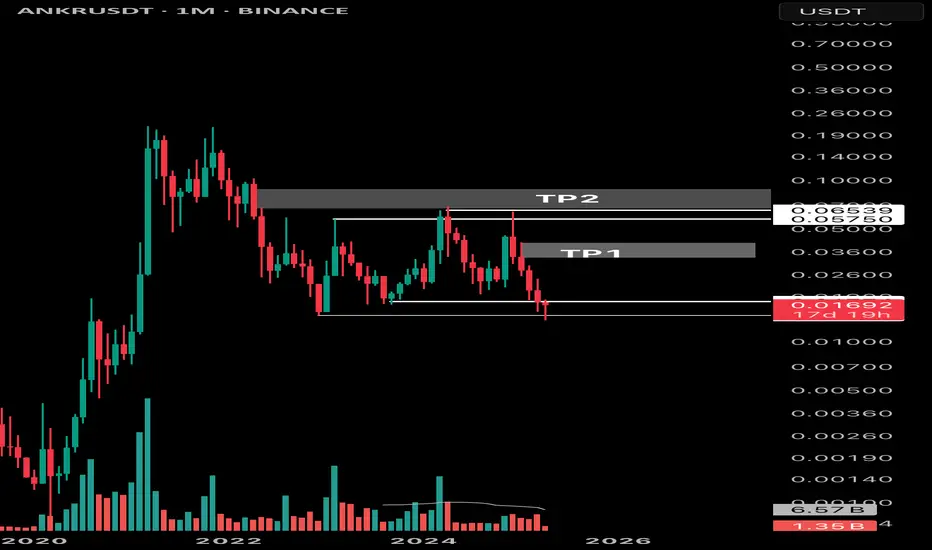
Wyckoff Accumulation In Phase D of the Wyckoff Accumulation pattern, the key sign is strong price rallies aiming for the top of the channel.
To confirm that we’ve entered this phase, we need two main things:
1. A monthly close above the last resistance (now support)
2. Low volume during pullbacks — this shows that se
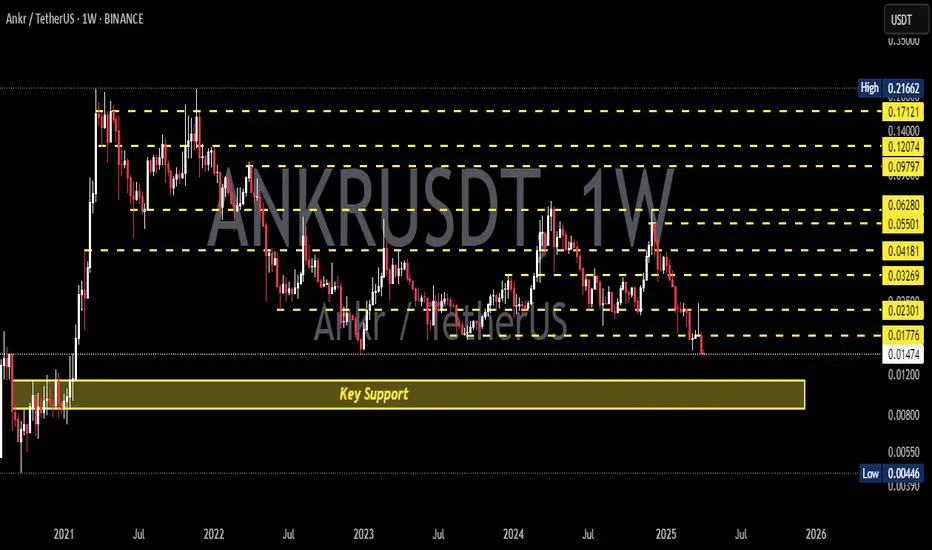
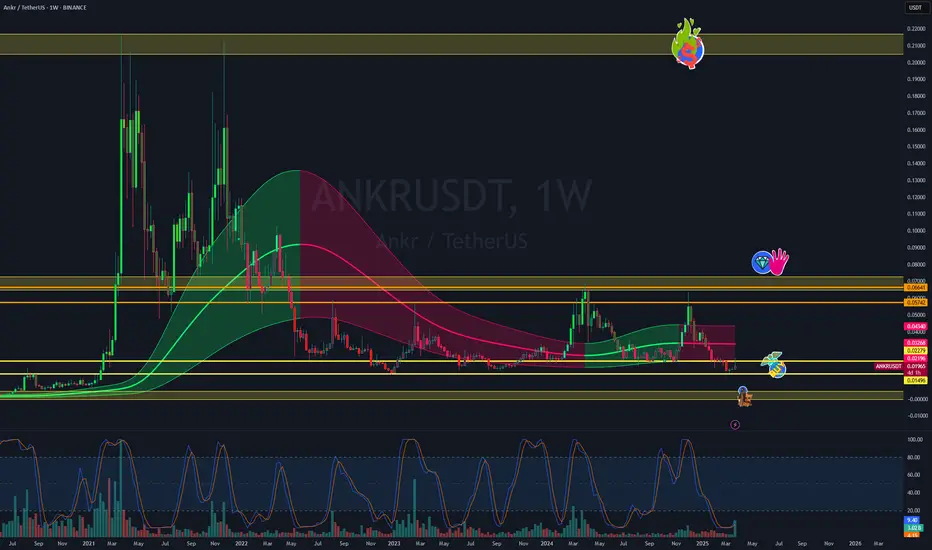
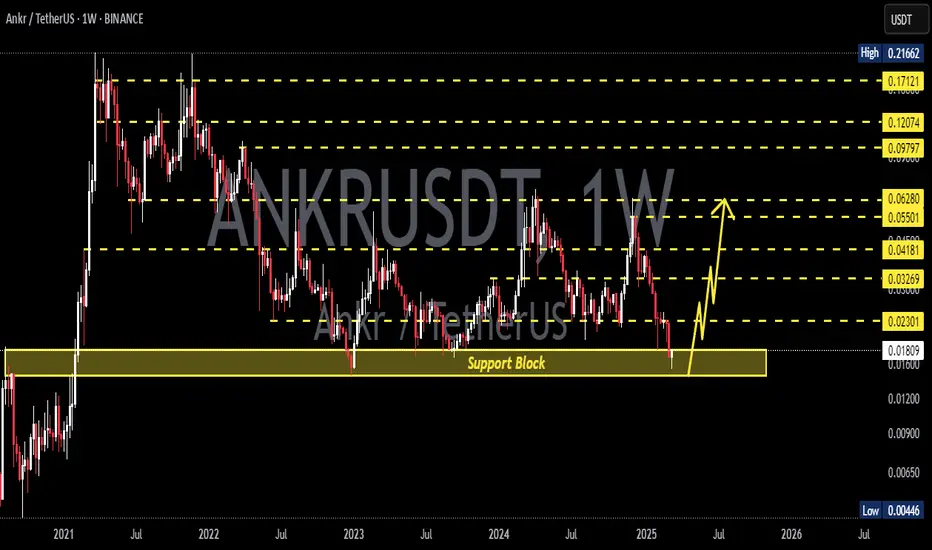
ANKRUSDT 1WANKR ~ 1W Analysis
#ANKR Buy back when testing this support with a short -term target of at least 15%+.
ANKRUSDT: A Strong Demand Zone or Breakdown Risk?ANKRUSDT is currently sitting at a crucial demand zone, a level that has historically triggered massive price movements. This same area in February 2021 acted as a springboard for huge gains, leading to a double top formation at $0.21 before experiencing a major downtrend. Since August 2022, the pri
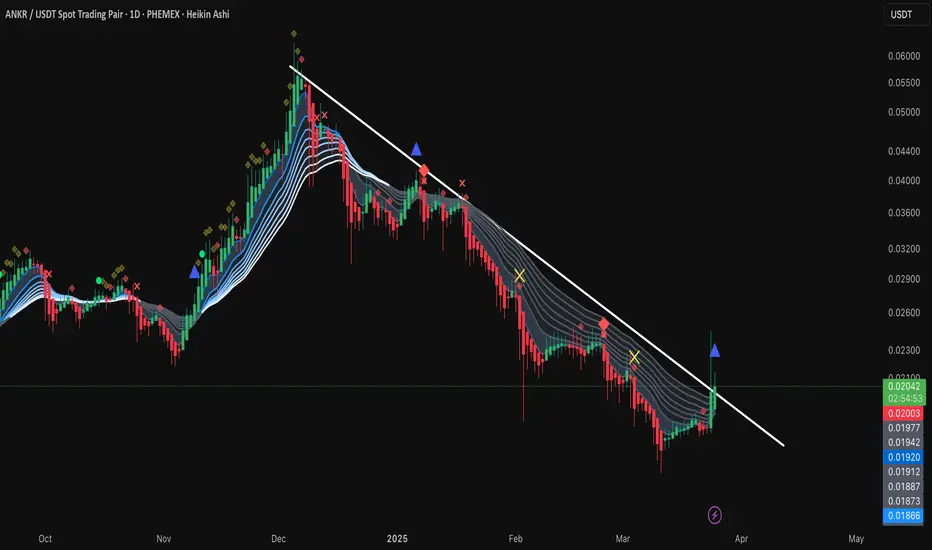
ANKRUSDTANKR/USDT 1D Chart Overview
The ANKR/USDT pair on a 1-day timeframe displays a descending trendline extending from its peak in December 2024. The current price stands at 0.020429, reflecting a 1.69% increase. With Bollinger Bands and buy/sell signals in play, the chart suggests a possible short-term
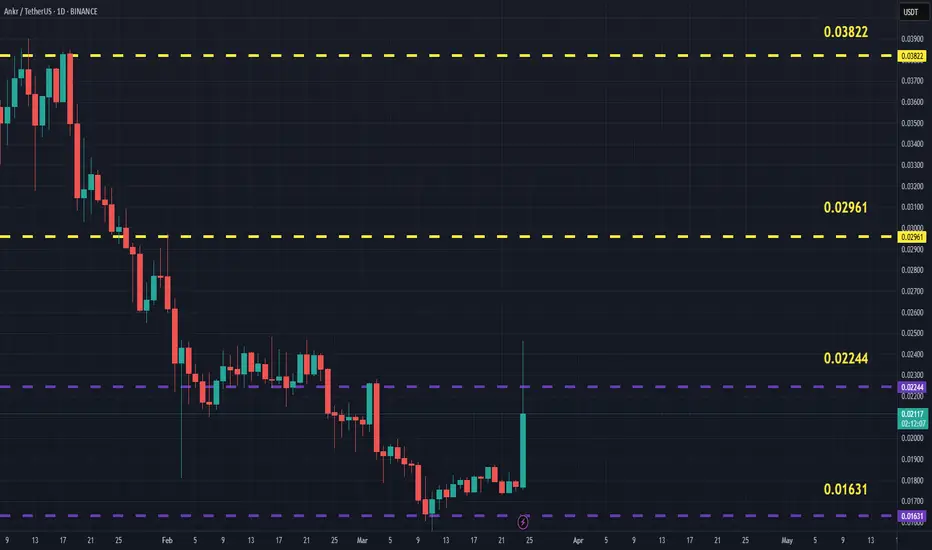
ANKRUSDT(Ankr) Updated till 24-03-25ANKRUSDT(Ankr) Daily timeframe range. many alts got similar pattern. pushing back from its new low. if those alts can defend their new low they got long way to go. now recent resistance at 0.02244 it will be optimal if it can get over it.
ANKRUSDT – Watching Key Support Zones!I’ve marked the blue boxes as potential strong support levels—this is where smart money might step in! But remember, just because a level looks good doesn’t mean we blindly buy.
📊 How I’m Trading This:
✅ Step 1: Watch for CDV confirmation—is volume supporting the move?
✅ Step 2: Look for LTF market
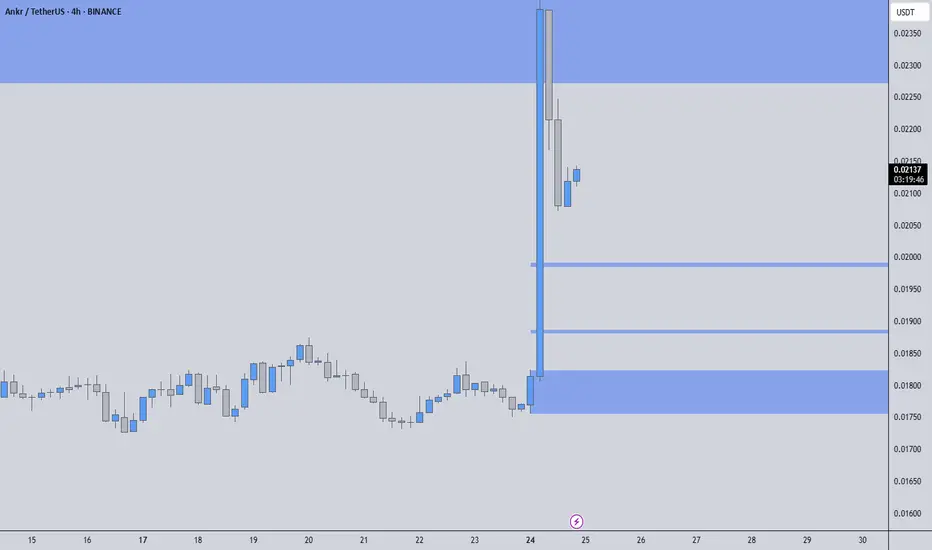
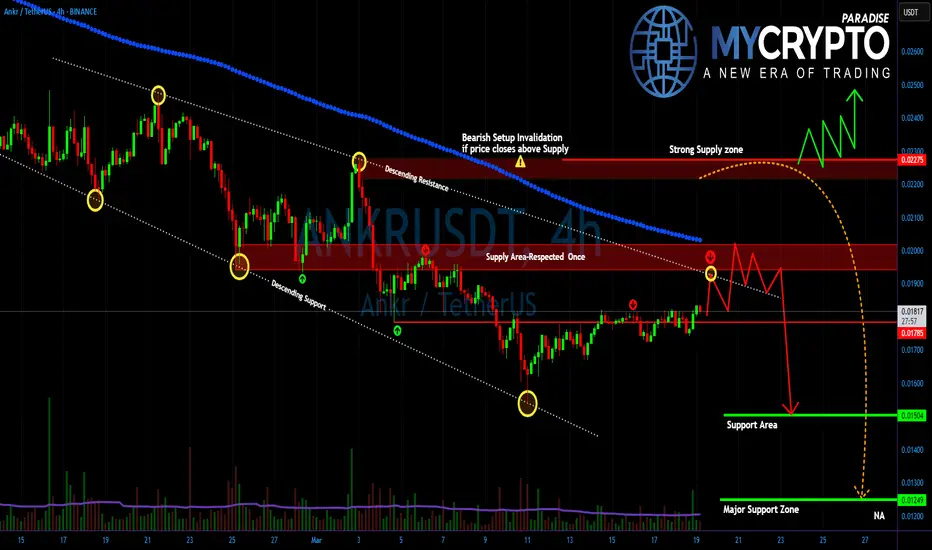
ANKR/USDT Will Bulls Take Control or Are We Heading Lower?
Yello Paradisers! Are we about to see #ANKRUSDT break out, or is another rejection incoming? Let’s break it down this is a crucial moment in the market, and you don’t want to miss it.
💎Right now, the 4-hour chart shows SEED_DONKEYDAN_MARKET_CAP:ANKR sitting above the EMA 50, signaling a short-te
ANKRUSDT 1WANKR ~ 1W Analysis
#ANKR If you still have a Conviction on this coin. Maybe this support block you can consider to start buying back with a short -term target of at least 20%+.
See all ideas
Summarizing what the indicators are suggesting.
Oscillators
Neutral
SellBuy
Strong sellStrong buy
Strong sellSellNeutralBuyStrong buy
Oscillators
Neutral
SellBuy
Strong sellStrong buy
Strong sellSellNeutralBuyStrong buy
Summary
Neutral
SellBuy
Strong sellStrong buy
Strong sellSellNeutralBuyStrong buy
Summary
Neutral
SellBuy
Strong sellStrong buy
Strong sellSellNeutralBuyStrong buy
Summary
Neutral
SellBuy
Strong sellStrong buy
Strong sellSellNeutralBuyStrong buy
Moving Averages
Neutral
SellBuy
Strong sellStrong buy
Strong sellSellNeutralBuyStrong buy
Moving Averages
Neutral
SellBuy
Strong sellStrong buy
Strong sellSellNeutralBuyStrong buy
Displays a symbol's price movements over previous years to identify recurring trends.