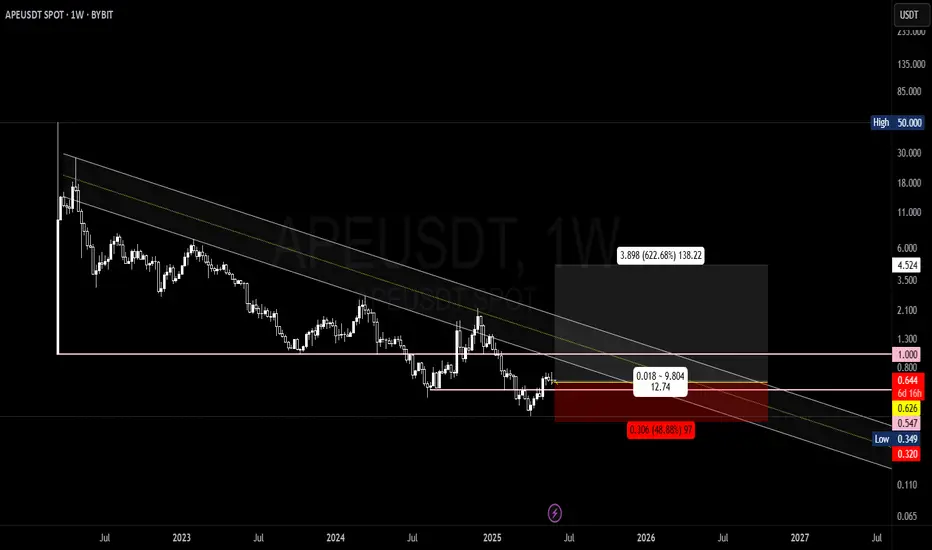
Global trading plan for APEBINANCE:APEUSDT At the moment, the price has reached the monthly pivot points, and higher time frame indicators indicate further downside potential. Thus, the price could retest the local low, and once in the support area, we’ll determine the next objectives
In this video I considered the global p

APEUSDT: Trend in daily timeframeThe color levels are very accurate levels of support and resistance in different time frames, and we have to wait for their reaction in these areas.
So, Please pay special attention to the very accurate trend, colored levels, and you must know that SETUP is very sensitive.
Be careful
BEST
MT
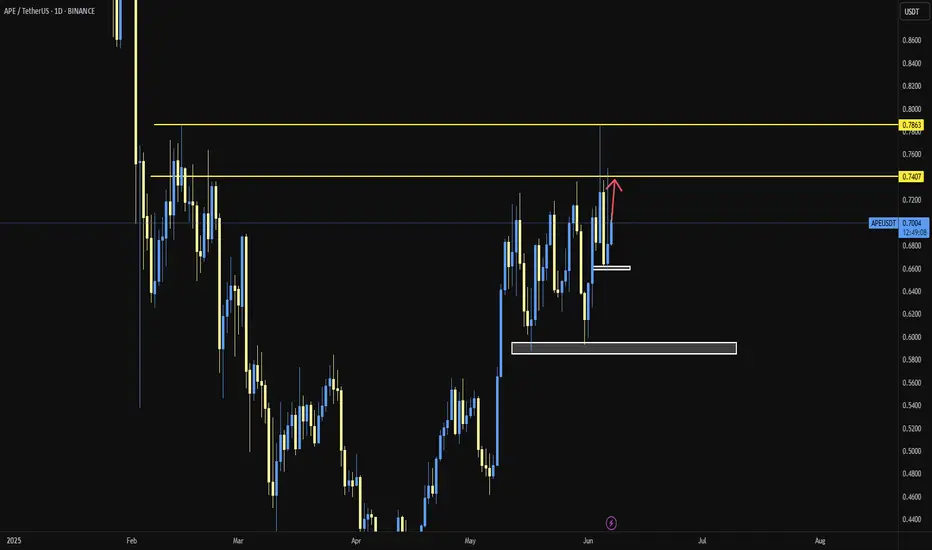
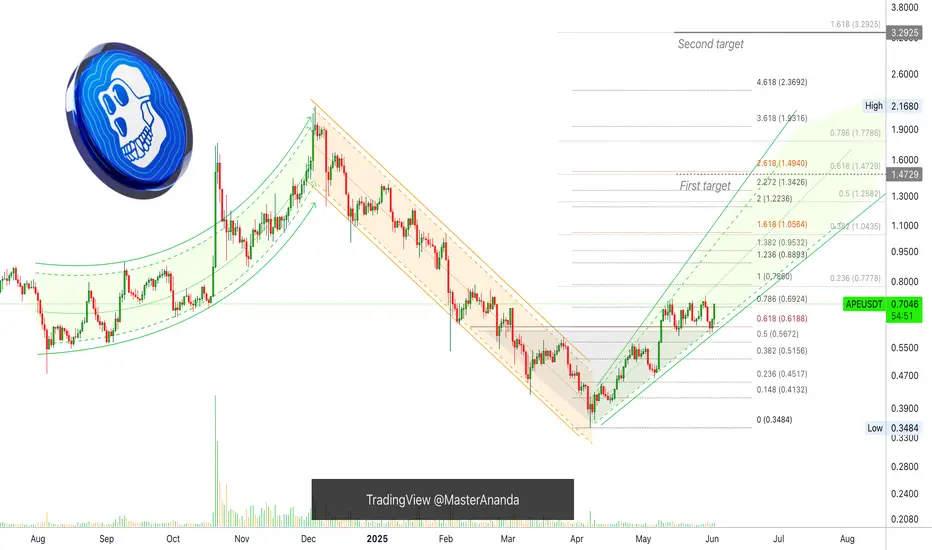
APE/USDT"APE coin could potentially reach the current resistance level first, and then move toward the next targets. Let me know what you think!"
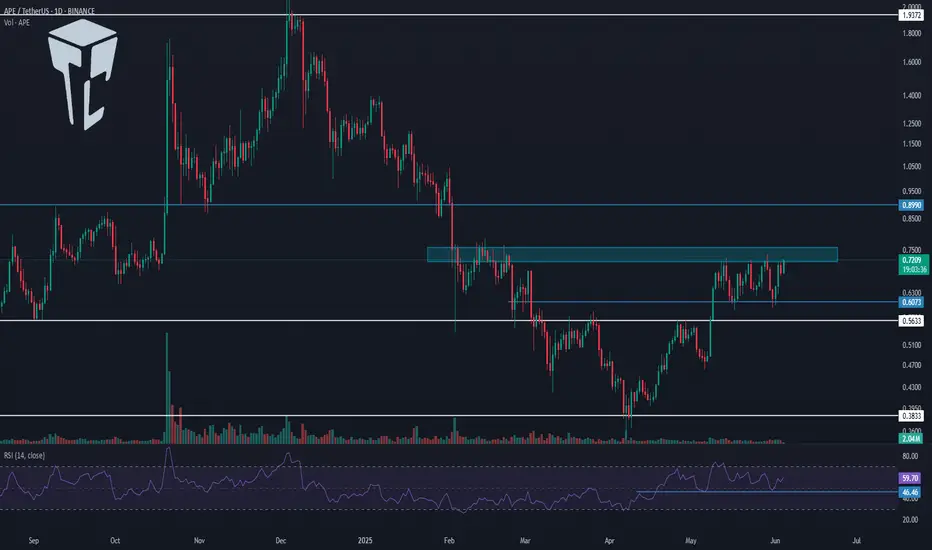
ApeCoin (APE) Cup Pattern (1D)After a deviation below demand, BINANCE:APEUSDT formed a clean rounded bottom, reclaimed the zone, briefly consolidated, and it's now attempting to break above resistance.
Key Levels
• $0.79: Current resistance
• ~$0.65: Current support, breaking it might lead to the formation of a handle
• $0.

TradeCityPro | APE: Key Breakout Watch in Gaming Token’s Range👋 Welcome to TradeCity Pro!
In this analysis, we’re taking a look at the APE coin — one of the prominent American gaming and metaverse projects that gained major traction during the last bull run.
⭐ Currently, APE holds a market cap of $540 million and ranks 110th on CoinMarketCap.
📅 Daily Timefra
APEUSDT 1D AnalysisAPE ~ 1D Analysis
#APE This trade is very risky
Buy after successfully breaking this resistance line with strong volume. With a short-term target of at least 15%+.

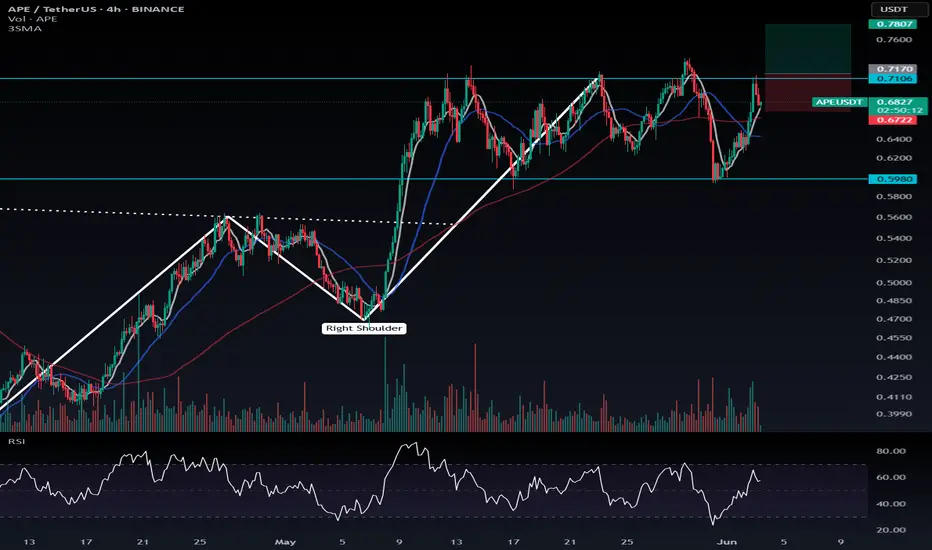
ApeCoin (APE) Forming a Bullish Reversal?📈 Key Levels to Watch (Daily + 4H Technical Analysis)
On the daily timeframe, ApeCoin (APE) is forming a clear inverse head and shoulders pattern near the bottom of the chart — a classic bullish reversal signal. A confirmed breakout above the $0.7106 resistance level could mark the beginning of a n
ApeCoin Quick Update —Moving NextWe looked at ApeCoin recently and I was certain this pair was set to move forward... What happened? Nothing really. Look at the action the last five days. The three red days were a nothing, just a small retrace and sideways consolidation. Now we are full green again.
I mentioned how the top perform
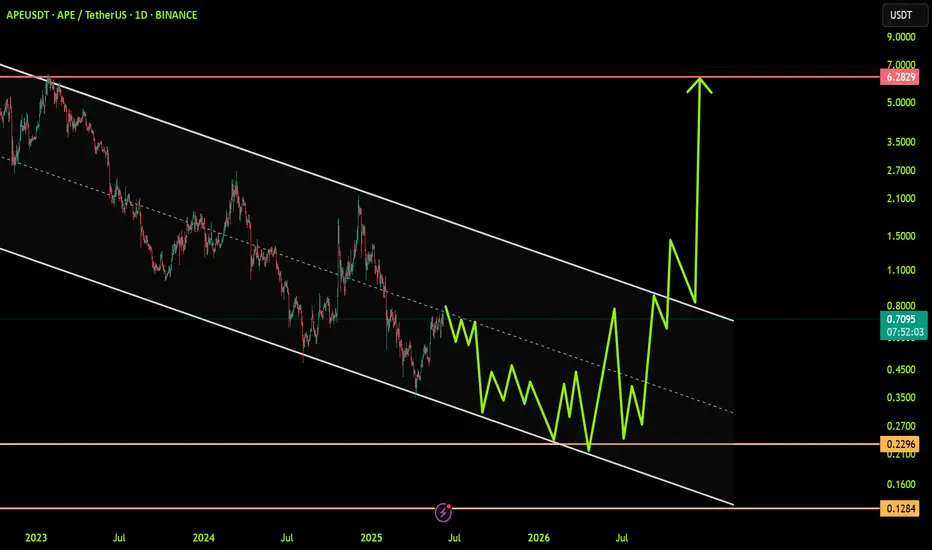
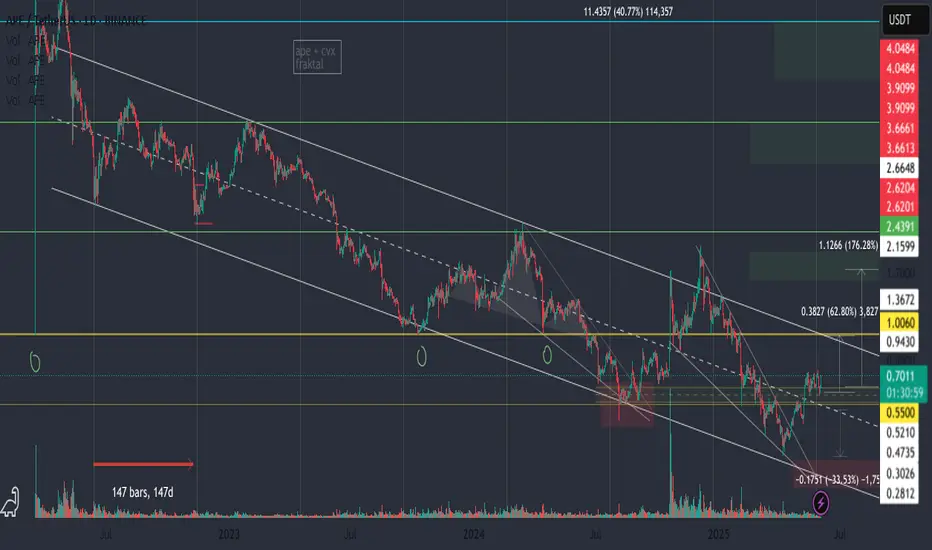
APEUSDT: Approaching Key Resistance in Descending ChannelThe asset continues to trade within a broad descending channel. Currently, the price is approaching the upper boundary, sitting near the channel’s median line — a key level that often acts as support or resistance.
Locally, a potential bullish flag pattern is forming, pointing toward the resistance
#APEAped in small size position here based off gut feeling, only 1% risk atm will add up once we have follow through
See all ideas
Summarizing what the indicators are suggesting.
Oscillators
Neutral
SellBuy
Strong sellStrong buy
Strong sellSellNeutralBuyStrong buy
Oscillators
Neutral
SellBuy
Strong sellStrong buy
Strong sellSellNeutralBuyStrong buy
Summary
Neutral
SellBuy
Strong sellStrong buy
Strong sellSellNeutralBuyStrong buy
Summary
Neutral
SellBuy
Strong sellStrong buy
Strong sellSellNeutralBuyStrong buy
Summary
Neutral
SellBuy
Strong sellStrong buy
Strong sellSellNeutralBuyStrong buy
Moving Averages
Neutral
SellBuy
Strong sellStrong buy
Strong sellSellNeutralBuyStrong buy
Moving Averages
Neutral
SellBuy
Strong sellStrong buy
Strong sellSellNeutralBuyStrong buy
Displays a symbol's price movements over previous years to identify recurring trends.