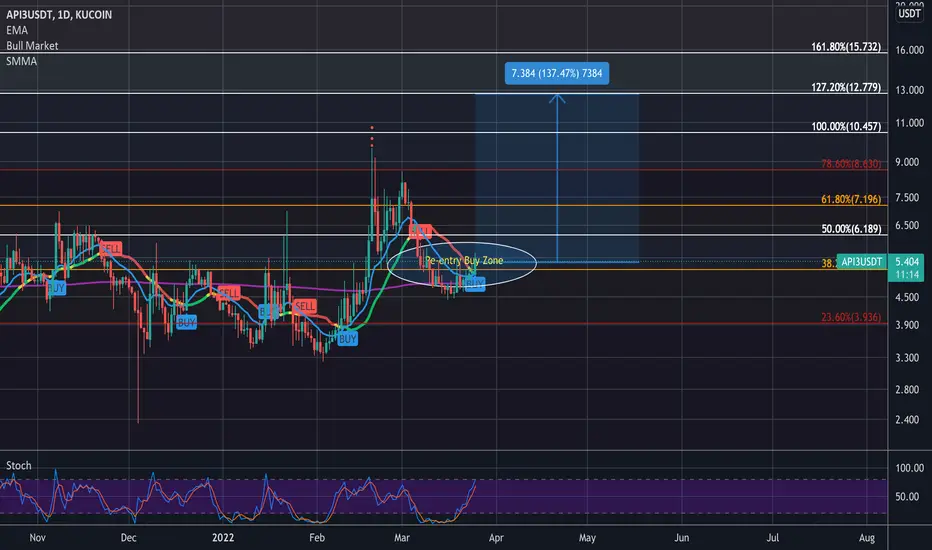
API3 back in re-entry Buy Zone 137% gain from our next targetFrom the current price API3 is 137% away from our next price target @ $12.77. From the Buy Zone, we can expect API3 to retest the previous ATH @ $10.45..it is vital for API3 to flip the previous ATH into strong support for the next leg up to the 127.20% ($10.45) & 161.80% ($15.73) fibs target which is 193% gain away from the current price in the re-entry Buy Zone. Further to this from the Bull Market Indicator for short-term trades, we have a strong Buy Indicator triggered today. The last time we had a Buy signal trigger we saw API3 gain 153% in just under 8 days. Happy Trading :)
API3USDT trade ideas
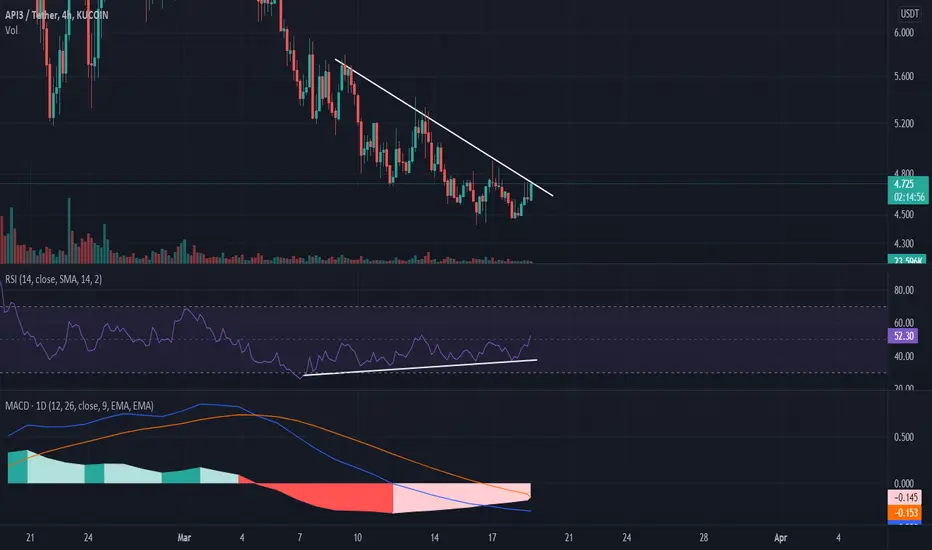
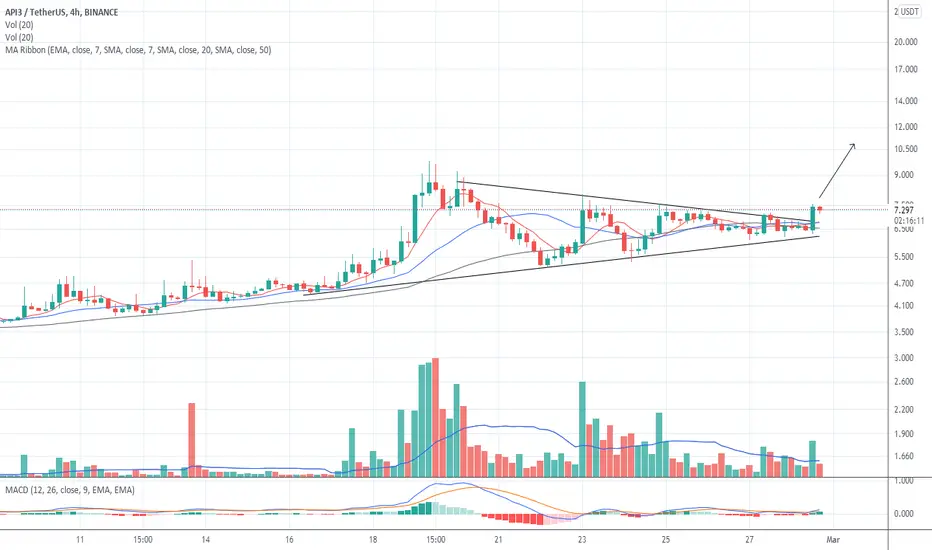
Reversal for API3 on the horizon!Hi Traders,
As you can see on the 4HR chart of API3. The price has been in a downtrend while the RSI has been in an uptrend. The Daily MACD is also showing signs of a potential reversal soon! Buy now...
Safe Trading,
-Pulkanator
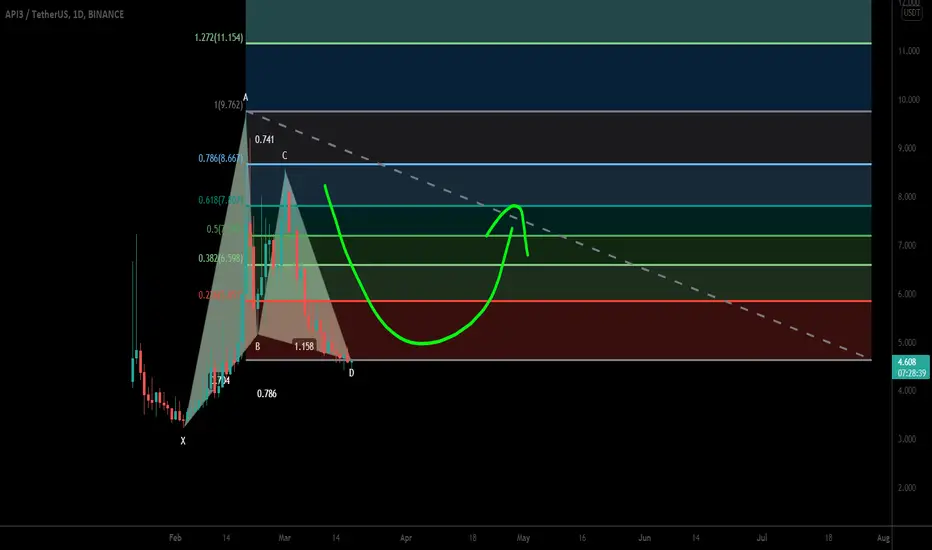
API3 formed bullish Gartley for upto 168% moveHi dear patrons, hope you are well and welcome to the new trade setup of API3 token with US Dollar pair.
On a daily time frame API3 has formed bullish Gartley pattern.
Note: Above idea is for educational purpose only. It is advised to diversify and strictly follow the stop loss, and don't get stuck with trade
API3 the new kid on the blocksome sort of eth token i believe not exactly sure. Looks like it should find support down ehre and make a move higher into the 6$ range if we hold.
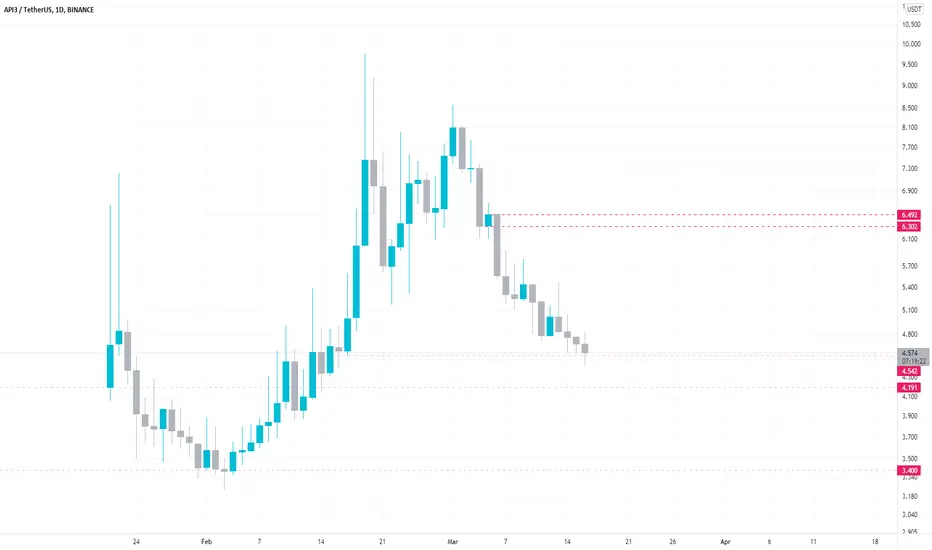
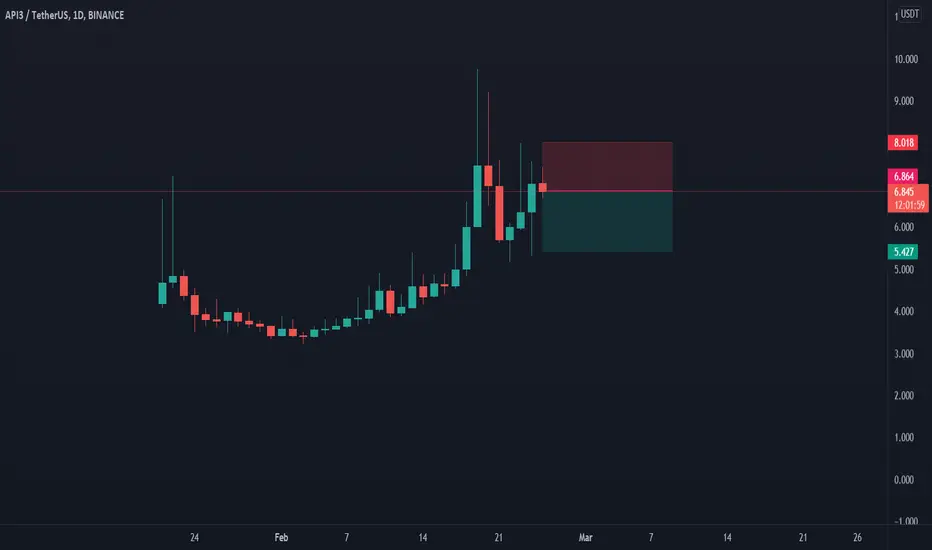
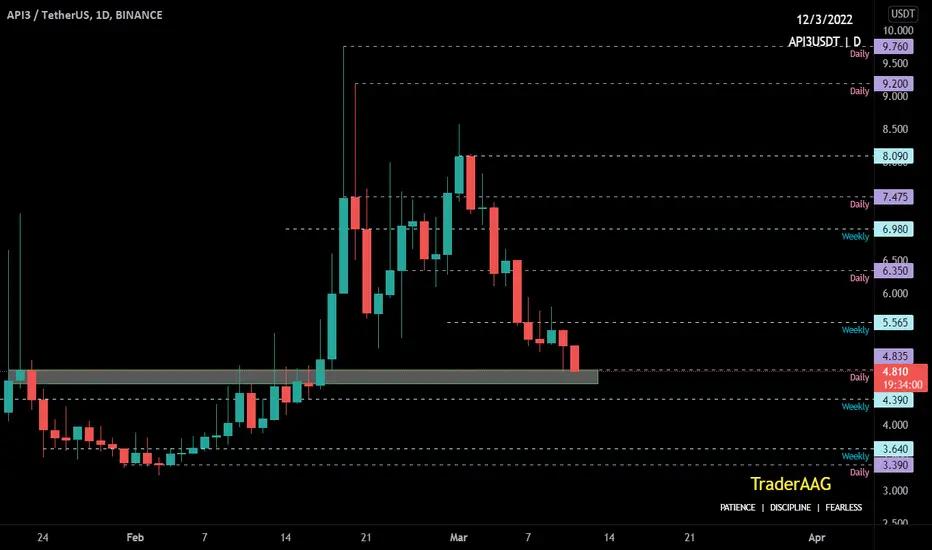
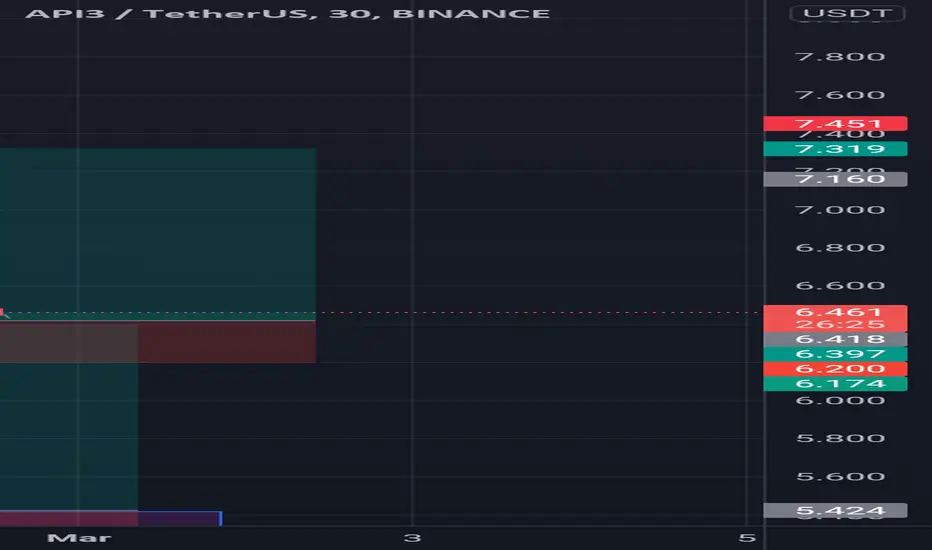
API3USDT is testing the daily resistanceThe price created a double top on the daily time frame and now the market is testing the 0.786 Fibonacci level.
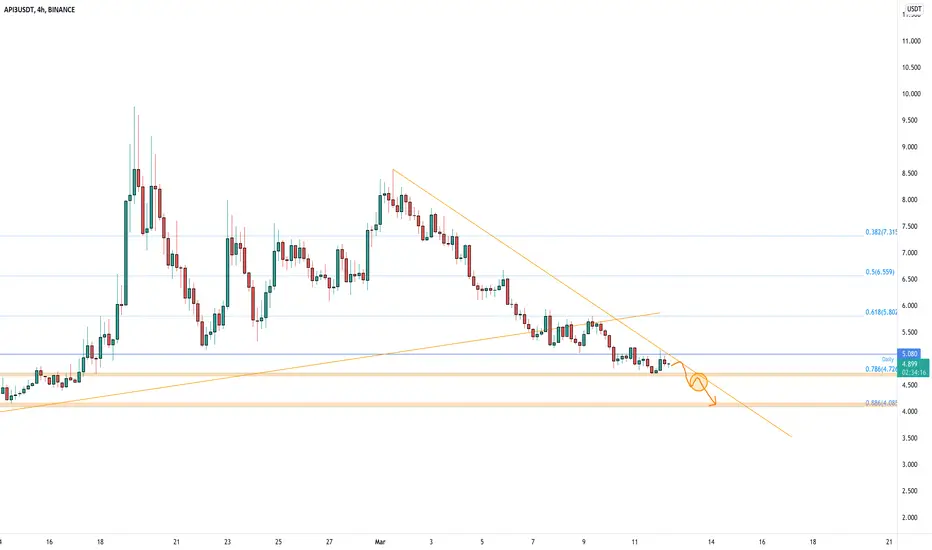
On the 4h timeframe, the price got a rejection from the previous daily resistance now new support on 5$.
How to approach?
If the price is going to lose the current support, 4.6$, and retest it as new resistance, we can add in our watchlist and apply our rules for opening a new short position until the next valid support on 0.886 Fibonacci level around 4$.
the scenario is invalidated if the price is going to have a breakout from the 5$ area and retest it as new support.
––––
Keep in mind.
🟣 Purple structure -> Monthly structure.
🔴 Red structure -> Weekly structure.
🔵 Blue structure -> Daily structure.
🟡 Yellow structure -> 4h structure.

🔥 #API3/USDT lying on Strong Support#API3/USDT lying on Strong Support.
You can buy some coins here, Use a tight stop loss. if it breaks this support exit with a small loss and wait for the next support or you can an average your entry.
API3 Support & Resistance areaIn this chart we can see how exactly price get rejection & price rise from resistance & support. With the help of stochastic RSI indicator we can easily guess the price reaction. Once stochastic RSI reaches 80 & the candle is at its resistance we will get rejection from this point.

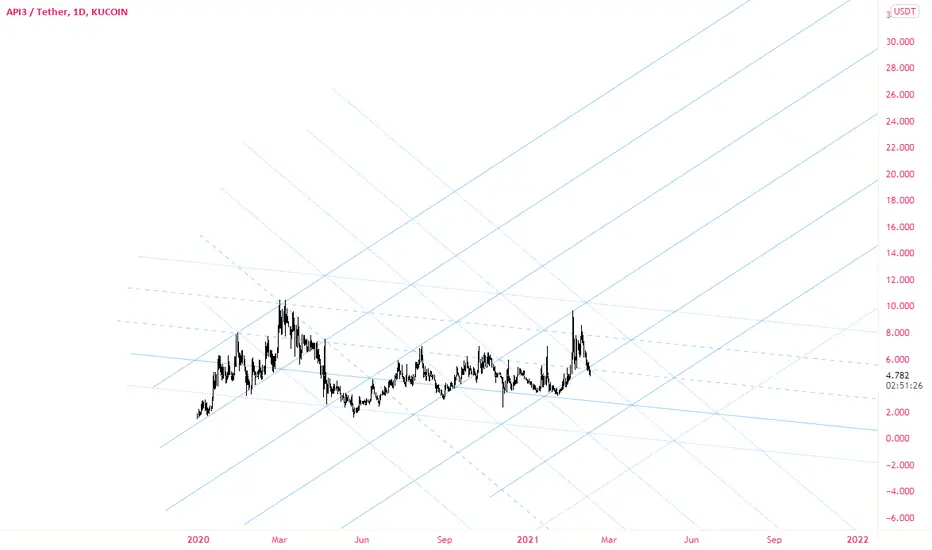
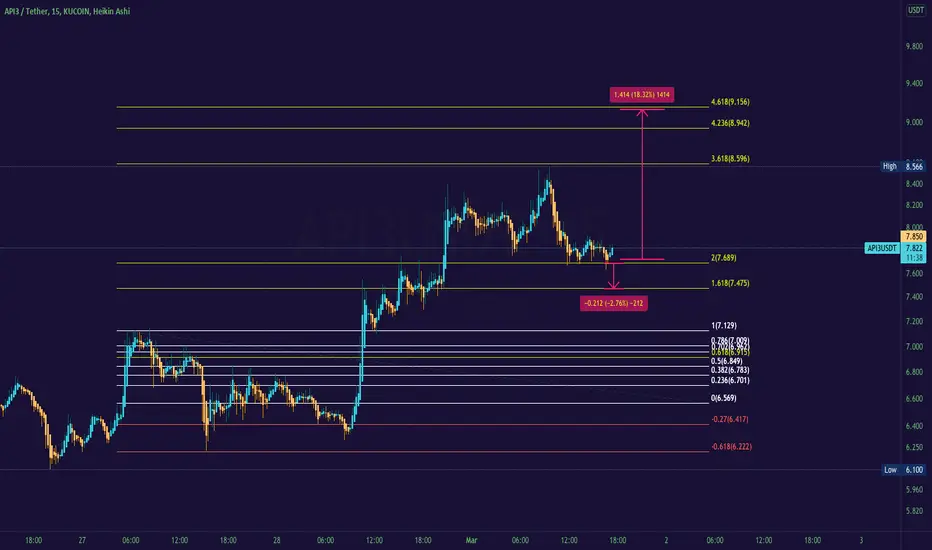
Interesting Fibonacci layout Seems like API3 might be following these fibs, if bulls pull trough I think we can go up to around 9 before another retracement - or it could just all go down and completely invalidate the structure, just putting this out there.
api 3 slight correction after symmetrical traingle pattern breakApi 3 @Chainlik killer will definitely moon ... After breakout from traingle pattern now its moving upward which can easily traced by parrallel lines too..

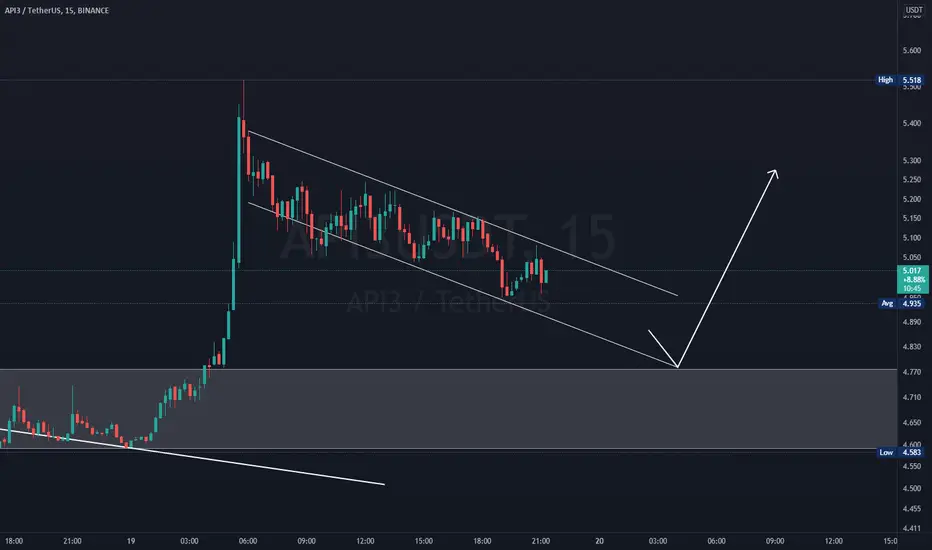
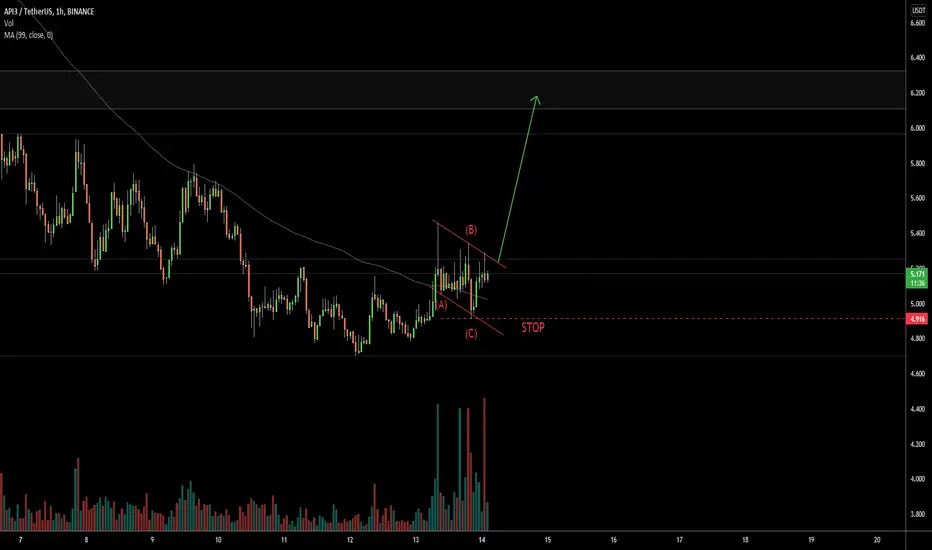
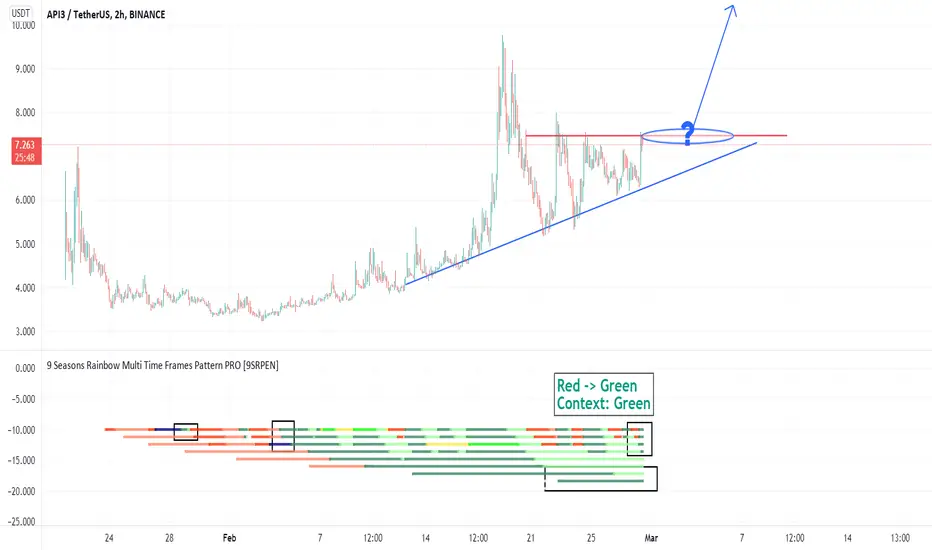
API3 Long Opportunity 20220228 api3usdt api3usdtpSignal: Red -> Green
Context: Blue -> Green
Waiting for Breakout of the upper resistance
The bottom blue support line should not be broken
API3, API3USD, API3USDT,API3USDTP, API3USDT, ,CRYPTO,CRYPTOCURRENCY
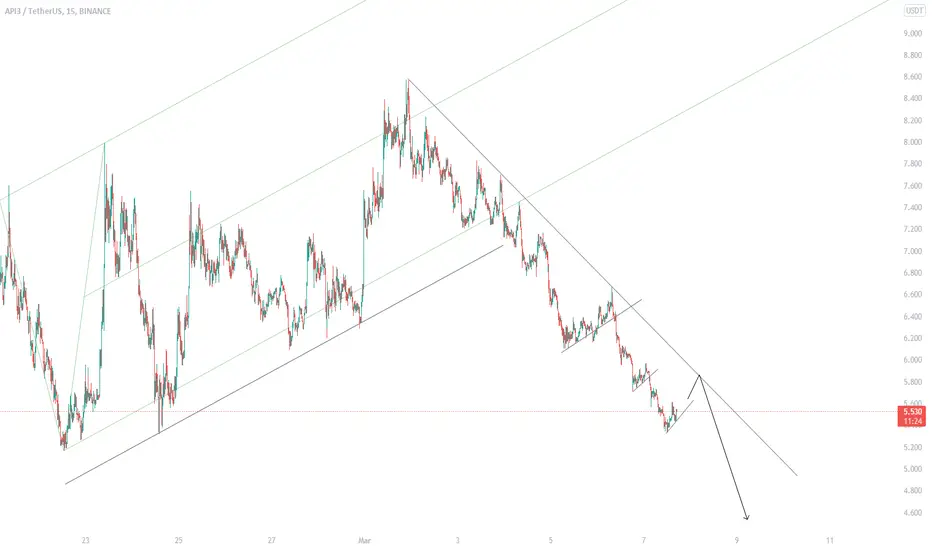
API3- breakoutThe technical configuration for API3 look promising.
- A long triangle that is breaking upward
- Strong volumes
However the volatility is high, so be prudent on this crypto
API3 broke traingle patternHello everyone . Api3 just gave brokeout from traingle pattern //Do your own reseach just put stop loss from where it actually gave breakout from


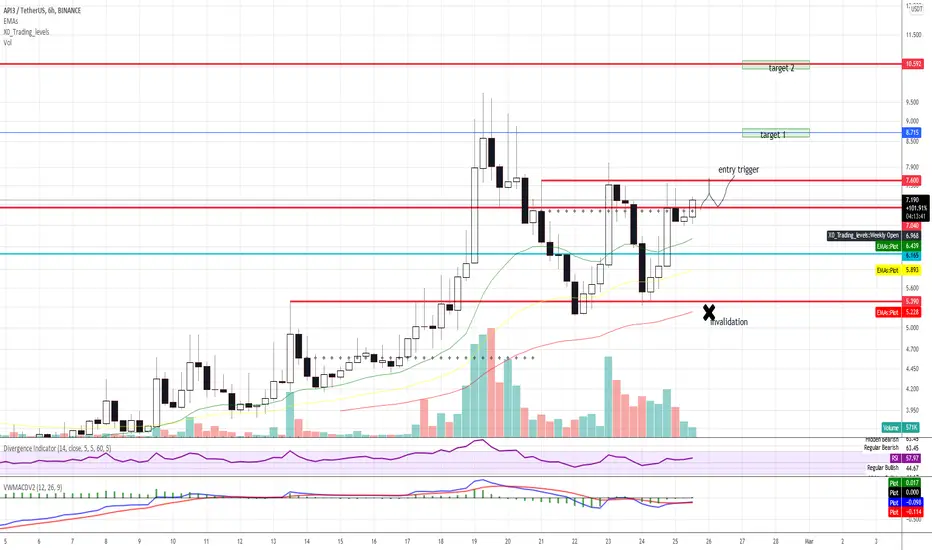
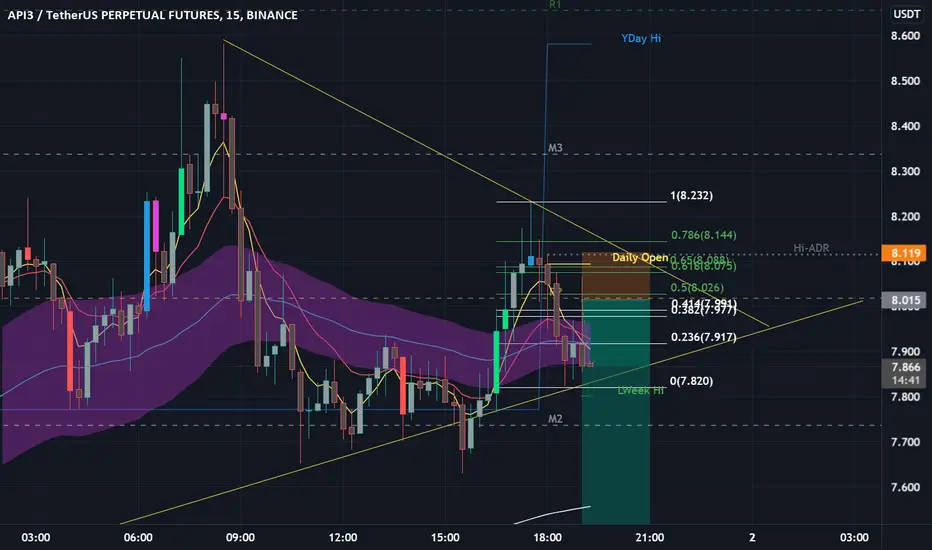
Long API3USDTLong API3USDT
Im looking to API3USDT after a 6h close above 7.612
1st Target - 8.715 zone
2nd Target - 10.592 zone
invalidation daily close below 5.39