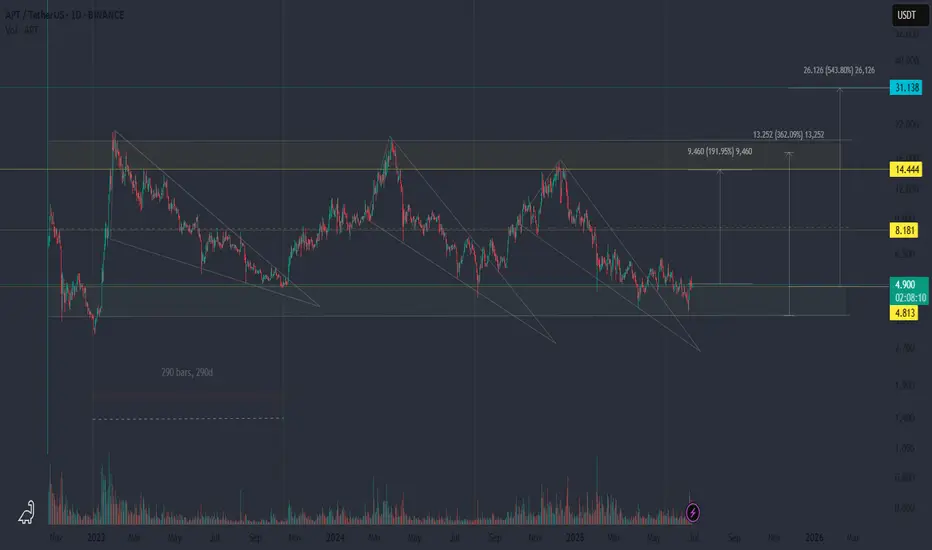
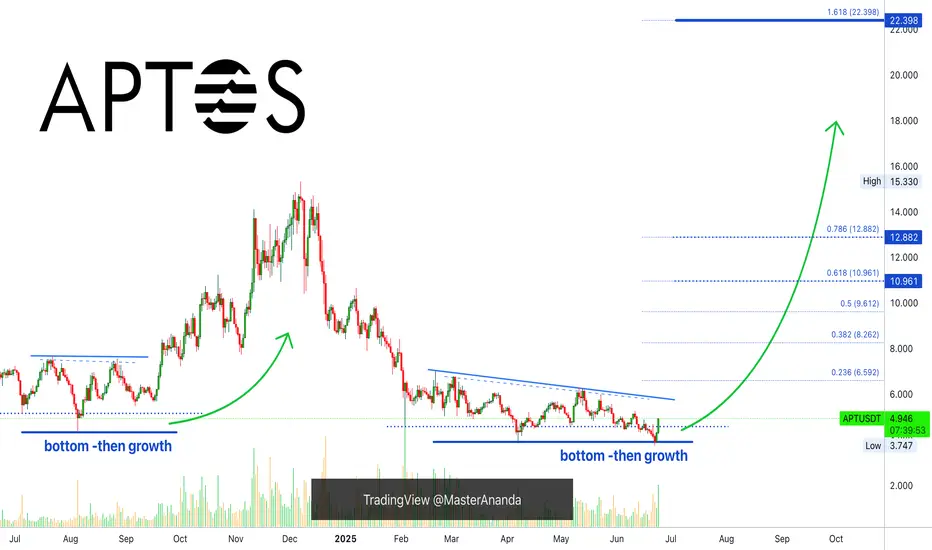
APT/USDT — Same Pattern, Same Potential?APT/USDT is showing a repeating cyclical structure — three times price has broken out of a falling wedge, each followed by a sharp rally.
📈 Historically:
▪️ Each breakout led to +150% or more gains
▪️ We’re now seeing a third similar setup forming
▪️ Targets (based on previous expansions): 8.18 / 1
Aptos APT price analysis💰 We will soon find out whether the price of #APT has finally begun to recover, or whether this is just a rebound before a further decline.
📈 For growth to continue, it is important that buyers manage to keep the price of OKX:APTUSDT above $4
◆ Next, the price will exit the falling channel and mo
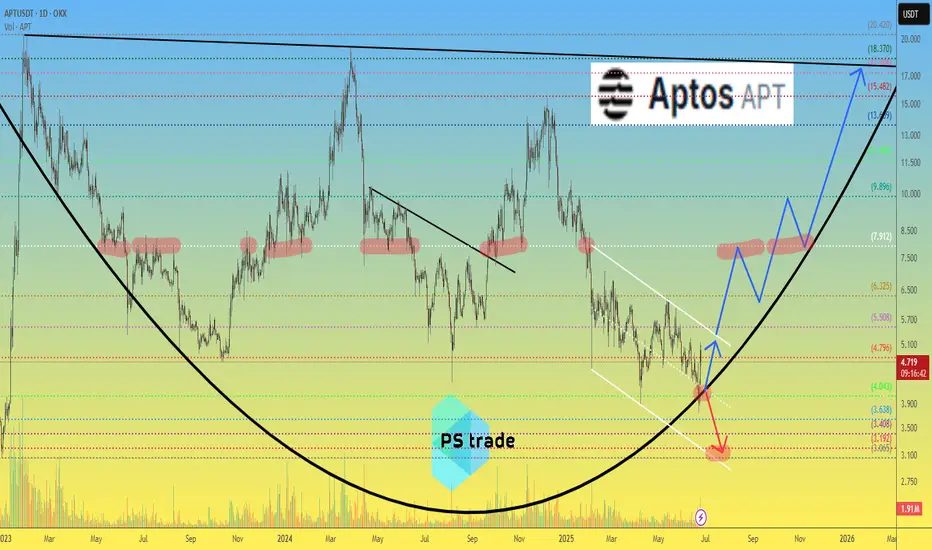
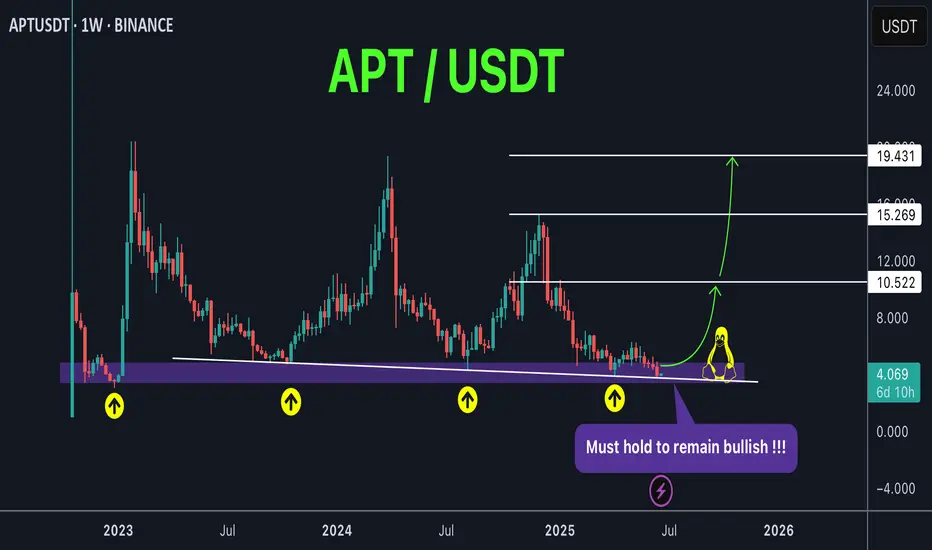
APT at Historic Support – Massive Reversal Incoming?APTUSDT technical analysis update
APT has been trading inside a descending channel for over 900 days, and it's now once again testing the channel support. As shown in the chart, the price has bounced multiple times from this level, making it a historically strong support zone.
Currently, the targe
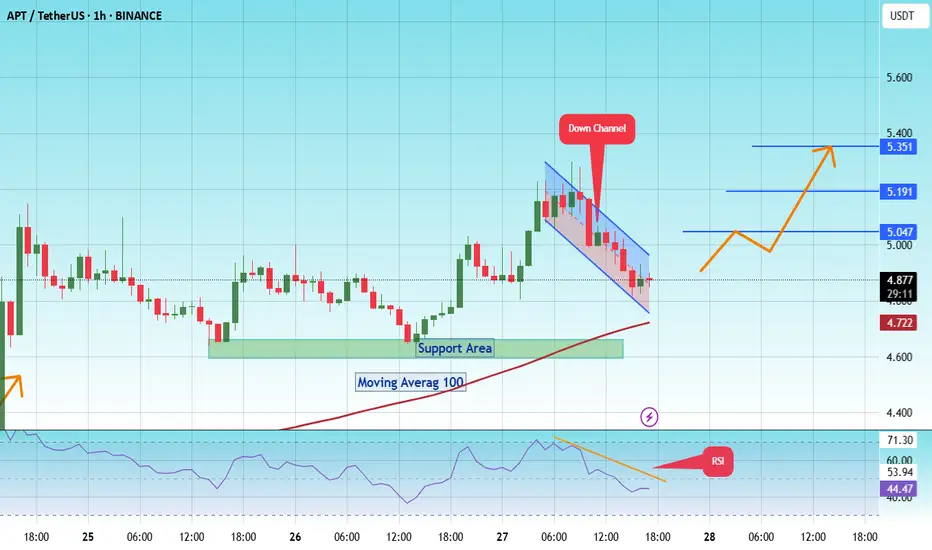
#APT/USDT#APT
The price is moving within a descending channel on the 1-hour frame and is expected to break and continue upward.
We have a trend to stabilize above the 100 moving average once again.
We have a downtrend on the RSI indicator that supports the upward move with a breakout.
We have a support a
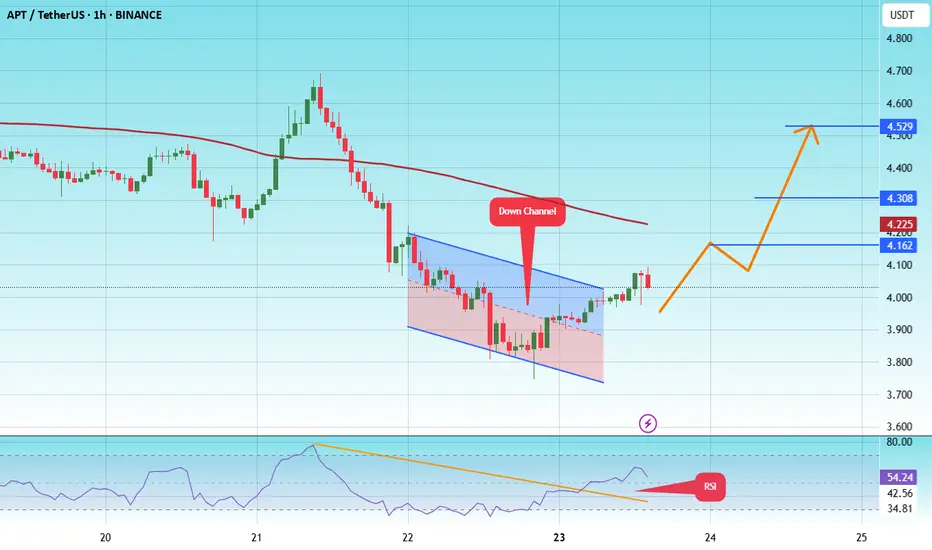
APT at 4.78 $ Historic Support – Massive Reversal Incoming?#APT
The price is moving within a descending channel on the 1-hour frame and is expected to break and continue upward.
We have a trend to stabilize above the 100 moving average once again.
We have a downtrend on the RSI indicator that supports the upward break.
We have a support area at the lowe
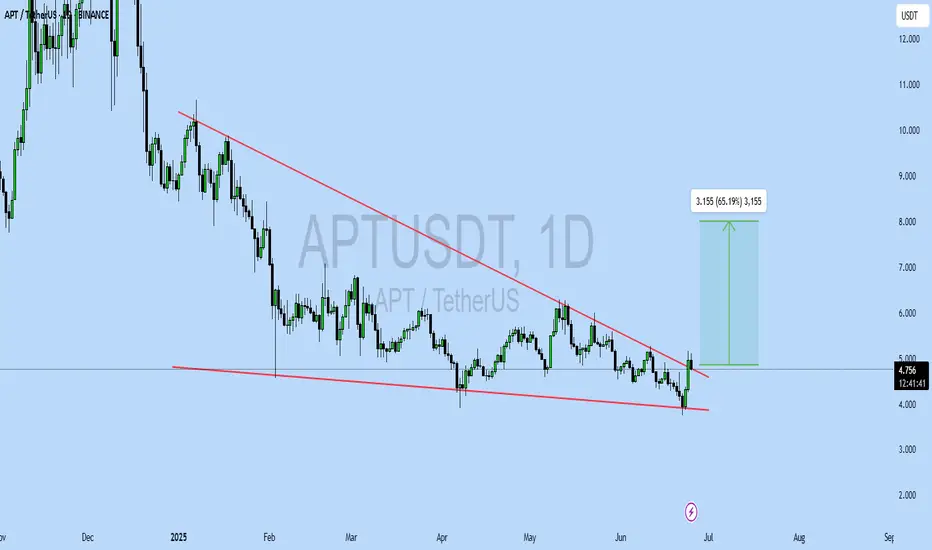
APTUSDT UPDATE
Pattern: Falling Wedge Breakout
Current Price: \$4.755
Target Price: \$8.00
Target % Gain: 65.19%
Technical Analysis: APT has broken out of a falling wedge pattern on the 1D chart, showing bullish momentum. Breakout is confirmed with a strong green candle and minor volume uptick. Close above resi
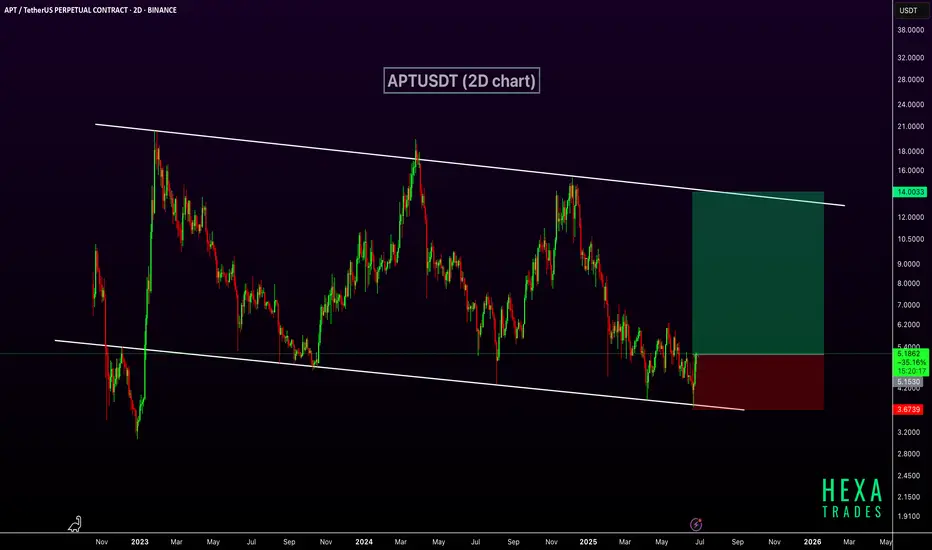
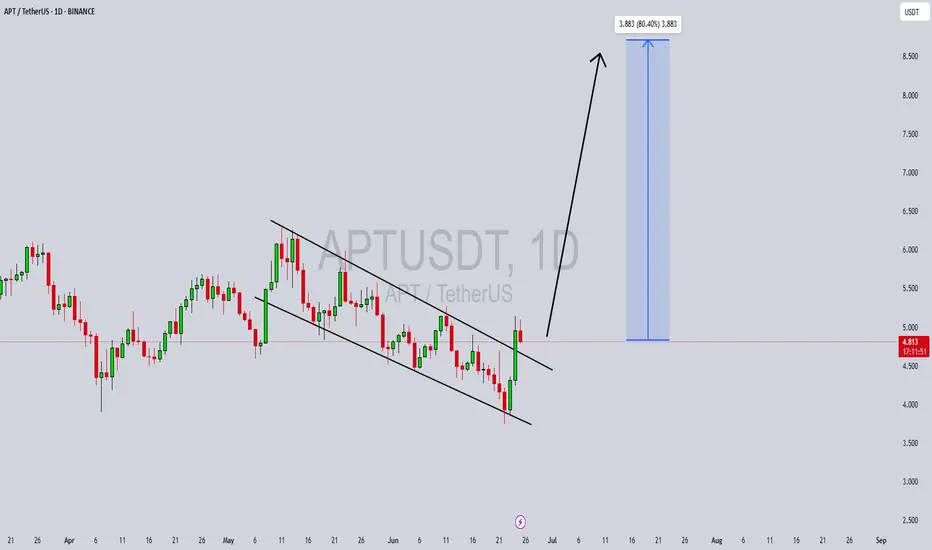
APTUSDT Forming Bullish Falling ChannelAPTUSDT is currently forming a bullish falling channel breakout, which is a classic reversal pattern indicating that the downtrend may be ending. The price action shows clear signs of compression within a downward-sloping channel, with the recent breakout suggesting a strong shift in momentum from b
Aptos Bullish, Altcoins BullishThe best is yet to come. Do not despair my dear friend, patience is key.
Aptos is breaking bullish right now after a final low with the highest volume since February. This confirms the latest double-bottom as the market bottom.
The high bullish momentum developing on today's candle, full green, co
APT around a historical support DO or DIEAPT / USDT
Price dropped hard to retest the massive historical support again
This multi years support ( 3$-4$) zone always shows great buying pressures thats why it catch our attention!
This support also can play as DO or DIE borderline between bulls and bears
The buyers must defend this area o
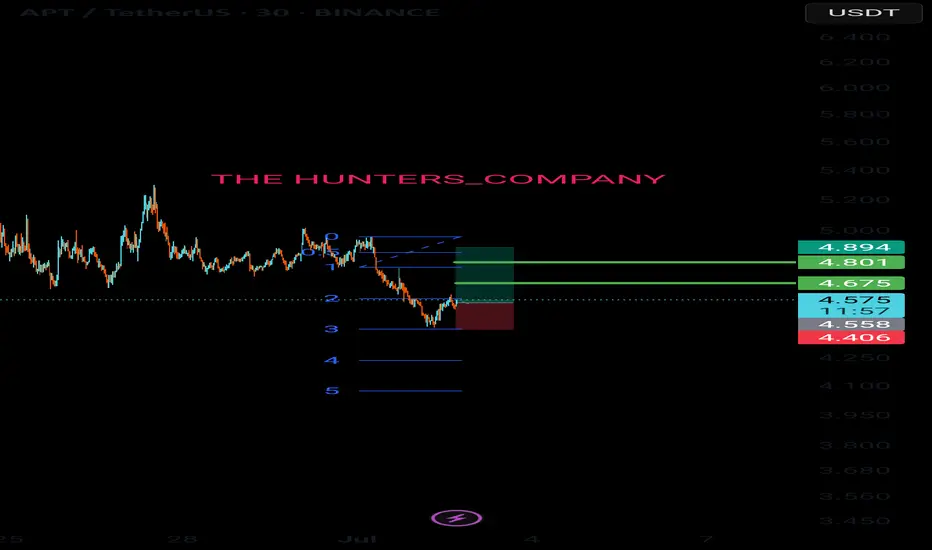
Live tradehello friends👋
✅️Considering the drop we had, now the price has reached an important and good support and the price is supported by the buyers, and the downward trend line has broken and the ceiling has been raised. Considering this, we entered into the transaction with capital and risk management.
See all ideas
Summarizing what the indicators are suggesting.
Oscillators
Neutral
SellBuy
Strong sellStrong buy
Strong sellSellNeutralBuyStrong buy
Oscillators
Neutral
SellBuy
Strong sellStrong buy
Strong sellSellNeutralBuyStrong buy
Summary
Neutral
SellBuy
Strong sellStrong buy
Strong sellSellNeutralBuyStrong buy
Summary
Neutral
SellBuy
Strong sellStrong buy
Strong sellSellNeutralBuyStrong buy
Summary
Neutral
SellBuy
Strong sellStrong buy
Strong sellSellNeutralBuyStrong buy
Moving Averages
Neutral
SellBuy
Strong sellStrong buy
Strong sellSellNeutralBuyStrong buy
Moving Averages
Neutral
SellBuy
Strong sellStrong buy
Strong sellSellNeutralBuyStrong buy
Displays a symbol's price movements over previous years to identify recurring trends.