APTUSDT.PS trade ideas

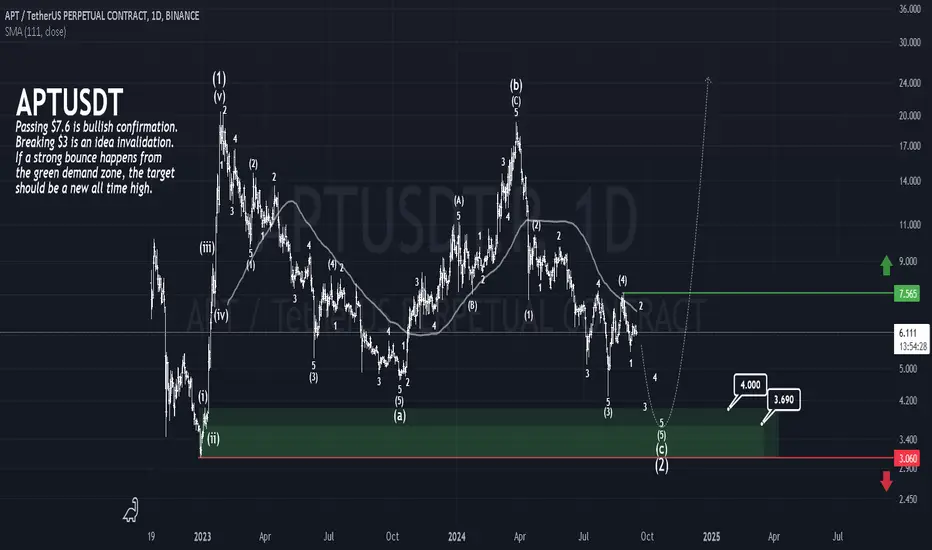
APTOS Bullish ChancePassing $7.6 is bullish confirmation.
Breaking $3 is an idea invalidation.
If a strong bounce happens from the green demand zone, the target should be a new all time high.
#APTOS
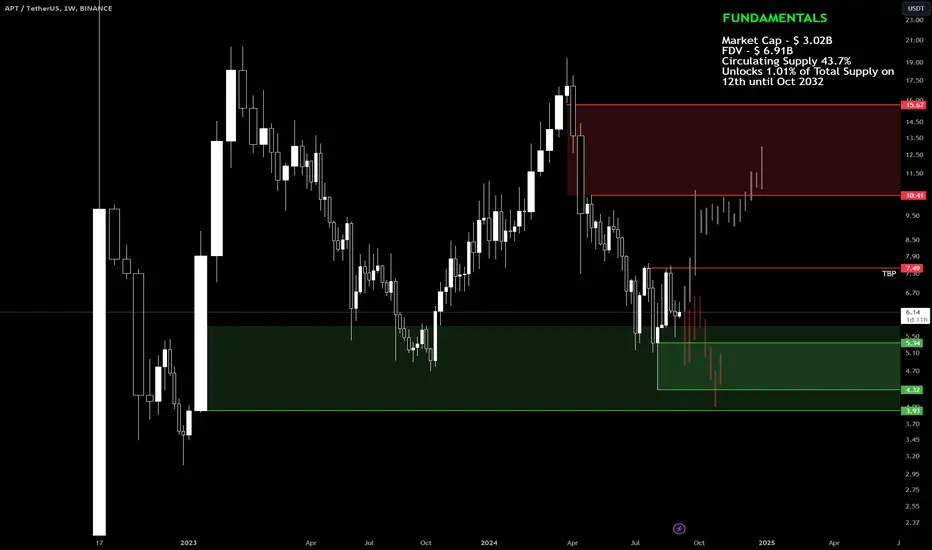
$APT (#Aptos)🔻 Trend Break Point: A trend reversal may occur if the price holds above $7.49.
🔻 Downside Risk: Failed to break the downtrend on the first attempt. Possible reaccumulation near the wick at $4.3 - $5.3. Below $3, there’s a freefall scenario.
🔻 Decision Zone: First targets for a bounce are $10 - $12.5.
🔻 Fundamentals: Positive sentiment around the ecosystem, with a chance of a second #AirdropGiveaway. Keep an eye on token unlocks.
🟢 Green zone = buying opportunities. 🔴 Red zone = selling or profit-taking zones. Stay tuned for price action and setups in these areas.
Apt short I am shorting Aptcoin because I believe it needs correction. I plan to take profits at nearby levels and am not aiming for a large reward.

APTOS Sell Position / Setup SettingBINANCE:APTUSDT
COINBASE:APTUSD
Hello Traders
SL1 ---> Low-risk status: 3x-4x Leverage
SL2 ---> Mid-risk status: 5x-8x Leverage
👾The setup is active but expect the uncertain phase as well.
➡️Entry Area:
Yellow zone
⚡️TP:
On the chart
🔴SL:
On the chart
🧐The Alternate scenario:
If the price stabilizes below the trigger zone, the setup will be cancelled.

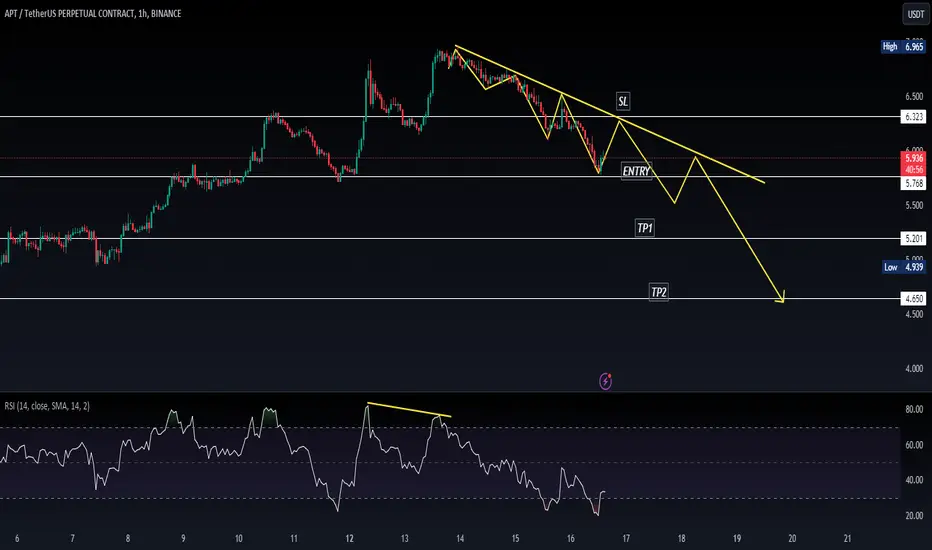
Ascending Triangle in APTUSDT.PThe graph is run trend by Ascending triangle pattern. It should be open short position. RSI and graph are the same trend. It is not necessary to complex analysis for this position because clearly from trend.

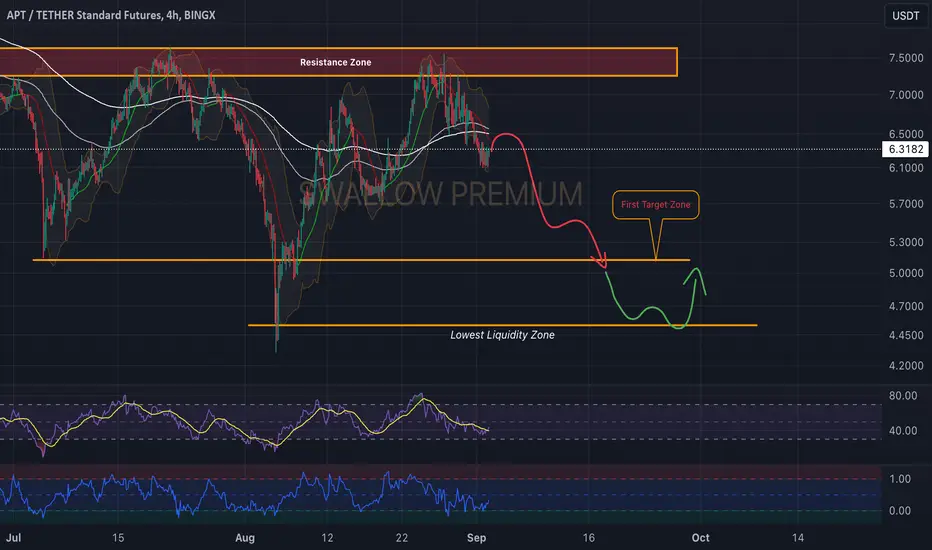
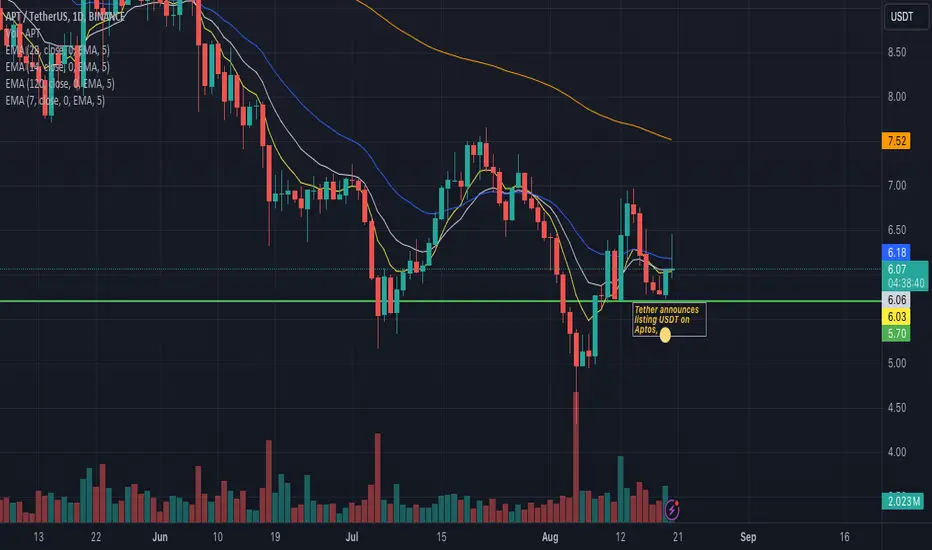
Aptos (APT): Good Chance To Fall!Aptos is looking good to fall where price has re-tested that major resistance zone and now where it broke the EMAs.
While the price is still securing the current zone, as soon as it is secured, we see a good chance of downward movement to happen from here!
Swallow Team
APTOS Aptos is forming a bullish divergence, which suggests a favorable opportunity for me to go long.

AptApt is forming higher highs on a lower time frame, which suggests a favorable opportunity to go long.
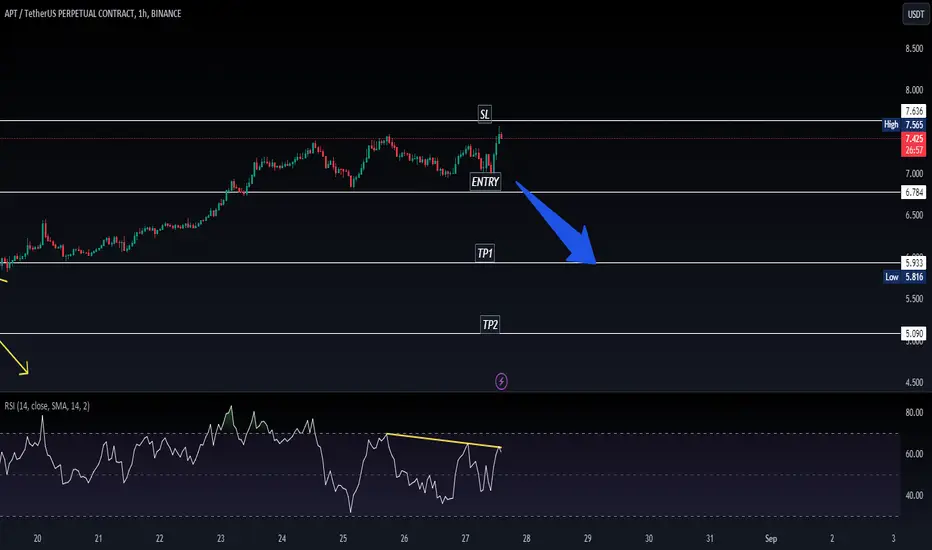
APTUSDT - Swing Short IdeaPrice made false breakout of previous weekly high (orange line) and break the 4H structure (white line), so I would expect to see price distribute lower, potentially to previous week low (orange line).
Entry on 1H TF, risk not more than 1% on any trade.

APTUSDT.PAPTUSDT.P is in ranging phase.
If it breaks the rectangular pattern downward then it will go to bearish trend.
Bearish divergence also shown in RSI.
We wait and watch for the breakout of reversal pattern.
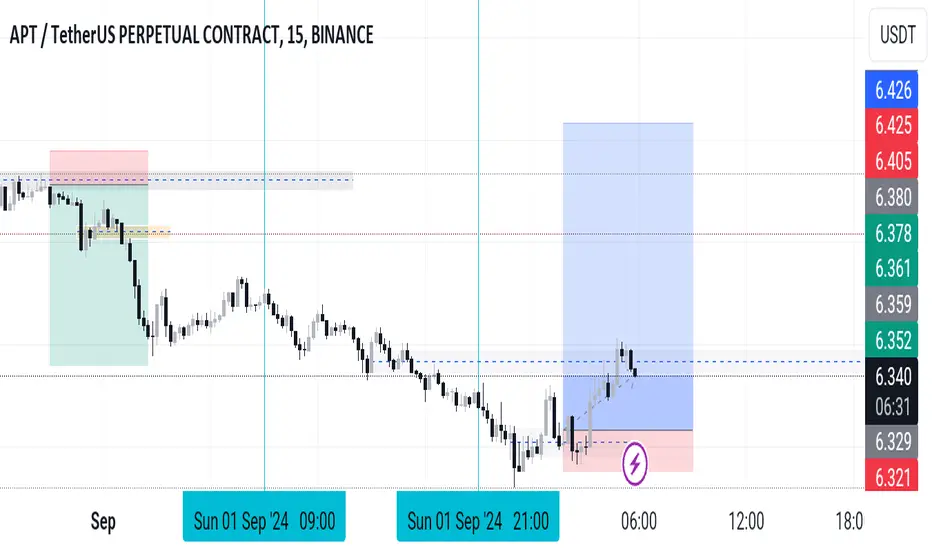
Long Position on APTUSDT 1H / (Volume Projection)BINANCE:APTUSDT
COINBASE:APTUSD
Mid-risk status: 5x-8x Leverage
Low-risk status: 3x-4x Leverage
👾The setup is active but expect the uncertain phase as well.
⚡️TP:
5.96
6.05
6.15
6.25
6.32
6.45
6.52
6.60(In Optimistic Scenario)
➡️SL:
5.6
🧐The Alternate scenario:
🔴If the price stabilizes below the trigger zone, the setup will be cancelled.

#APT/USDT#APT
The price is moving within a descending channel pattern on the 4-hour frame and is expected to break upwards after it has adhered to it to a large extent
We have a downtrend on the RSI indicator that is expected to break upwards and we have a trend to stabilize above it
We have a major support level in green at a price of 4.86
We have a trend to stabilize above the moving average 100 which supports the rise
Entry price 4.80
First target 5.68
Second target 6.28
Third target 7.10

Aptos Short #sellAptcoin reject from bearish broker block so that is my entry to go short & if the price comes and takes out the highe my idea to go short is invalidate

5.72 strong support line for APT (Aptos)APT holding 5.72 is likely. 5.72 is now a strong support line.
BINANCE:APTUSDT
Apt scalpingIt's showing strength in lower time frame and I am targeting the high of the day as a take profit


APTUSDT.PAPTUSDT.P is in bearish trend.
Potentially printing LH and LL.
No sign of reversal.
Sellers are strongly active.
We wait and watch for the breakout of last LL.
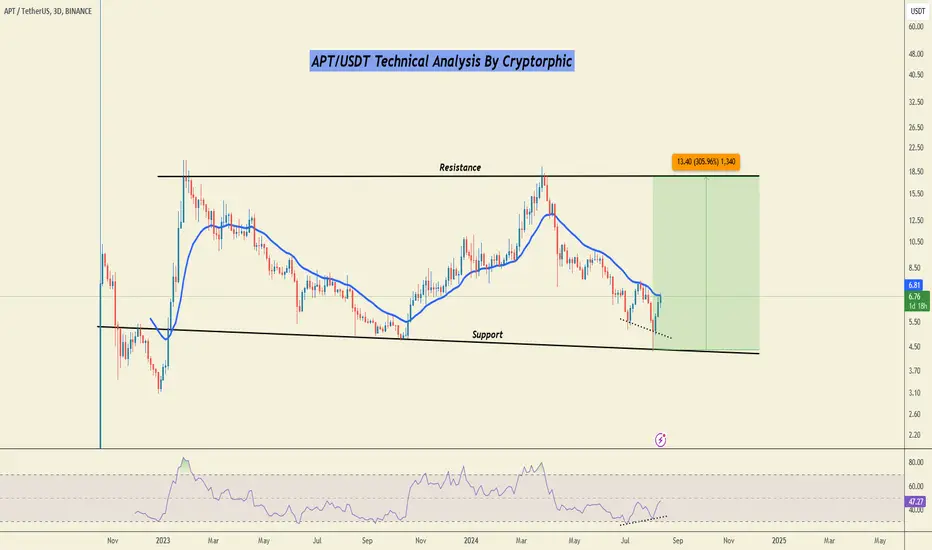
APT Technical Analysis in a 3-Day TimeframeHello everyone, I’m Cryptorphic.
For the past seven years, I’ve been sharing insightful charts and analysis.
Follow me for:
~ Unbiased analyses on trending altcoins.
~ Identifying altcoins with 10x-50x potential.
~ Futures trade setups.
~ Daily updates on Bitcoin and Ethereum.
~ High time frame (HTF) market bottom and top calls.
~ Short-term market movements.
~ Charts supported by critical fundamentals.
Now, let’s dive into this chart analysis:
APT is in a downtrend with strong support at the $4.4 trendline. The price is currently facing resistance at the 21 EMA, and if it closes above this level, we can expect a bullish rally toward $15-$18.
If APT faces rejection, the $4.4 support level should still hold the price.
The RSI has formed a bullish divergence and is acting accordingly.
Key levels:
- Primary Resistance: $6.8
- Support: $4.4
- Target: $15-$18
DYOR, NFA.
Please hit the like button to support my content and share your thoughts in the comment section. Feel free to request any chart analysis you’d like to see!
Thank you!
#PEACE
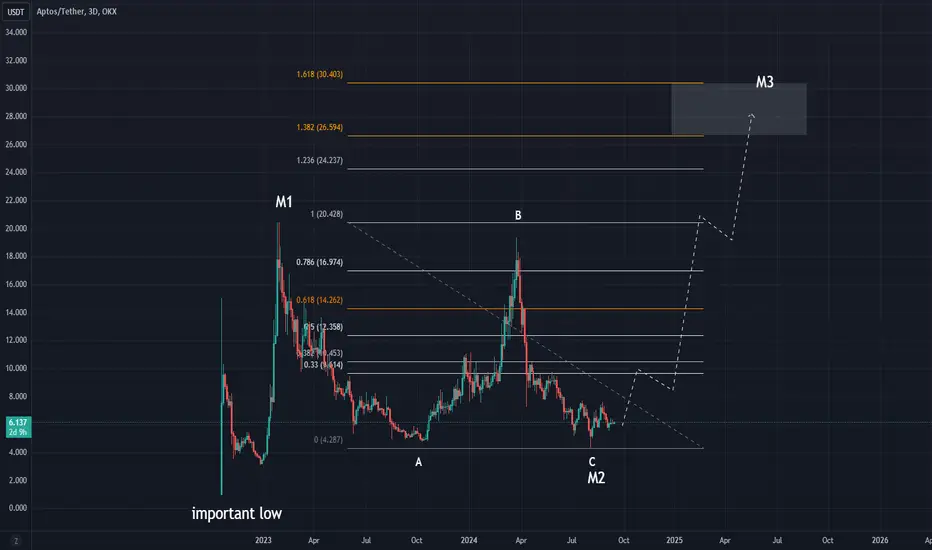
#Aptos #APT price will repeat the #SUI maneuver?Today, we are talking about #Aptos, which is the counterpart to #Sui which we analyzed yesterday
Both projects are followers of the #Diem project from #META, which regulators did not allow making a breakthrough in the crypto world a few years ago.
While OKX:SUIUSDT price has already reached a powerful mirror zone yesterday, OKX:APTUSDT seems to have everything ahead of it.
When #APT price will be $7.50-8, you may wonder whether it is worth keeping the coin in your crypto portfolio.
_____________________
Did you like our analysis? Leave a comment, like, and follow to get more

This Aptos Setup Could Trigger a Massive Move – Are You Ready?Yello! Is #Aptos ( AMEX:APT ) gearing up for a breakout, or are we staring at a looming drop? Let's look at the latest analysis of APTUSDT:
💎The current setup has APT compressed within a classic falling wedge pattern—a well-known bullish reversal signal. But why do we believe a breakout might be imminent? The signs are clear: increasing trading volume and a favorable shift in macro market sentiment.
💎Yet, trading isn't just about expectations—it's about preparation. So, what's our Plan B? If Aptos faces rejection at the upper trend line of the wedge, we could see a retest of the critical support zone around $4.87-$5.31. This level has consistently acted as a safety net, rich in liquidity and offering solid support.
💎But what if APT fails to bounce back from this zone? The next level we’re watching is $4.31. Historically, this has been a stronghold for Aptos, with a high probability of a rebound.
💎However, the stakes are high. If Aptos breaks below these key support levels, we might see the bears seize control, leading to a potential bearish continuation.
Stay focused, patient, disciplined, and always keep your eyes on the prize
MyCryptoParadise
iFeel the success🌴

APTUSDT: Bullish Move on the HorizonAPTUSDT Technical analysis update
APT price is trading within a descending channel and is now moving toward a potential breakout. Before the breakout, we can expect a small pullback. Once the breakout occurs, a strong bullish move is anticipated.
Buy level: after the breakout confirmation.
Regards
Hexa
