#APT/USDT#APT
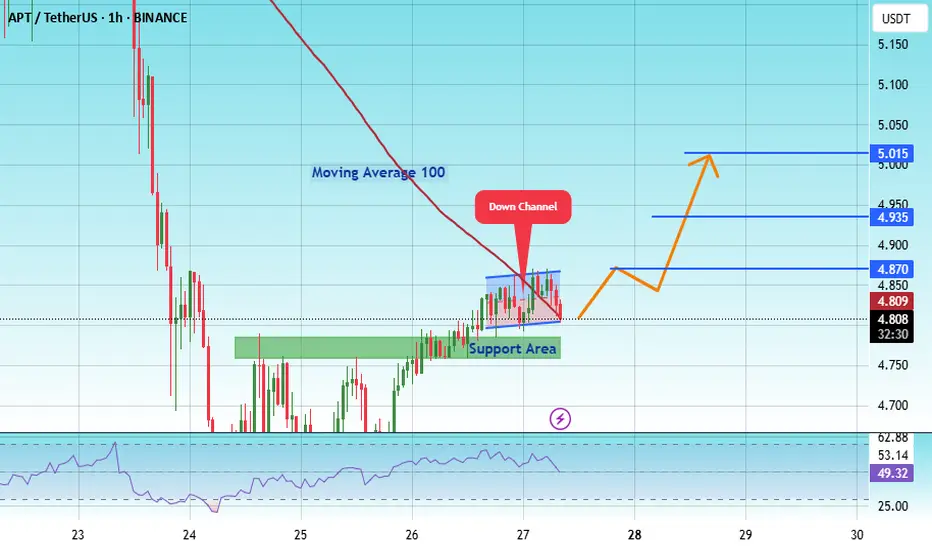
The price is moving within an ascending channel on the 1-hour frame, adhering well to it, and is on track to break it strongly upwards and retest it.
We have support from the lower boundary of the ascending channel, at 0.1560.
We have a bearish trend on the RSI indicator that is about to brea
Related pairs
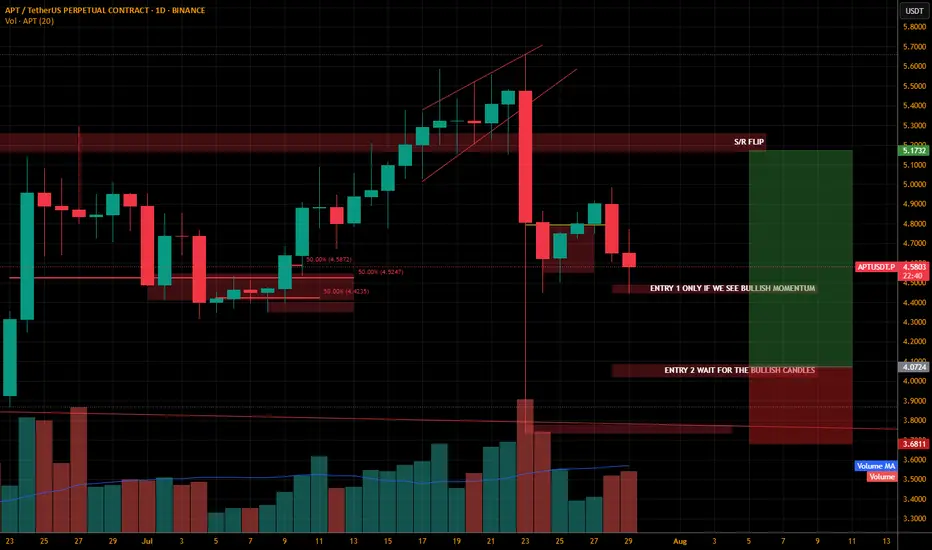
APTUSDT.PThis coin is also sleeping can be the bottom of the coin.
Lets wait for the bullish confirmation always wait.. patience is the game changer. Always wait for the confirmation on the entry level. Just dont take trade as soon the price touches the level we need to wait for the confirmation ALWAYS..
5/Altseason Live Psychology:My Core Principle,Learned Over Years
This experience is built on analyzing every previous altseason. And here is the main takeaway: altseasons are always short, but incredibly rapid. In this chaos, most people, driven by emotion, make the same mistakes:
- They open too many trades.
-They close a position on the first small move, ho

APT : Long term purchaseHello friends🙌
👀You see that the price is in a range and now we are at the bottom of the range. The scenario is simple. The bottom of the range is a good buying opportunity that can be used because 80% of the failures in the range are fake.
⚠So we can buy with risk and capital management and move

Aptos (APT): Buyers Need To Establish Support ZoneAPT is near a local support area where we will be looking now for some sort of upward bounce from here. We might see a smaller move to lower zones (towards the liquidity line below).
Now, as long as we are between those zones, we wait but overall, what we want to see is break of structure and prop

APT : Did the buyers arrive?Hello friends🙌
📈An ascending channel and then a descending channel and then an ascending channel.📉
✔The point is that when the price entered an ascending channel, your price entered and with a failure it entered a descending channel and you exited with a loss and again when the price is at the pea

APTOS LONG- Price at the bottom, only one way UP
- BTC.D , STABLECOIN.D , OTHERS.D , OTHERS MC crypto atmosphere is green
- Good RR
- BUY current price or wait as picture.
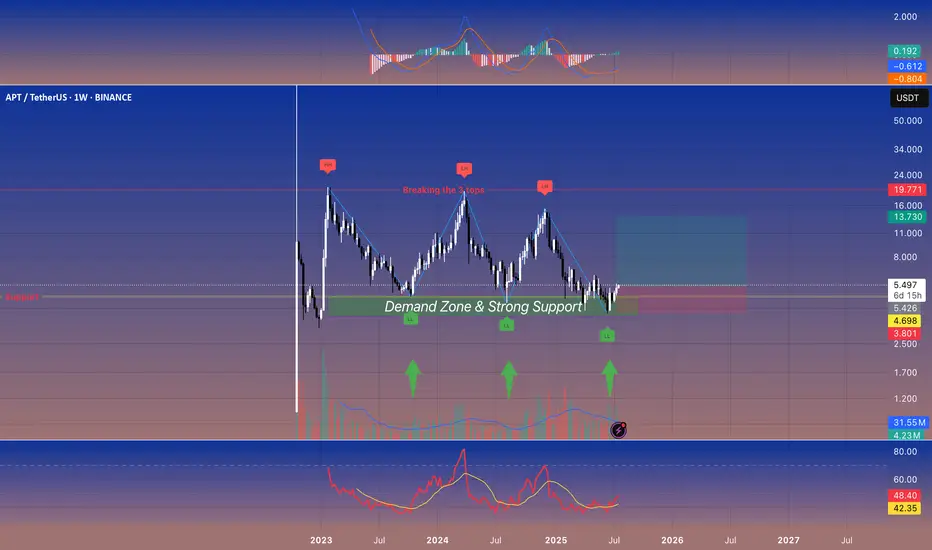
Aptos: The Sleeping Giant🚀 Aptos: The Sleeping Giant 😴🌋
APT keeps bouncing off a rock‑solid \~\$5 demand zone. If it finally pops above \~\$7.5‑8, the giant could wake up in a hurry. 📈
---
👀 Quick‑Glance Weekly Checklist
| 🔍 Focus | What’s Happening
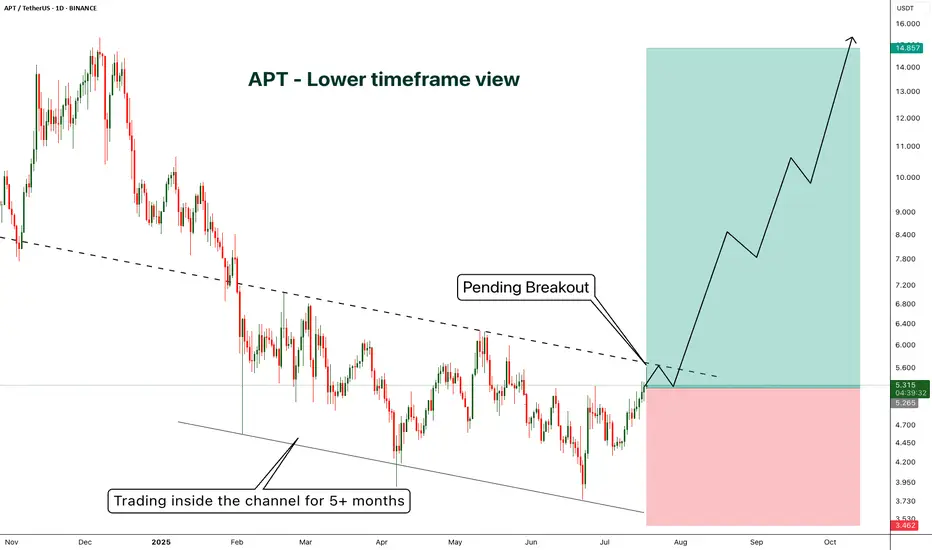
APT - A lower timeframe view - Breakout Entry- On 1D candle, APT is still trading inside the channel
- currently price is trading near the resistance and got rejected from the resistance as expected.
- I'm expecting few more candles near the resistance zone before breakout.
If we look at the higher timeframe (1W) view we shared earlier, the
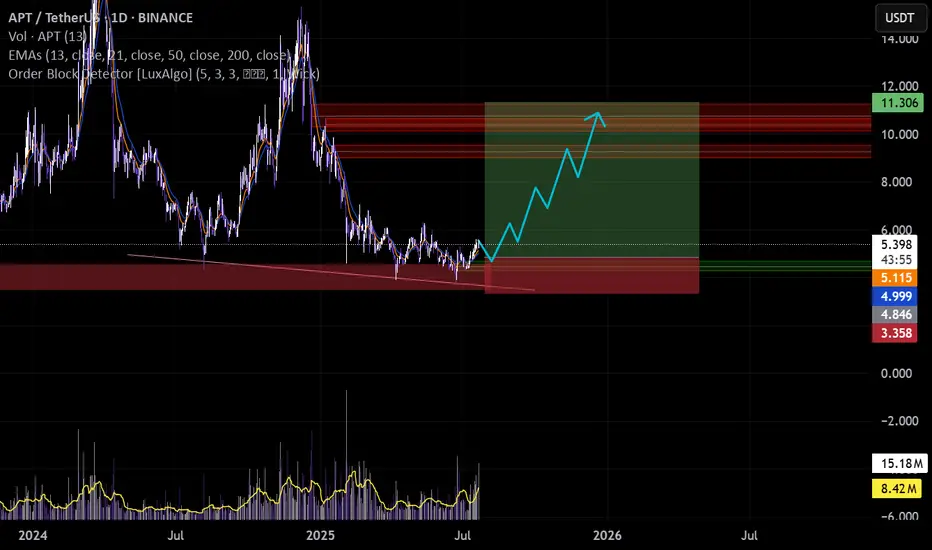
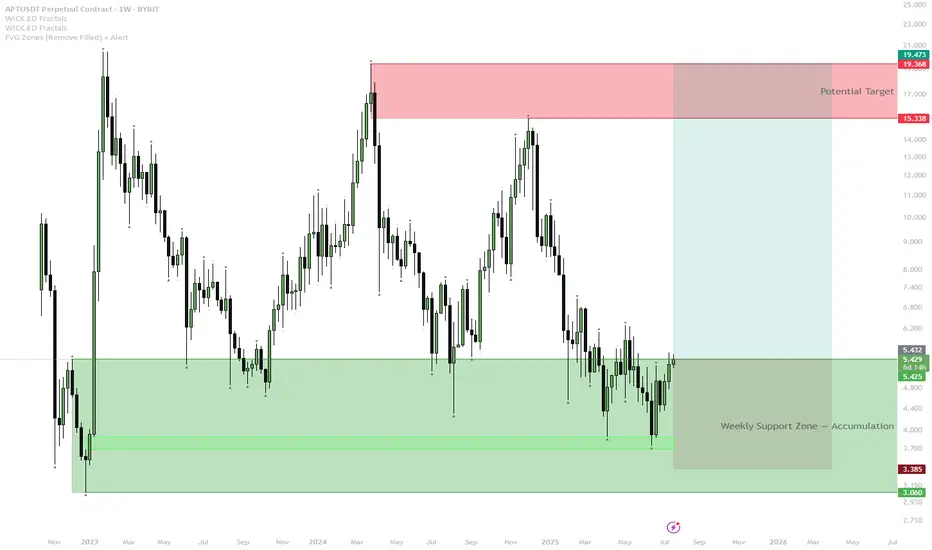
APTOS Weekly Bottom Formation — Early Signs of Reversal
APT has retested and held the long-term weekly support zone (green box) multiple times, confirming strong demand and buyer defense.
Current price action is pushing off the support with a series of higher lows, suggesting the start of a new bullish cycle.
Scenario A (Bullish):
— If APT holds ab
See all ideas
Summarizing what the indicators are suggesting.
Oscillators
Neutral
SellBuy
Strong sellStrong buy
Strong sellSellNeutralBuyStrong buy
Oscillators
Neutral
SellBuy
Strong sellStrong buy
Strong sellSellNeutralBuyStrong buy
Summary
Neutral
SellBuy
Strong sellStrong buy
Strong sellSellNeutralBuyStrong buy
Summary
Neutral
SellBuy
Strong sellStrong buy
Strong sellSellNeutralBuyStrong buy
Summary
Neutral
SellBuy
Strong sellStrong buy
Strong sellSellNeutralBuyStrong buy
Moving Averages
Neutral
SellBuy
Strong sellStrong buy
Strong sellSellNeutralBuyStrong buy
Moving Averages
Neutral
SellBuy
Strong sellStrong buy
Strong sellSellNeutralBuyStrong buy
Displays a symbol's price movements over previous years to identify recurring trends.
Frequently Asked Questions
The current price of APT / TetherUS (APT) is 4.110 USDT — it has fallen −0.54% in the past 24 hours. Try placing this info into the context by checking out what coins are also gaining and losing at the moment and seeing APT price chart.
APT / TetherUS price has fallen by −11.49% over the last week, its month performance shows a −11.26% decrease, and as for the last year, APT / TetherUS has decreased by −35.88%. See more dynamics on APT price chart.
Keep track of coins' changes with our Crypto Coins Heatmap.
Keep track of coins' changes with our Crypto Coins Heatmap.
APT / TetherUS (APT) reached its highest price on Oct 19, 2022 — it amounted to 100.000 USDT. Find more insights on the APT price chart.
See the list of crypto gainers and choose what best fits your strategy.
See the list of crypto gainers and choose what best fits your strategy.
APT / TetherUS (APT) reached the lowest price of 1.000 USDT on Oct 19, 2022. View more APT / TetherUS dynamics on the price chart.
See the list of crypto losers to find unexpected opportunities.
See the list of crypto losers to find unexpected opportunities.
The safest choice when buying APT is to go to a well-known crypto exchange. Some of the popular names are Binance, Coinbase, Kraken. But you'll have to find a reliable broker and create an account first. You can trade APT right from TradingView charts — just choose a broker and connect to your account.
Crypto markets are famous for their volatility, so one should study all the available stats before adding crypto assets to their portfolio. Very often it's technical analysis that comes in handy. We prepared technical ratings for APT / TetherUS (APT): today its technical analysis shows the sell signal, and according to the 1 week rating APT shows the strong sell signal. And you'd better dig deeper and study 1 month rating too — it's sell. Find inspiration in APT / TetherUS trading ideas and keep track of what's moving crypto markets with our crypto news feed.
APT / TetherUS (APT) is just as reliable as any other crypto asset — this corner of the world market is highly volatile. Today, for instance, APT / TetherUS is estimated as 5.93% volatile. The only thing it means is that you must prepare and examine all available information before making a decision. And if you're not sure about APT / TetherUS, you can find more inspiration in our curated watchlists.
You can discuss APT / TetherUS (APT) with other users in our public chats, Minds or in the comments to Ideas.