Crypto Market - 1 month (30 days) left until #ALTSZN endsSometimes, the market forces you to take a pause. The last few weeks have been exactly that for me. Health issues knocked me off my game, and my first thought, of course, was that it was due to the nerves and immense responsibility of this public #AltsznLive experiment. But after some self-reflectio
Related pairs

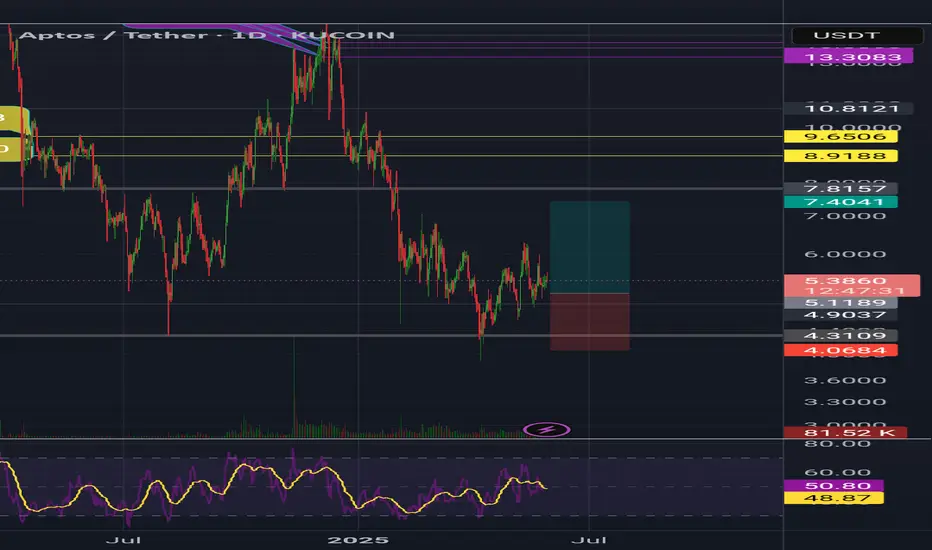
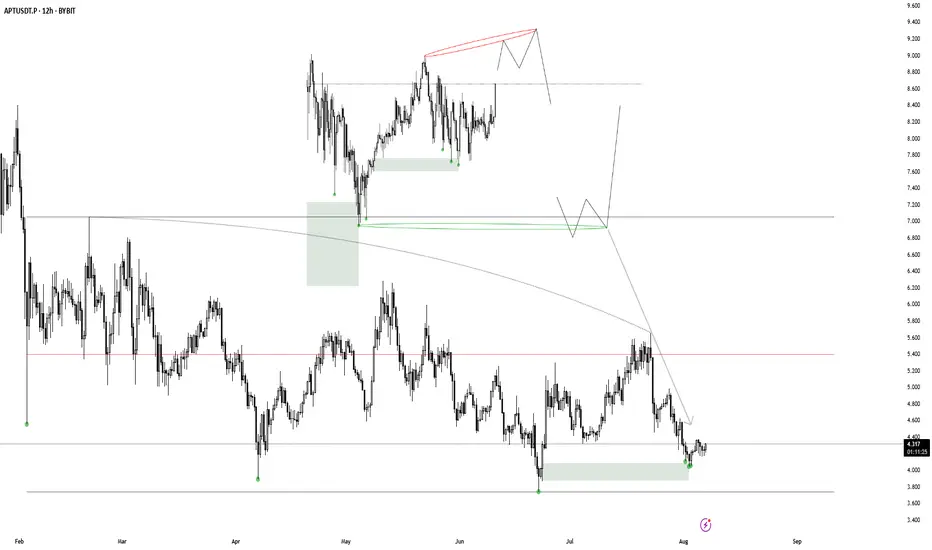
Aptus Apt usdt Daily analysis
Time frame daily
Risk rewards ratio >2 👈👌
Target 7.4$
Pattern = two bottom
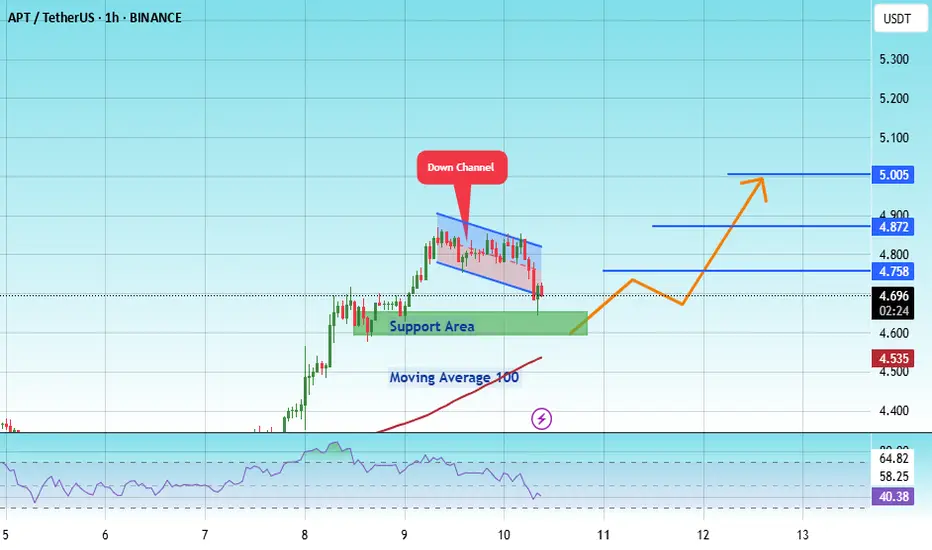
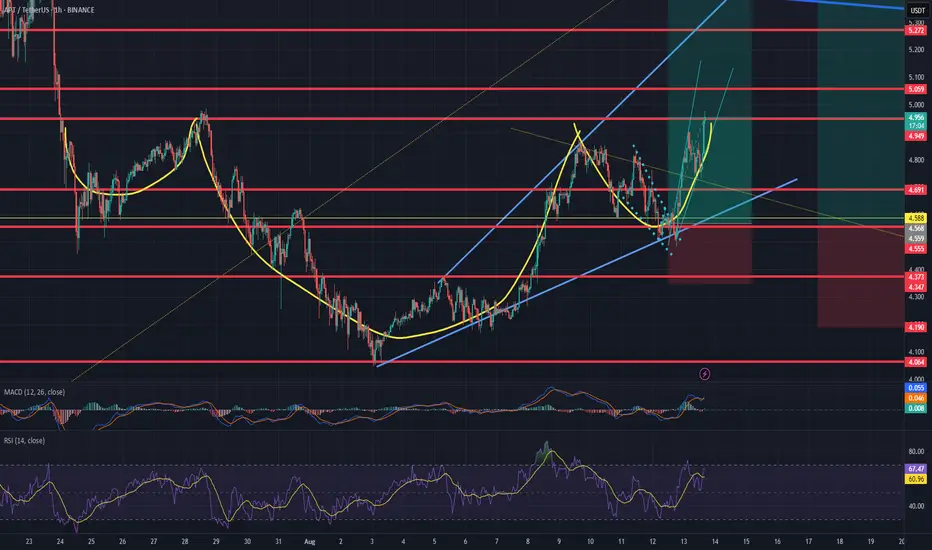
#APT/USDT Buyers Need To Establish Support Zone#APT
The price is moving within an ascending channel on the 1-hour frame, adhering well to it, and is on track to break it strongly upwards and retest it.
We have support from the lower boundary of the ascending channel, at 4.68.
We have a downtrend on the RSI indicator that is about to break and
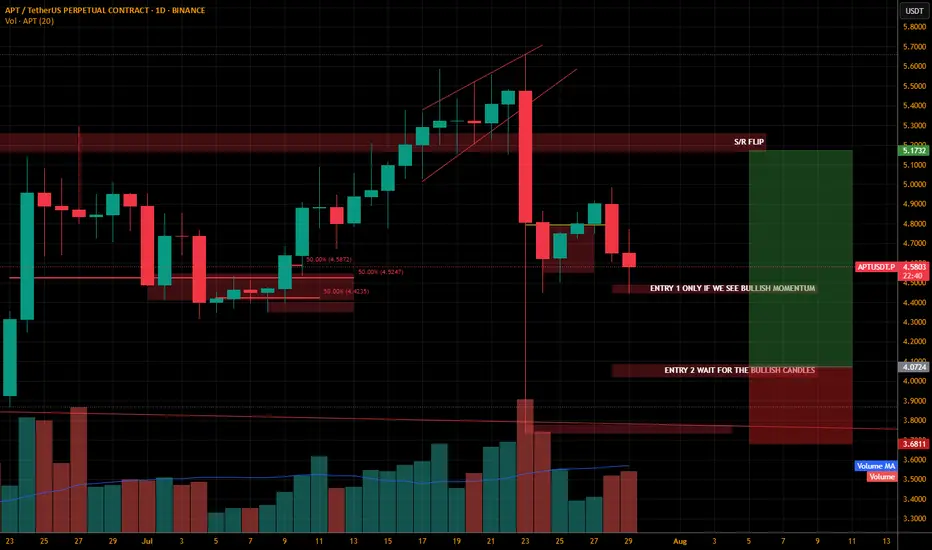
APT/USDT – Price Tests Critical Historical Demand Zone!📌 Quick Summary:
APT is now at a crucial technical crossroad. After a prolonged downtrend from its previous highs, price action is once again testing the strong demand zone that historically acted as a key accumulation area. Is this the start of a new rally, or a breakdown toward uncharted lows?
-
Feeling Optimistic About $APTI know… it’s been over 8 months. And truth be told, AMEX:APT and I have had our ups and downs—especially between June and Oct 2023. Our relationship isn’t perfect.
But right now? This is a great technical spot. Trend is still technically down, but we’re finally seeing signs of a reversal into a k
APT Accumulation pt.3I am watching this for ages now. At the current state it's an extended model 1 that went over in a model 2. If it wants to create a bigger range here then it would be fine, as long as the 3rd tap stays intact.
Aptos (APT): Zone of Liquidity or Zone of Breakout? APT seems to form a double bottom pattern here, where we are looking for a proper breakout of that neckline zone, after which we are going to look for a long position here as well!
Swallow Academy
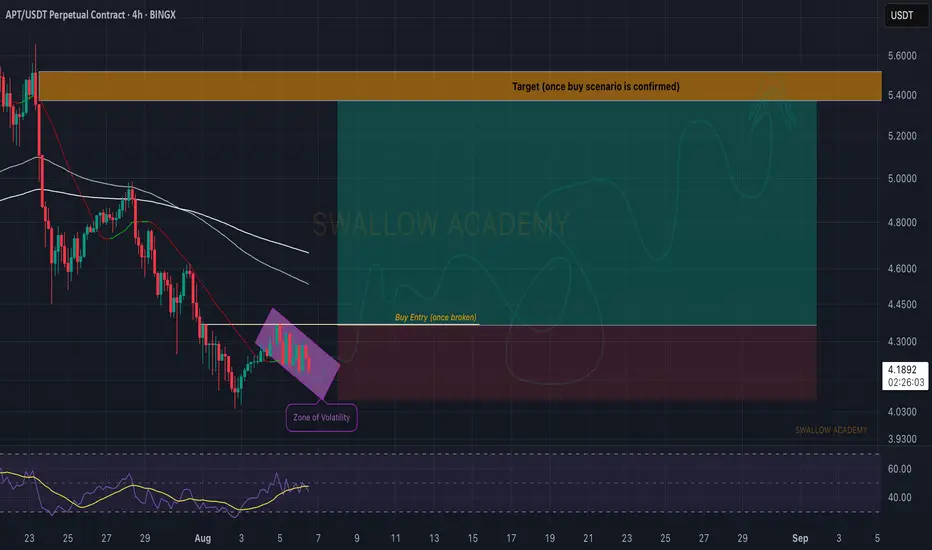
Apt/usdt Bull Analysis AMEX:APT holders will be smiling very soon ❤️
AMEX:APT is forming a beautiful rounded bottom, showing signs of a potential trend reversal. 📈
I’ll be watching closely for a breakout above the descending trendline — but my entry will only be on confirmation in the marked red zone.
If it plays
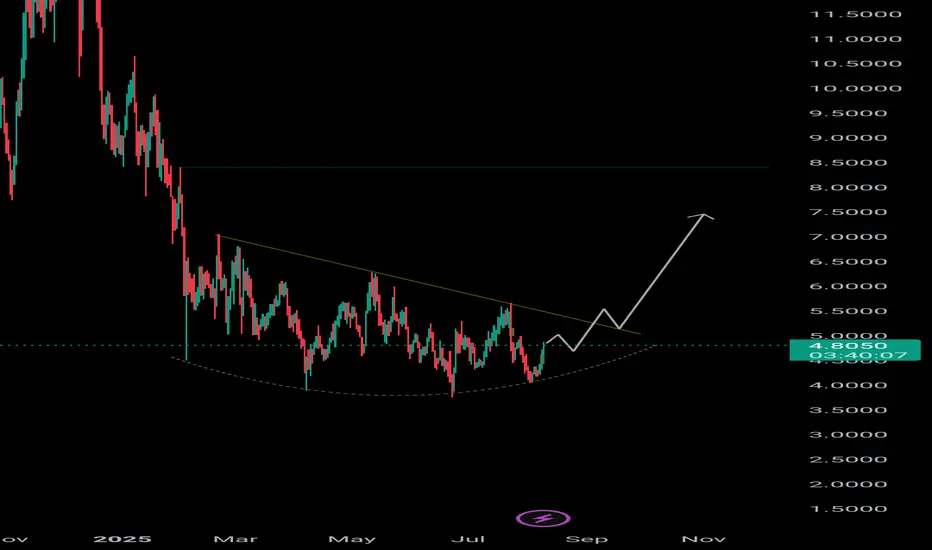
APTUSDT.PThis coin is also sleeping can be the bottom of the coin.
Lets wait for the bullish confirmation always wait.. patience is the game changer. Always wait for the confirmation on the entry level. Just dont take trade as soon the price touches the level we need to wait for the confirmation ALWAYS..
APTOS Head and Shoulder + Elliot 5 wave - BullishAptos can be seen forming a Reverse Head and Shoulder pattern - heading towards a break - this could be bullish signal + 5 Elliot wave it just form on a 4hours chard
See all ideas
Summarizing what the indicators are suggesting.
Oscillators
Neutral
SellBuy
Strong sellStrong buy
Strong sellSellNeutralBuyStrong buy
Oscillators
Neutral
SellBuy
Strong sellStrong buy
Strong sellSellNeutralBuyStrong buy
Summary
Neutral
SellBuy
Strong sellStrong buy
Strong sellSellNeutralBuyStrong buy
Summary
Neutral
SellBuy
Strong sellStrong buy
Strong sellSellNeutralBuyStrong buy
Summary
Neutral
SellBuy
Strong sellStrong buy
Strong sellSellNeutralBuyStrong buy
Moving Averages
Neutral
SellBuy
Strong sellStrong buy
Strong sellSellNeutralBuyStrong buy
Moving Averages
Neutral
SellBuy
Strong sellStrong buy
Strong sellSellNeutralBuyStrong buy
Displays a symbol's price movements over previous years to identify recurring trends.
Frequently Asked Questions
The current price of APTOS/USD TETHER (APT) is 4.957 USDT — it has risen 2.66% in the past 24 hours. Try placing this info into the context by checking out what coins are also gaining and losing at the moment and seeing APT price chart.
APTOS/USD TETHER price has risen by 15.34% over the last week, its month performance shows a 0.10% increase, and as for the last year, APTOS/USD TETHER has decreased by −23.02%. See more dynamics on APT price chart.
Keep track of coins' changes with our Crypto Coins Heatmap.
Keep track of coins' changes with our Crypto Coins Heatmap.
APTOS/USD TETHER (APT) reached its highest price on Dec 7, 2024 — it amounted to 15.314 USDT. Find more insights on the APT price chart.
See the list of crypto gainers and choose what best fits your strategy.
See the list of crypto gainers and choose what best fits your strategy.
APTOS/USD TETHER (APT) reached the lowest price of 3.745 USDT on Jun 22, 2025. View more APTOS/USD TETHER dynamics on the price chart.
See the list of crypto losers to find unexpected opportunities.
See the list of crypto losers to find unexpected opportunities.
The safest choice when buying APT is to go to a well-known crypto exchange. Some of the popular names are Binance, Coinbase, Kraken. But you'll have to find a reliable broker and create an account first. You can trade APT right from TradingView charts — just choose a broker and connect to your account.
Crypto markets are famous for their volatility, so one should study all the available stats before adding crypto assets to their portfolio. Very often it's technical analysis that comes in handy. We prepared technical ratings for APTOS/USD TETHER (APT): today its technical analysis shows the buy signal, and according to the 1 week rating APT shows the neutral signal. And you'd better dig deeper and study 1 month rating too — it's sell. Find inspiration in APTOS/USD TETHER trading ideas and keep track of what's moving crypto markets with our crypto news feed.
APTOS/USD TETHER (APT) is just as reliable as any other crypto asset — this corner of the world market is highly volatile. Today, for instance, APTOS/USD TETHER is estimated as 5.84% volatile. The only thing it means is that you must prepare and examine all available information before making a decision. And if you're not sure about APTOS/USD TETHER, you can find more inspiration in our curated watchlists.
You can discuss APTOS/USD TETHER (APT) with other users in our public chats, Minds or in the comments to Ideas.