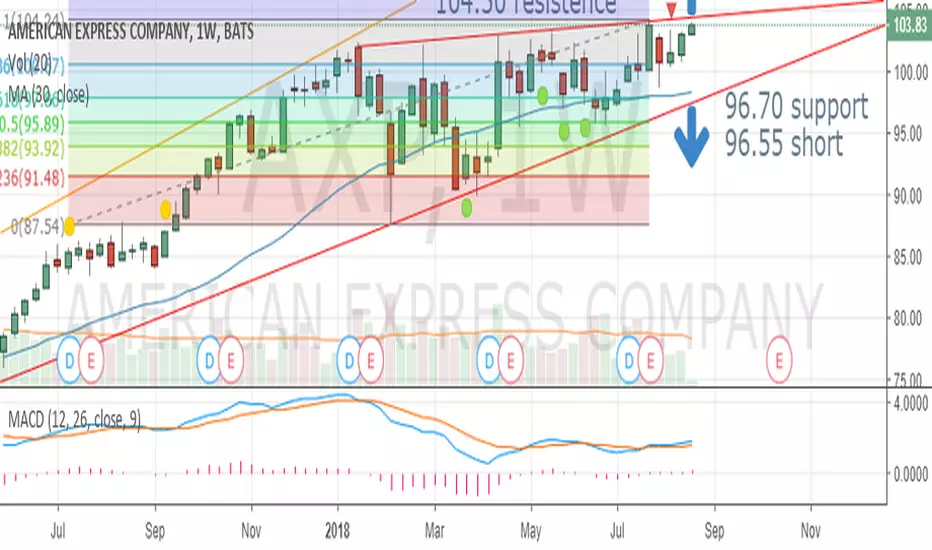
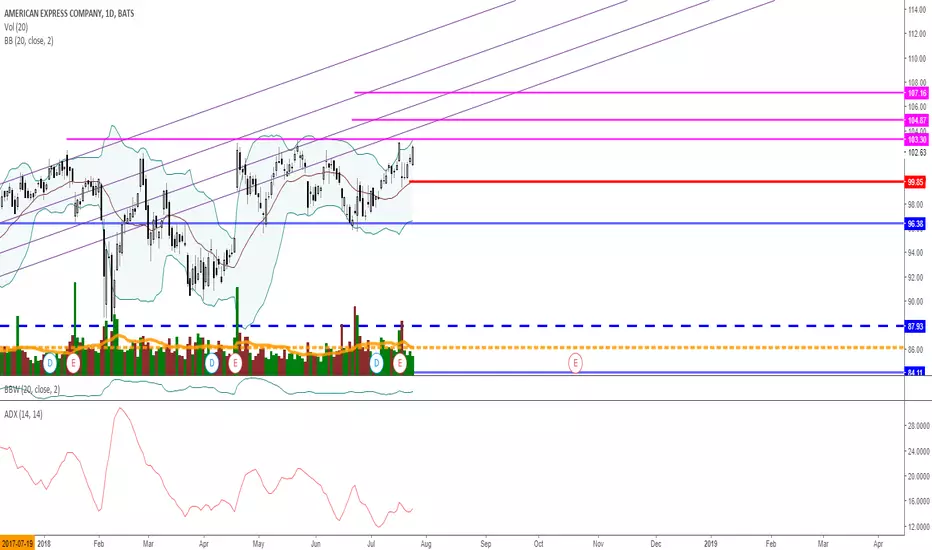
AXP testing resistance lineI see in the last three weeks have been bullish and we are testing a 104.50, resistance line tested many times dated back to 2014. There is bullish indications of current trading above it's 30 wk MA. MACD is positive, but not very large and MA cross 3 weeks ago. It all indicates that it turning bullish but not a very strong. I would like to see a greater buying volume going past 104.50 resistance line to for it to be a stronger buy indication.
AEC1D trade ideas
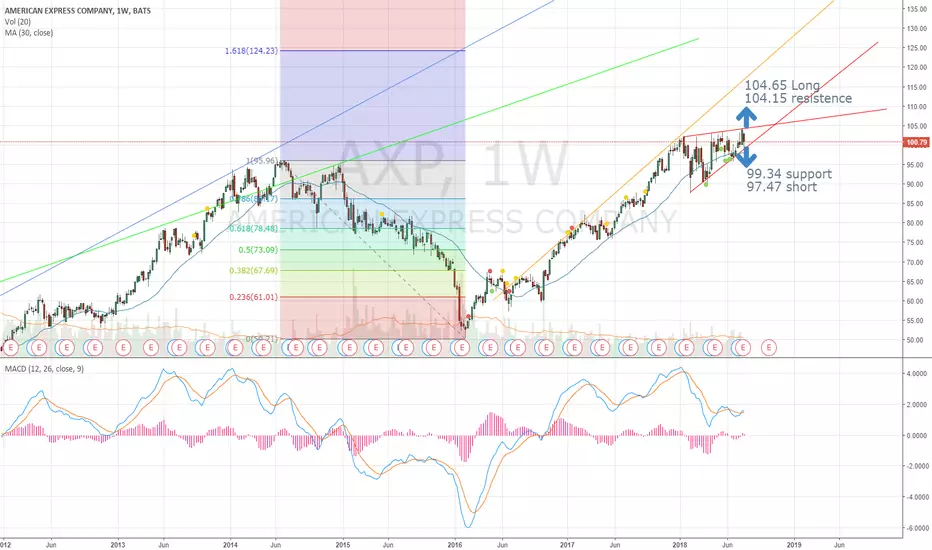
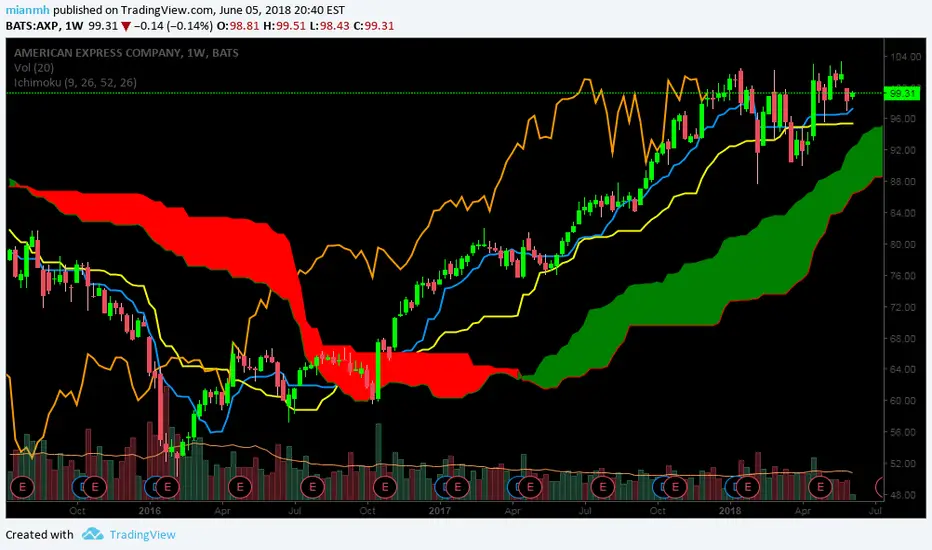
AXP approaching either a Bull or Bear LongMy techinical observations with no holdings in stocks. On the weekly MA (30) was in a bullish positive slope but steadly decreasing. The trading range has establishing a closing pendant with support at 99.34 and resistance at 104.15 for next week. Breaking of either is going to tell whether this is going to be bullish or bearish. The slow MACD currently saying bearish and will indicate bearish when trading range crosses the MA (30) 98.02. MACD is on a bearish path and area below MACD is closing along with crossing zero to go below zero belonging to bearish trading.
$AXP strong daily and weekly chart. Just breaking above resitanc$AXP strong daily and weekly chart. Just breaking above resistance. Payment space is hot. $V $SQ $PYPL $QTWO
AXP - New Highsimple setup
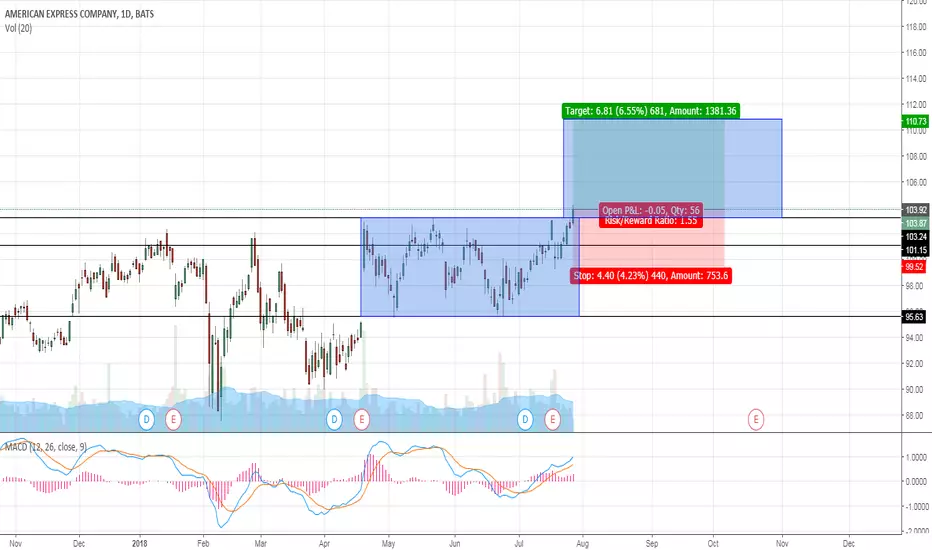
after a nice consolidation at the highs price broke above resistance at 104 and looks god for a small rally
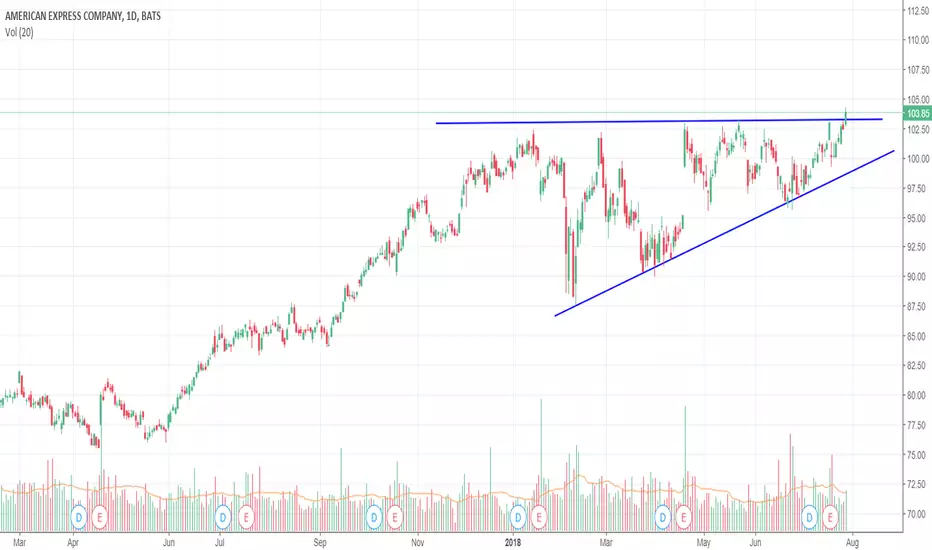
rectangle breakout
stop located below 100 and target at 111


long termwait for a pull back upto 26 day and if it respects , then to buy as if it respects the 26 day it will have a continued uptrend.


5th time must be charm for breakout.Thank you Dodd Frank reform. Calls will 10 and 20x returns when this breaks.

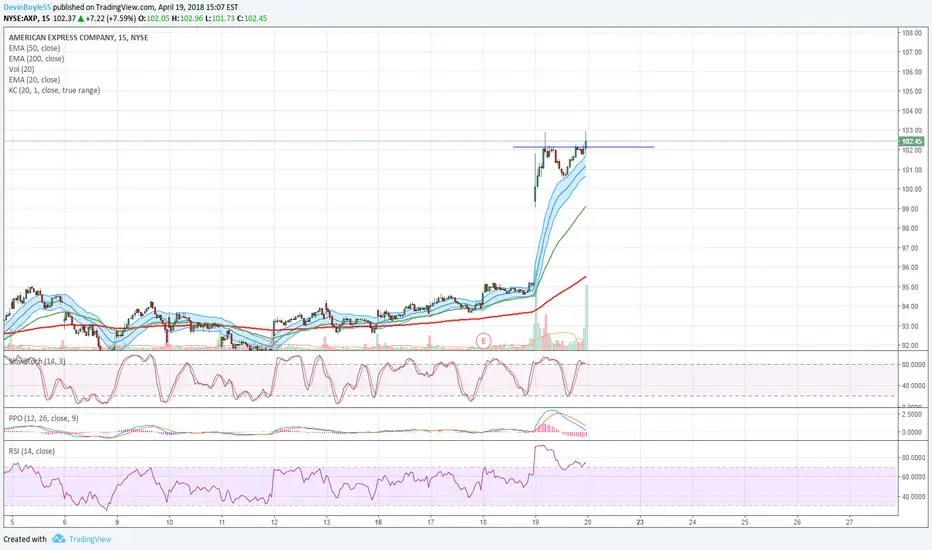
$AXP $AXP is forming a bullish ascending triangle (similar to the $NKE break out pattern I posted last week) after a strong gap up a couple weeks ago closing at ATHs. Look for a solid candle closing above $102 for entry spot or a re-test and old of the $100 level. Target levels are 106, 112, and 126.

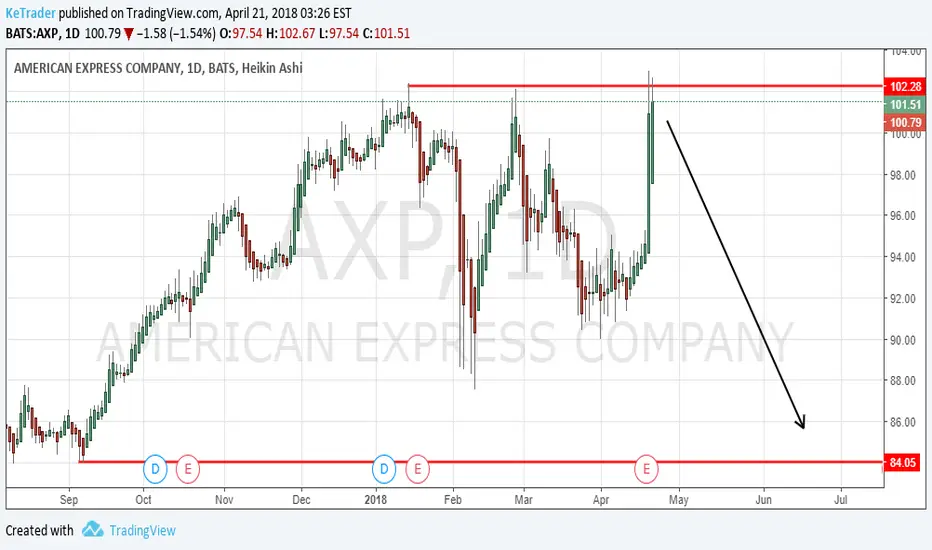
AXP - Short IdeaWatch for intraday weakness. Bearish entry below $99.50 Target $92.25 @ 50 MA .Stop = 101.02

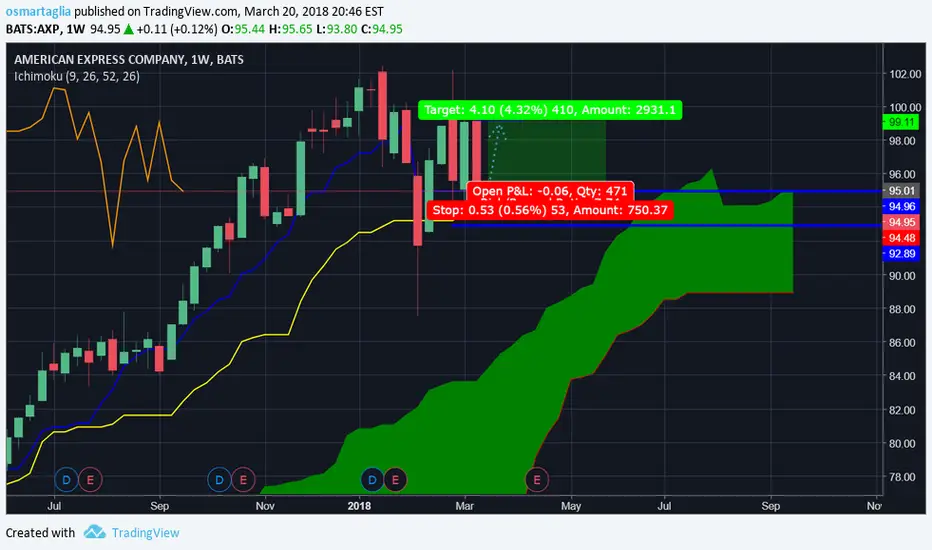
AXP could head back to 102 The large gap between 95 to 99 is now filled. AXP will probably goes sideways before heading to 102.


$AXP Strong into close$AXP closed the day breaking through the intraday resistance of $102.15 on strong volume. Expecting another leg up in short term.
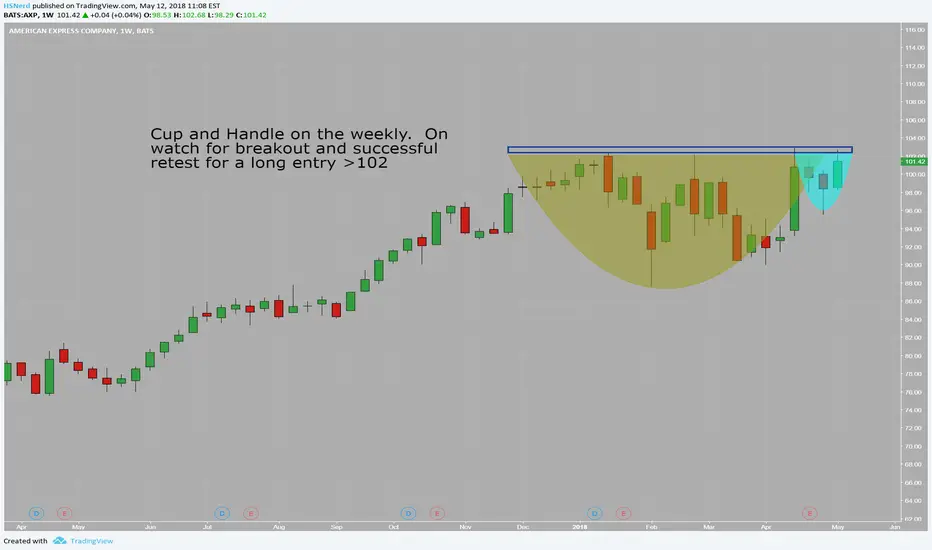
AXP Cup and HandleNot the cleanest but I would still call it one. WIth todays move and the market, looks like it can head to 87.50 where the cup started.