New Setup : $AAPLThe daily chart sees a bullish ATR Break together with a bullish crossover and a pullback on the ema50.
There is even a strong rejection to that level. We are still waiting for the confirmation but it looks great !
APCD trade ideas
AAPL: 202.92Bullish Entry: Level: 206.00 / 208.00 Target 210.00 Stop 206.00 Bearish Entry: 200.00/198.00 Stop 201.00 Target 196.00

APPLE INC. STOCK FORMING BEARISH TREND MARKET STRUCTUREApple Inc. (AAPL) Stock Developing Bearish Structure in 4-Hour Chart - Key Levels to Watch
Technical analysis of Apple Inc.'s (AAPL) 4-hour chart reveals a concerning bearish trend formation that traders should monitor closely. The recent price action has shown strong selling pressure, confirmed by multiple large bearish candlesticks that indicate aggressive seller participation. This pattern suggests the stock is likely to maintain its downward trajectory in the near term unless significant buying pressure emerges.
Critical Price Levels and Market Structure
The current technical setup presents two crucial reference points for traders:
1. Downside Target at 172.00 - This level represents the next major support zone where we might see either:
- A potential pause in the downtrend
- Acceleration of selling if broken decisively
2. Upper Resistance at 226.00 - This price level now serves as a key ceiling for any bullish recovery attempts. A sustained move above this resistance would be required to invalidate the current bearish outlook.
Trading Dynamics and Key Observations
- The formation of consecutive lower highs and lower lows confirms the bearish structure
- Volume analysis shows increasing activity during down moves, supporting the bearish case
- Momentum indicators (RSI, MACD) are favoring sellers in the current market environment
Strategic Considerations for Traders
For those considering short positions:
- Ideal entry points would be on pullbacks toward recent resistance levels
- Conservative traders may wait for confirmation of rejection at 226.00 before entering
- Protective stops should be placed above key resistance levels
For potential buyers:
- Caution is advised until clear reversal signals appear
- The 172.00 level may offer a potential bounce opportunity if supported by volume
Risk Management Notes
Traders should remain vigilant for:
- Unexpected fundamental developments (earnings reports, product announcements)
- Sudden shifts in broader market sentiment
- Potential support at psychological levels (175.00, 170.00 round numbers)
The current technical picture suggests maintaining a bearish bias unless price action shows convincing signs of reversal, particularly through a sustained break above the 226.00 resistance level. As always, proper position sizing and risk management remain crucial in navigating this potentially volatile setup.

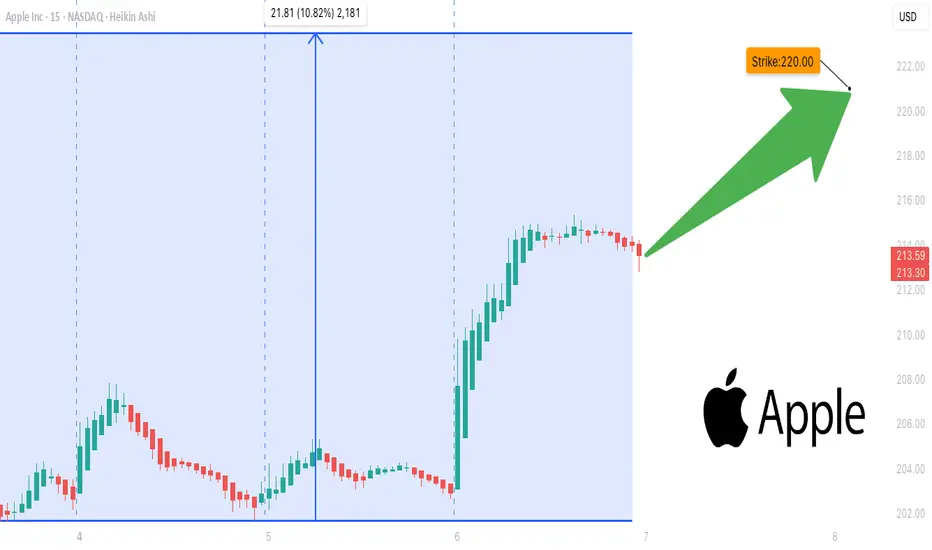
AAPL Bulls Ready to Strike## 🍎 AAPL Bulls Ready to Strike? 🚨 Weekly Options Loading...
**Call at \$220 → Entry \$0.66 → Target \$1.32 💰💰**
---
**🧠 AI Consensus Highlights:**
✔️ Strong Options Flow 📈
✔️ Institutional Volume Spike
⚠️ Caution: Bearish Daily RSI
🔀 Mixed Sentiment = Selective Entries Only
---
**🔥 Featured Trade Setup:**
* 📍 **Strike:** \$220 Call
* 💵 **Entry:** \$0.66
* 🎯 **Target:** \$1.32
* 🛑 **Stop:** \$0.33
* 📅 **Expiry:** Aug 8
* 📈 **Confidence:** 65%
* ⏰ **Entry Timing:** Open
---
**⚔️ Model Breakdown (AI Models):**
* **Grok & Claude:** Bullish → Call Recommended
* **DeepSeek & Gemini:** Cautious → No Entry
* **Meta:** Mixed → Watch RSI & Gamma Sensitivity
---
**🧠 Strategy:**
Scalp the weekly upside using a tight stop-loss + profit lock. Timing is key with high gamma volatility expected post-earnings.
---
**📛 Tags for TradingView Post:**
\#AAPL #OptionsAlert #AppleStock #EarningsPlay #CallOptions #WeeklySetup #TradingStrategy #OptionsFlow #BullishSetup #TechStocks #AITrading #InstitutionalFlow #MarketAnalysis
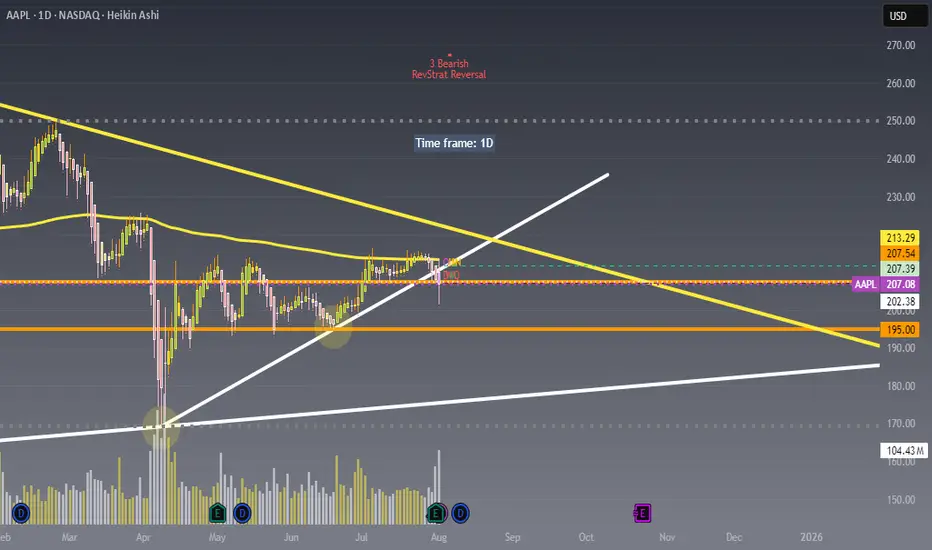
Watching AAPL closely here !!!Not financial advice – just sharing my outlook. 📉📈
Price is currently rejecting the upper trendline resistance around $213 and struggling to hold above the $207-$208 zone.
Looking for potential puts as long as price remains under this key resistance area.
Will be buying the dip near the $195 or $185 zone where strong demand and trendline support intersect.
Key levels :
Resistance: $213.29 / $207.54
Support: $202.38 / $195.00
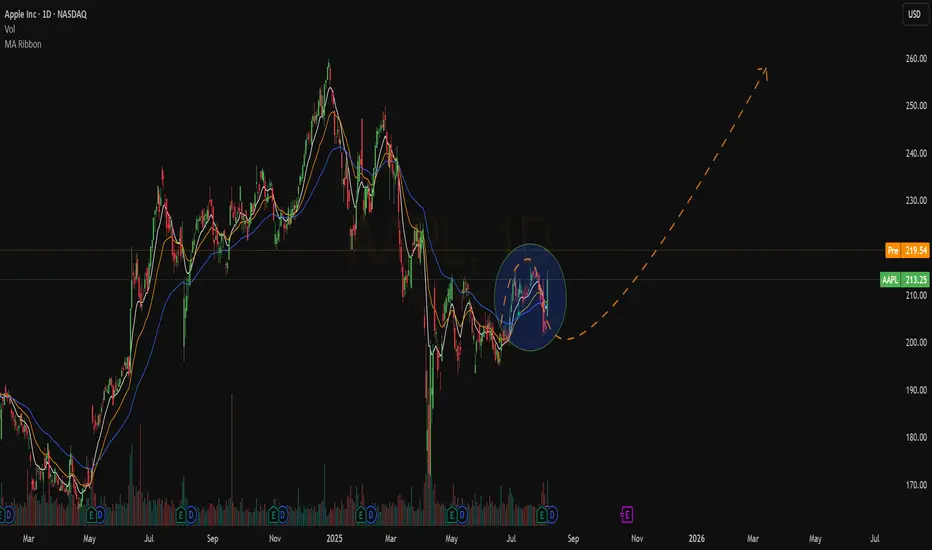
APPLE: Bullish Forecast & Bullish Scenario
The charts are full of distraction, disturbance and are a graveyard of fear and greed which shall not cloud our judgement on the current state of affairs in the APPLE pair price action which suggests a high likelihood of a coming move up.
Disclosure: I am part of Trade Nation's Influencer program and receive a monthly fee for using their TradingView charts in my analysis.
❤️ Please, support our work with like & comment! ❤️

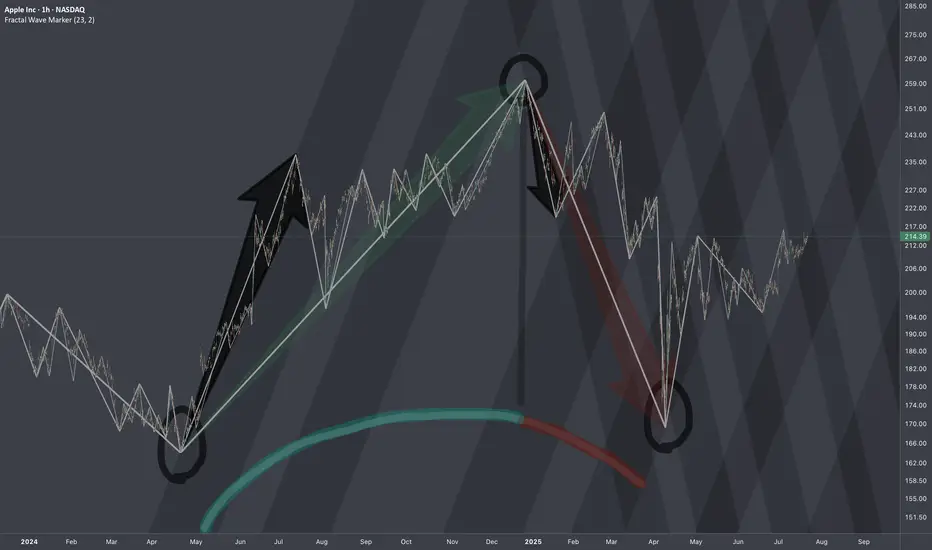
$AAPL: Structure SurgeryResearch Notes
Original Structure:
Altering structure for experimental purposes
Angle of fib channels that rises from cycle low, has been pushed into the past to the top of first major reaction. blue area resembles the change
Reason
The the angle of Fibonacci channels which cover the general decline (from perspective of ATH to end of cycle), are adjusted to the angle of the first bear wave of smaller scale.
Therefore, when it comes to measurements of opposing forces for working out interference pattern, having this symmetric approach of mapping interconnections is fair.
AAPL: 202.38Bullish Entry: 206.00 / 208.00 Stop 202.00 Bullish Target: 210.00 / 213.00
Bearish Entry: 200.00 / 198.00 Stop 202.00 Bearish Target: 196.00 / 194.00

Since December, Apple LOST 37% of its value (priced in silver).Since December, Apple LOST 37% of its value (priced in silver).
You should NOT be seeing this happen in a bull era for the tech giant.


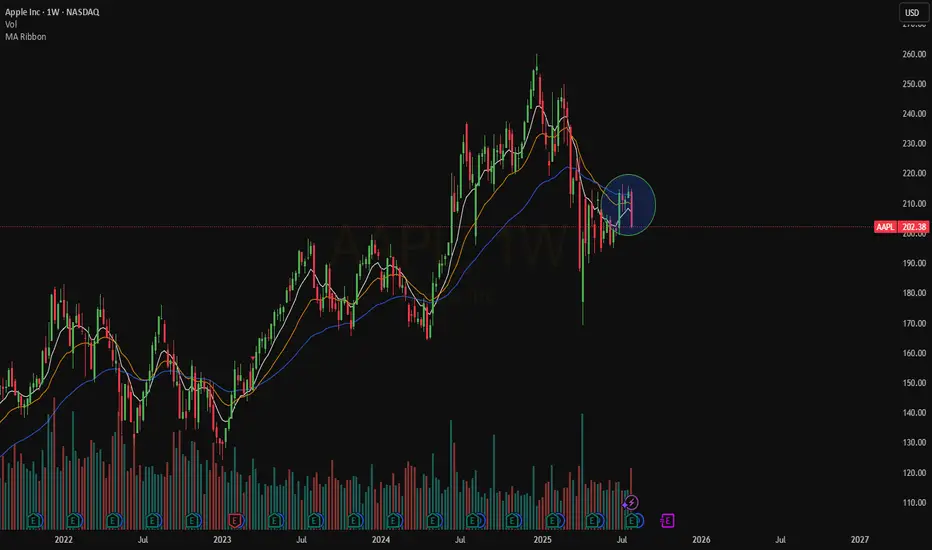
Weekly $AAPLNASDAQ:AAPL on the Weekly is still bearish. The price is trading below our EMAs that are even in a bearish order.
We need a stable move above $217 right now.
Not sure will come soon
SPX Correction to 6150 or sideways action and continued melt up?Our we getting seasonality in these markets?
or are we seeing a rotation into value and laggards with continued strength out of the Russell 2000?

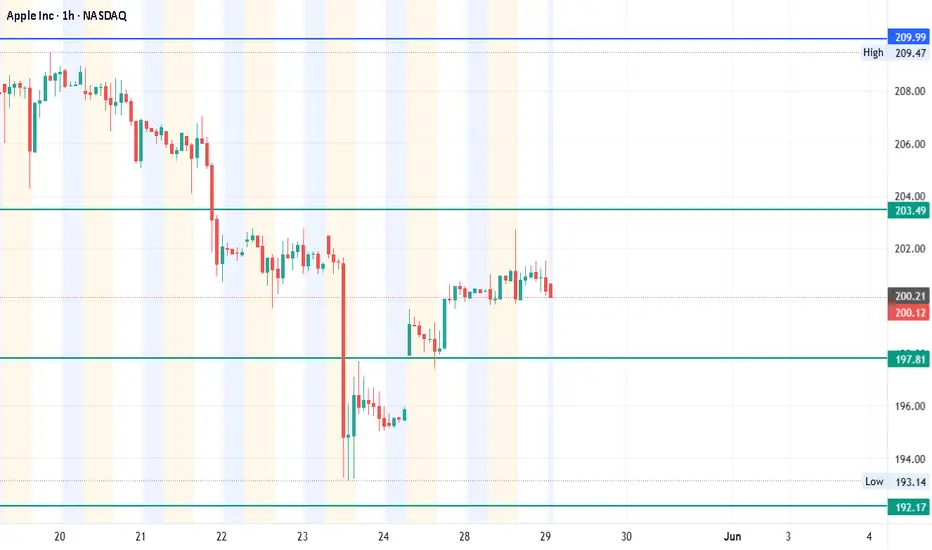
#AAPL - Pivot Point: $197.81#AAPL Trading Update — May 29, 2025
Current Price: $201.36
Pivot Point: $197.81
Upside Targets:
1️⃣ $209.99 — First resistance level to watch for profit booking
2️⃣ $216.49 — Confirmation of bullish momentum if price breaks above
3️⃣ $223.50 — Stronger resistance, potential for trend continuation
4️⃣ $230.50 — Longer-term target signaling significant upside potential
Downside Targets:
1️⃣ $185.65 — Immediate support, key level for bulls to defend
2️⃣ $179.13 — A more significant retracement level, watch for bounce or breakdown
3️⃣ $172.13 — Possible floor if selling pressure intensifies
4️⃣ $165.12 — Strong support zone, critical for trend reversal risk
Support Level: $192.17 — Acts as the first buffer zone; a break below could trigger further downside
Resistance Level: $203.49 — Short-term resistance; a clear breakout above this level would open the door to upside targets
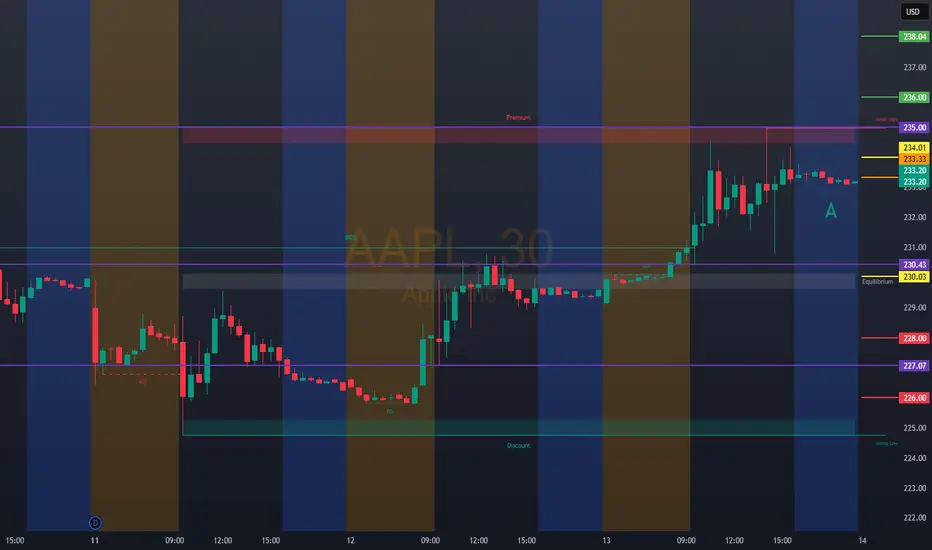
AAPL: 233.33 For ThursdayBullish Entry: 236.00 / 238.00 Bullish Stop 240.00 Bearish Entry: 228.00 / 226.00 Bearish Stop 230.00 Relevant possible rebound zone 230.00
Apple Wave Analysis – 11 August 2025- Apple broke resistance level 225.00
- Likely to rise to resistance level 237.70
Apple recently broke the resistance level 225.00 (which stopped wave (4) in April) – which was proceeded by the breakout of the strong resistance level 215.00.
The breakout of the resistance level 225.00 accelerated the active medium-term impulse wave (C) from the middle of June.
Apple can be expected to rise further to the next resistance level 237.70, the target price for the completion of the active impulse wave (C).

AAPL: 229.35 4:27PM 8/11/25 for modayBullish Entry: 232.00 / 234.00 Bullish Stop: 230.00 Bullish Target: 234.00 / 236.00
Bearish Entry: 224.00 / 222.00 Bearish Stop: 226.00 Bearish Target: 222.00 / 220.00......pending the resistance zone 240.00/242/248.00

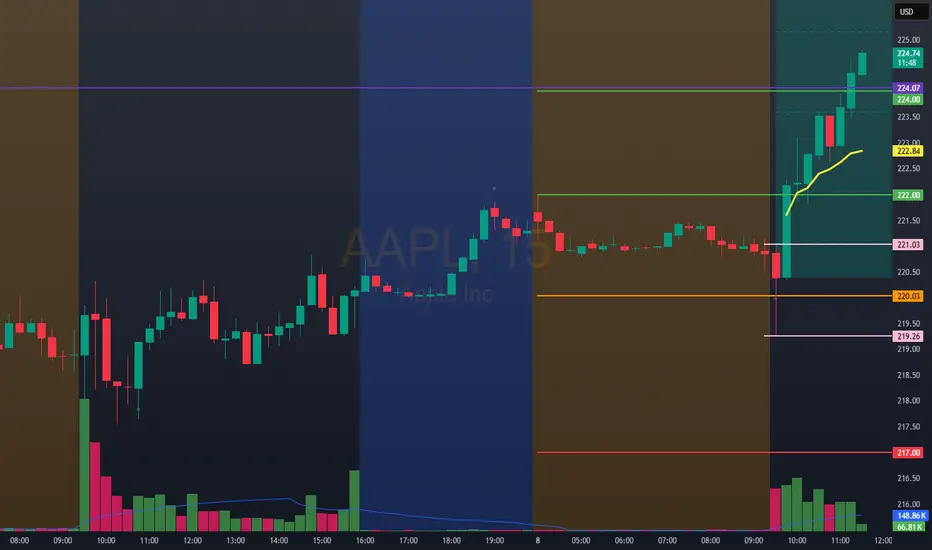
Trading AAPL 1:50 am 8/8/25Bullish Entry: 222.00 / 224.00 Bullish Stop 217.00 Bullish Target 226.00
Bearish Entry: 217.00 / 214.00 Bearish Stop 222.00 Bearish Target 208.00.....................Note that the 224.00 area is accompanied by a resistance
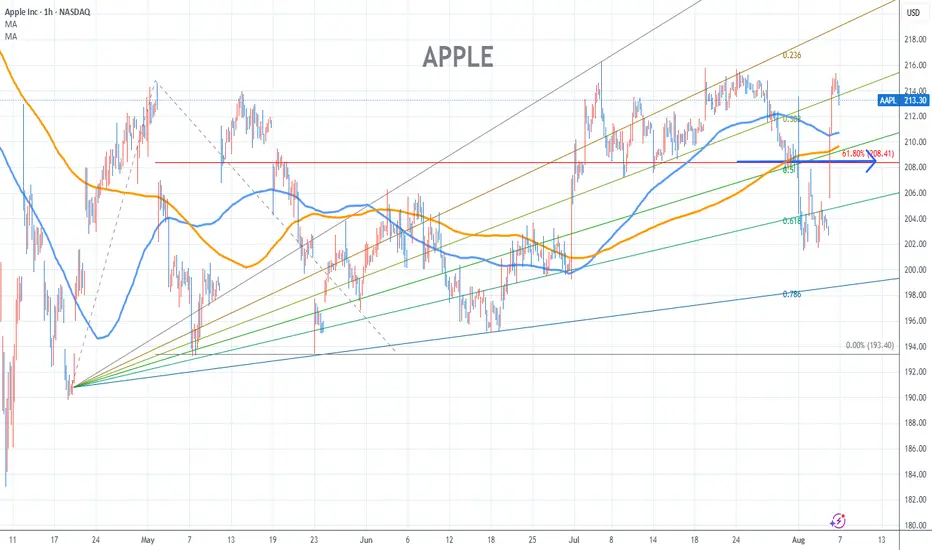
Apple Stock Chart Fibonacci Analysis 080625Trading Idea
1) Find a FIBO slingshot
2) Check FIBO 61.80% level
3) Entry Point > 208/61.80%
Chart time frame:B
A) 15 min(1W-3M)
B) 1 hr(3M-6M)
C) 4 hr(6M-1year)
D) 1 day(1-3years)
Stock progress:A
A) Keep rising over 61.80% resistance
B) 61.80% resistance
C) 61.80% support
D) Hit the bottom
E) Hit the top
Stocks rise as they rise from support and fall from resistance. Our goal is to find a low support point and enter. It can be referred to as buying at the pullback point. The pullback point can be found with a Fibonacci extension of 61.80%. This is a step to find entry level. 1) Find a triangle (Fibonacci Speed Fan Line) that connects the high (resistance) and low (support) points of the stock in progress, where it is continuously expressed as a Slingshot, 2) and create a Fibonacci extension level for the first rising wave from the start point of slingshot pattern.
When the current price goes over 61.80% level , that can be a good entry point, especially if the SMA 100 and 200 curves are gathered together at 61.80%, it is a very good entry point.
As a great help, tradingview provides these Fibonacci speed fan lines and extension levels with ease. So if you use the Fibonacci fan line, the extension level, and the SMA 100/200 curve well, you can find an entry point for the stock market. At least you have to enter at this low point to avoid trading failure, and if you are skilled at entering this low point, with fibonacci6180 technique, your reading skill to chart will be greatly improved.
If you want to do day trading, please set the time frame to 5 minutes or 15 minutes, and you will see many of the low point of rising stocks.
If want to prefer long term range trading, you can set the time frame to 1 hr or 1 day.
Apple Chart Fibonacci Analysis 080425Trading Idea
1) Find a FIBO slingshot
2) Check FIBO 61.80% level
3) Entry Point 203/61.80%
Chart time frame:B
A) 15 min(1W-3M)
B) 1 hr(3M-6M)
C) 4 hr(6M-1year)
D) 1 day(1-3years)
Stock progress:C
A) Keep rising over 61.80% resistance
B) 61.80% resistance
C) 61.80% support
D) Hit the bottom
E) Hit the top
Stocks rise as they rise from support and fall from resistance. Our goal is to find a low support point and enter. It can be referred to as buying at the pullback point. The pullback point can be found with a Fibonacci extension of 61.80%. This is a step to find entry level. 1) Find a triangle (Fibonacci Speed Fan Line) that connects the high (resistance) and low (support) points of the stock in progress, where it is continuously expressed as a Slingshot, 2) and create a Fibonacci extension level for the first rising wave from the start point of slingshot pattern.
When the current price goes over 61.80% level , that can be a good entry point, especially if the SMA 100 and 200 curves are gathered together at 61.80%, it is a very good entry point.
As a great help, tradingview provides these Fibonacci speed fan lines and extension levels with ease. So if you use the Fibonacci fan line, the extension level, and the SMA 100/200 curve well, you can find an entry point for the stock market. At least you have to enter at this low point to avoid trading failure, and if you are skilled at entering this low point, with fibonacci6180 technique, your reading skill to chart will be greatly improved.
If you want to do day trading, please set the time frame to 5 minutes or 15 minutes, and you will see many of the low point of rising stocks.
If want to prefer long term range trading, you can set the time frame to 1 hr or 1 day.

AAPL ShortBroader Market Structure (AAPL 1H):
The overall market structure on this 1-hour chart has shifted from a consolidation phase into a clear bearish trend. A Change of Character (CHoCH) occurred at $224.88, marking the breakdown of a key higher low and signaling the end of the previous bullish phase. This was followed by a Break of Structure (BOS) at lower levels, confirming bearish continuation. The structure now favors lower highs and lower lows, indicating a bearish directional bias.
Supply and Demand Analysis:
The supply zone near $224–228 is strong, as price dropped sharply from this area after a brief consolidation, showing aggressive selling and validating it as a significant resistance. Buyers previously stepped in around $194–196, creating a well-respected demand zone; price rallied with conviction from this level in the past, making it a strong base where buyers are likely to be active again.
Price Action Within Marked Region:
Price recently exited the upper consolidation range and is now moving impulsively lower toward the marked demand zone around $194–196. The rejection from supply was swift, and candles within the marked area show sustained bearish momentum with minimal bullish interruption. There is a clear lack of buying interest mid-structure, implying that price may continue descending into the demand zone.
Current Trade Bias & Outlook:
The bias remains bearish, with price likely to test the $194–196 demand area. Expect a potential short-term bounce once that zone is tagged. However, if buyers fail to hold this level, further downside toward $172–174 becomes plausible. An invalidation of this bearish outlook would occur if price reclaims and holds above $208, breaking the recent lower high.
Momentum & Candlestick Behavior:
Momentum favors sellers—price is printing strong bearish candles with minimal wicks, indicating conviction. No significant reversal patterns (like bullish engulfing or hammer candles) are visible yet, which supports continuation lower in the short term.

Apple Short Trade ideaAfter the positive earning brought enough buyside liquidity to be taken i have executed this short trade idea on Friday with almost 3 RR #Apple #short #smc #smartmoney #liquidity #trader #ict #liquiditygrab

Apple Stock looking bearishThe positive earnings brought enough buyside liquidity to be taken by the short sellers and im having this almost 3 RR trade idea that I executed on Friday

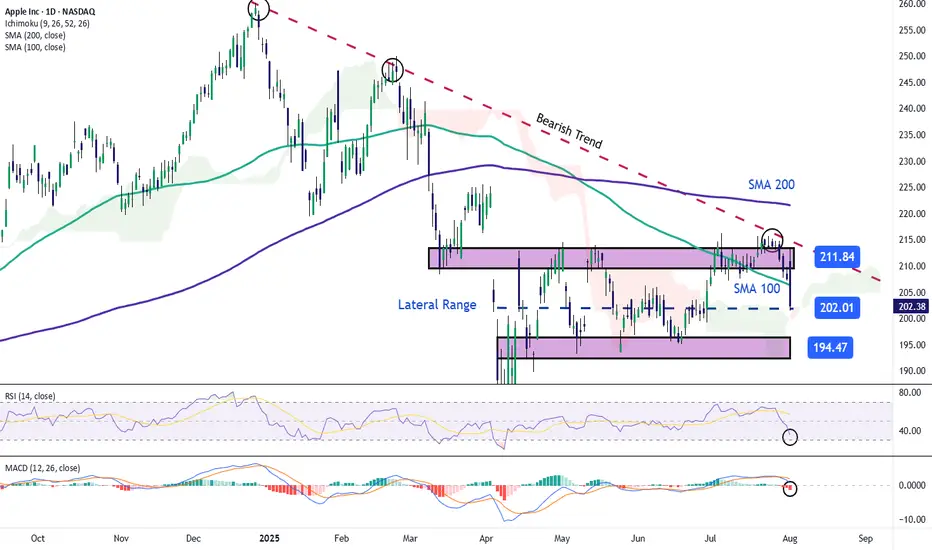
Apple Stock Falls Despite Strong EarningsApple stock is down more than 4% in the final session of the week, following the company’s earnings release yesterday. Apple reported earnings per share of $1.57, beating expectations of $1.43, while total revenue reached $94.04 billion, surpassing the $89.53 billion forecasted by the market.
However, despite the strong results, the stock is once again facing a notable short-term bearish bias as investor concerns grow. The primary issue is the perception that Apple is falling behind in the race for artificial intelligence, especially compared to its main competitors. In addition, shortly after the earnings announcement, it was noted that the company may face challenges in sustaining growth throughout the remainder of 2025, which has fueled additional downward pressure on the stock.
Sideways Range Emerges
In recent weeks, Apple’s price action has consolidated within a clear lateral range, with resistance around $211 and support near $194. So far, price fluctuations have not been strong enough to break this structure, and the latest bearish candlestick has reinforced the validity of the channel. For now, this sideways range remains the most relevant technical formation to watch in the upcoming sessions.
Technical Indicators
RSI:
The RSI line is falling rapidly and is now approaching the oversold zone at the 30 level. If the indicator reaches that threshold, it could suggest a technical imbalance, opening the door to a short-term bullish correction.
MACD:
The MACD histogram has moved into negative territory in recent sessions, suggesting a clear dominance of bearish momentum in the moving average structure. If this persists, selling pressure may continue to build in the near term.
Key Levels to Watch:
$211 – Main Resistance: Upper boundary of the current range. A breakout above this level could trigger a stronger bullish trend.
$200 – Psychological Support: Round number zone, a breakdown here could activate an immediate bearish bias for the next sessions.
$194 – Key Support: Corresponds to recent weekly lows. A move below this level would likely confirm a more extended bearish trend.
Written by Julian Pineda, CFA – Market Analyst