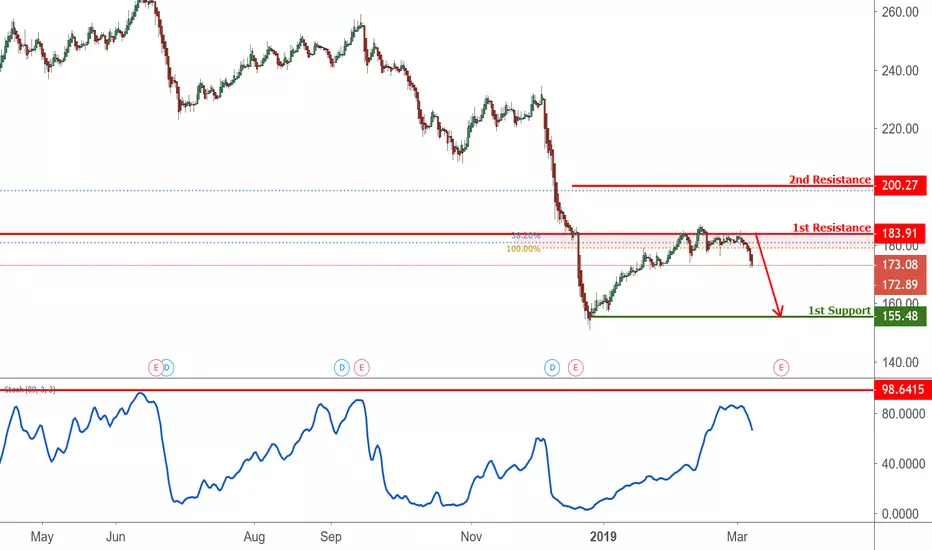
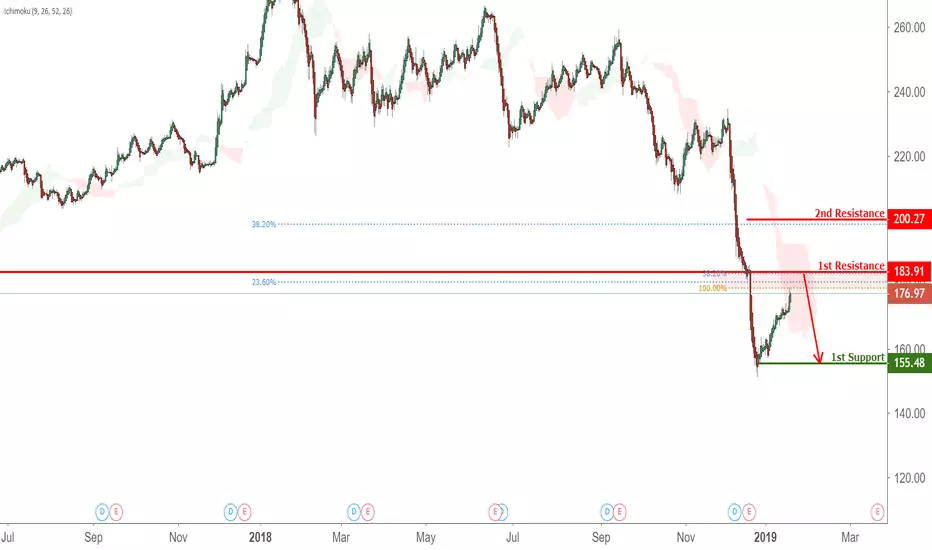
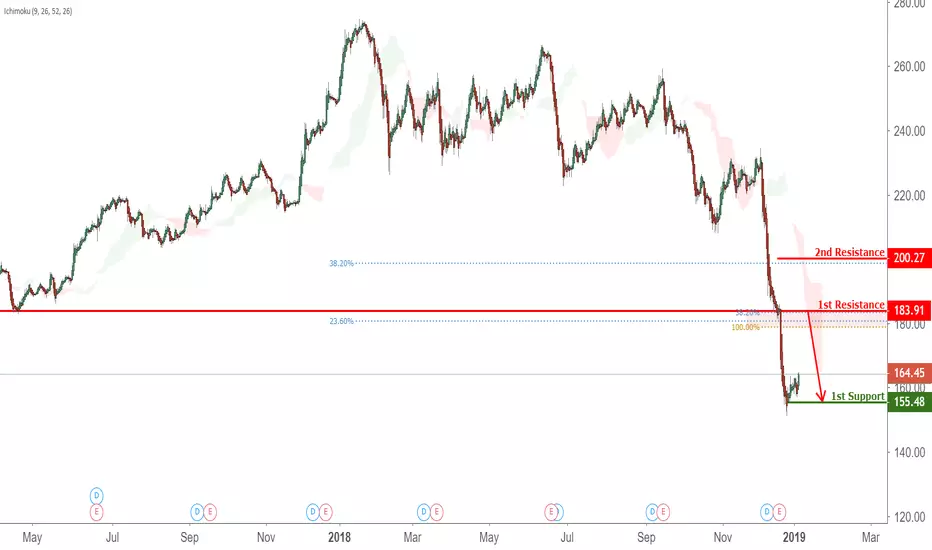
FDX approaching resistance, potential drop! FDX is approaching our first resistance at 183.91 (horizontal pullback resistance, 38.2%, 23.6% fibonacci retracement, 100% fibonacci extension) where we might see a potential drop to our first support level at 155.48 (horizontal swing low supoprt)
FDXD trade ideas

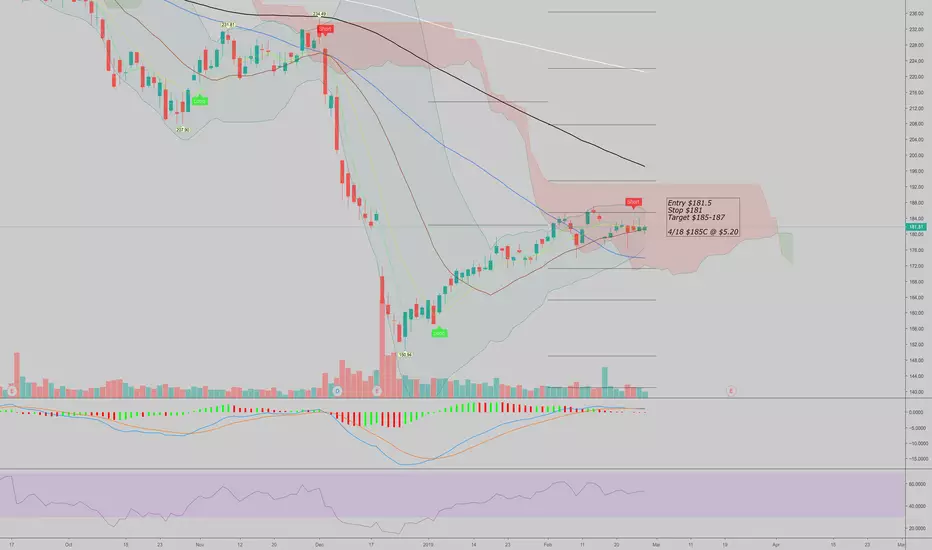
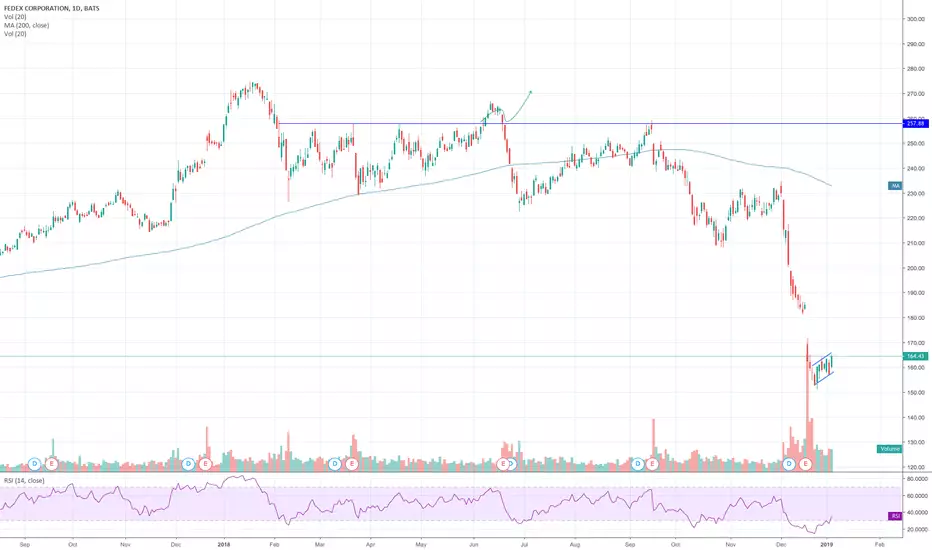
$FDX Ascending Triangle - Bullish Options Activity$FDX Ascending Triangle - Bullish Options Activity
Monitoring for strong move through $184.00 resistance
Bullish options activity just before the close - 1k March 22nd 180.00 strike calls traded for $600k in premium
Note: Informational analysis, not investment advice.
FDX recent drops may be an opportunity to get a small gain Recent drop due to bad news about AMZN may be temporary only. Currently FDX is hovering around the bottom of its ascending channel. If the hourly price close above 178.80, it may be an opportunity to get back in for a ride at least to 189.50. stop loss is 173.

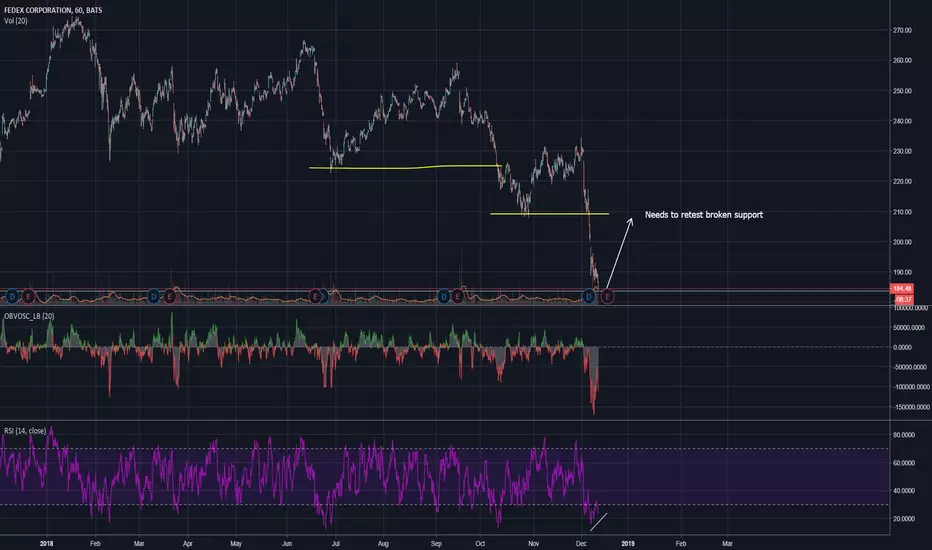
Rising wedge and at resistanceRising wedge and at resistance
Short only if it breaches the lower trend line

FEDEX ; Permulaan kepada strong bear bermula?saya melihat akan ada pergerakan bear yang kuat apabila harga sampai ke paras 190 .

FDX approaching resistance, potential drop! FDX is approaching our first resistance at 183.51 (horizontal pullback resistance, 100% Fibonacci extension, 23.6%, 38.2% Fibonacci retracement) where a strong drop might occur below this level to our first support level at 155.48 (horizontal swing low support).
Stochastic (21,5,3) is also approaching resistance where we might see a corresponding drop in price.

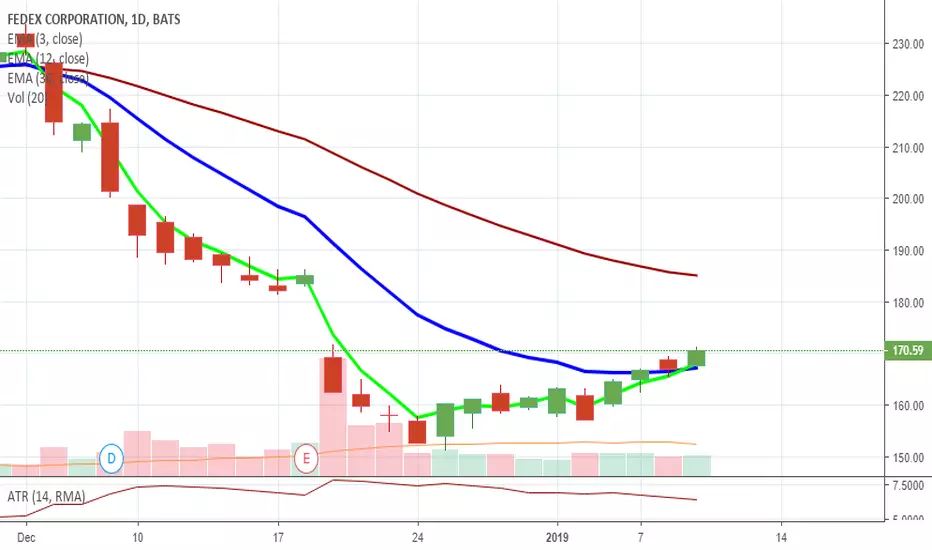
FDX has turned bullish today. Buy the Calls.The 3 EMA (Exponential Moving Average) has crossed above the 12 EMA, giving us a Bullish Signal. Stop below the recent lows around $150.
FDX Gap ResistanceBuying some puts here at gap resistance, it will be a short term trade (1 - 3 days).
With the market melting up and people putting money back into their 401k, I'm not taking any big short positions for a while. Looks at all the companies that reported crap earnings.... right back to where they were pre-earnings as if China is their main problem...
This is not a sure bet by any means until the market stops melting up.

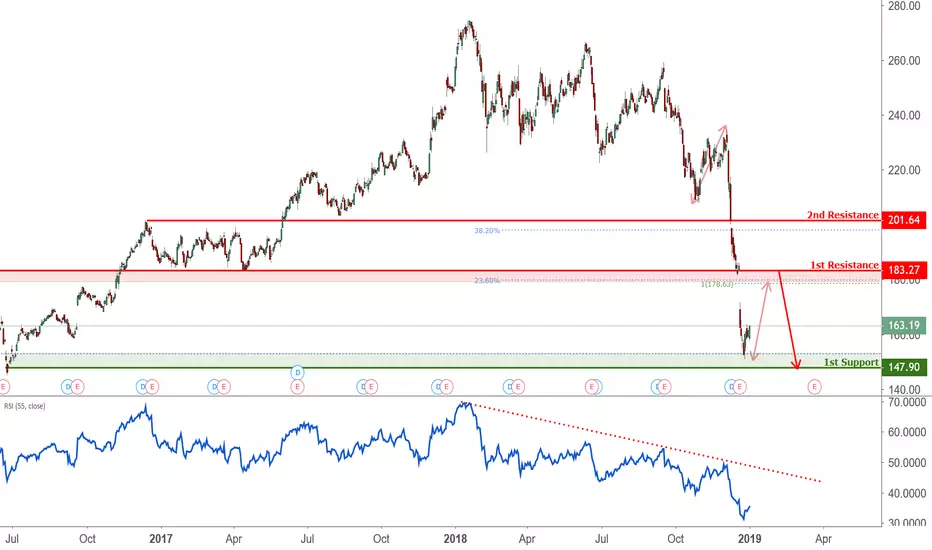
FDX Approaching Resistance, Potential Drop!FDX is approaching our first resistance at 183.27 (horizontal overlap resistance, 100% fibonacci extension, 23.6% fiboancci retracement) where a strong drop might occur below this level pushing price down to our major support at 147.90 (horizontal swing low support, 78.6% fiboancci retracement).
RSI (55) is also approaching resistance where we might see a corresponding drop in price.
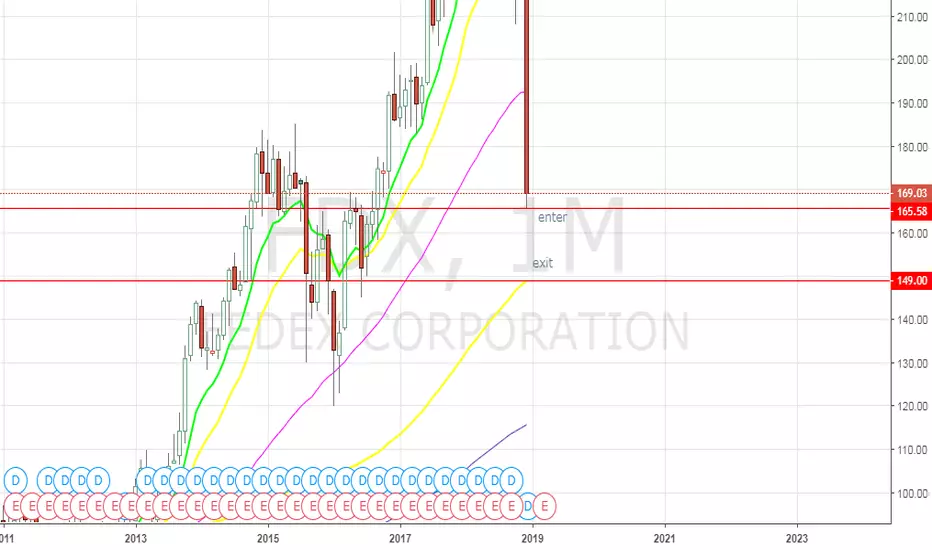
FDX - Trade setupFor people who think they missed this trade. I'm playing low of today and to the 100MA on the monthly chart. Just set your Alert and wait for it.. Plenty to eat still.
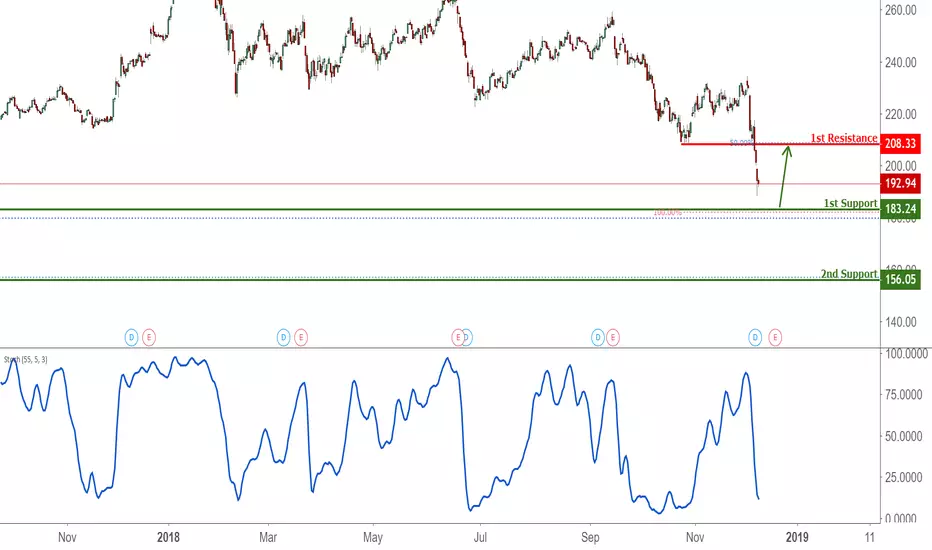
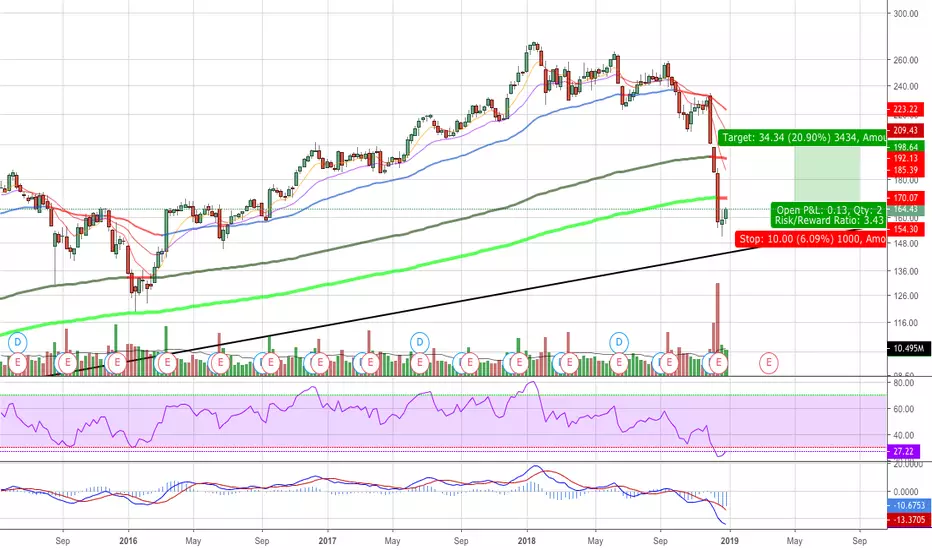
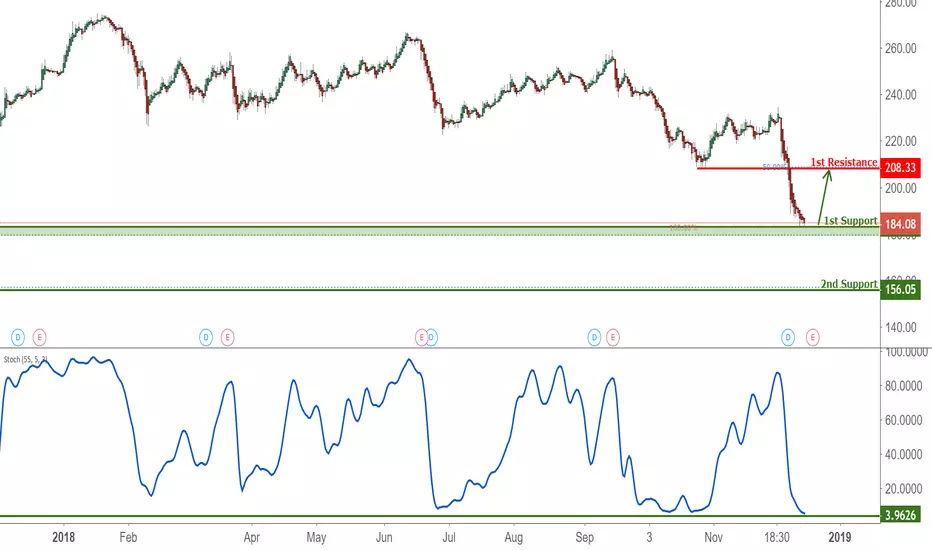
FDX Approaching Support, Potential Bounce!FDX is approaching support at 183.24 (100% Fibonacci extension, 61.8% Fibonacci retracement, horizontal overlap support) where it could potentially rise to its resistance at 208.33 (50% Fibonacci retracement, horizontal pullback resistance).
Stochastic (89, 5, 3) is approaching support at 3.27% where a corresponding bounce could occur.
Fedex long scalppanic below 210 support, 1,2,4hr bul divs, at major support level, news looks neutral. long
FDX.30 minThis morning's call was quite prescient. Bullish divergence and a bounce at 183.94. Earnings next week. Could that be the catalyst?

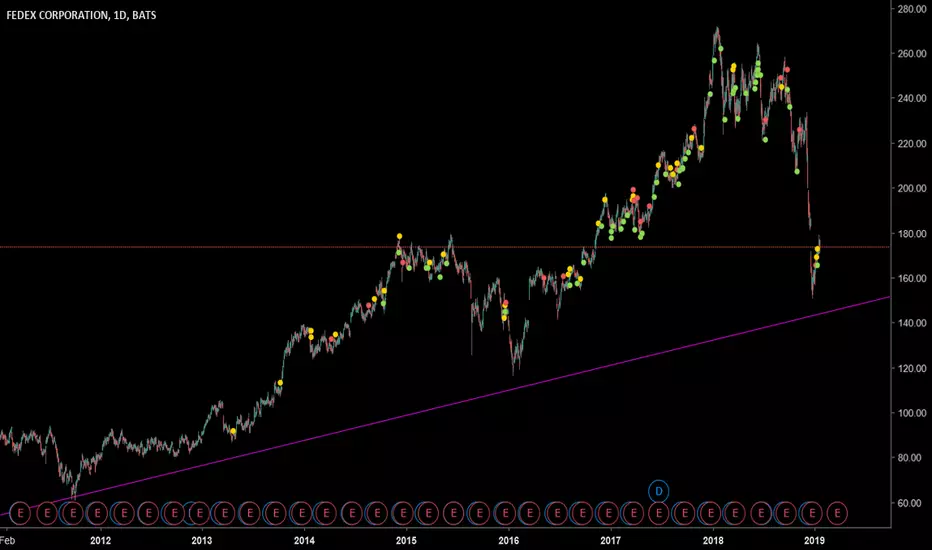
FedexIf price falls down 182, will be below 3 standard deviation in the regression model. Next big support close to 130-140 $.

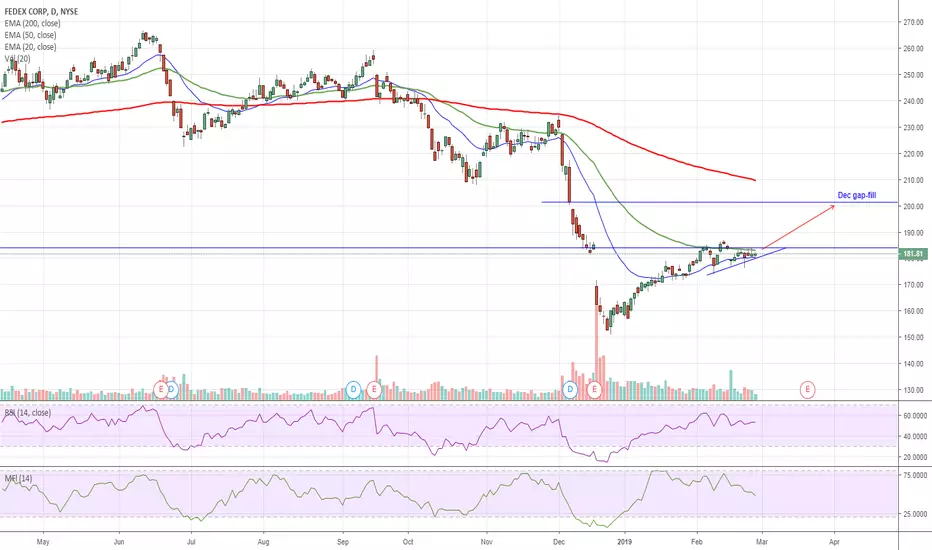
FDX: Nearing LT supportIt looks deathly but is approaching a number of fib support areas on the Daily time frame. the 175-183 presents a low risk opportunity for a bounce to 193 -200

FDX Approaching Support, Potential Bounce!FDX is approaching its support at 183.24 (100% Fibonacci extension, 61.8% Fibonacci retracement, horizontal overlap support) where it could potentially rise up to its resistance at 208.33 (50% Fiboncci retracement, horizontal pullback resistance).
Stochastic (55, 5, 3) is approaching support where a corresponding bounce could occur.