FDX @ important level wait for bull candle patternFDX @ important level wait for bull candle pattern
FDXD trade ideas

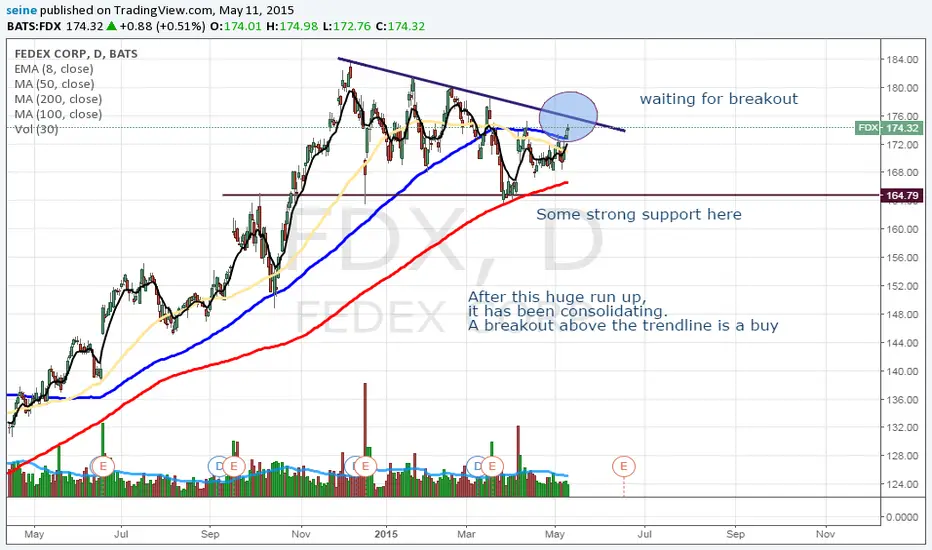
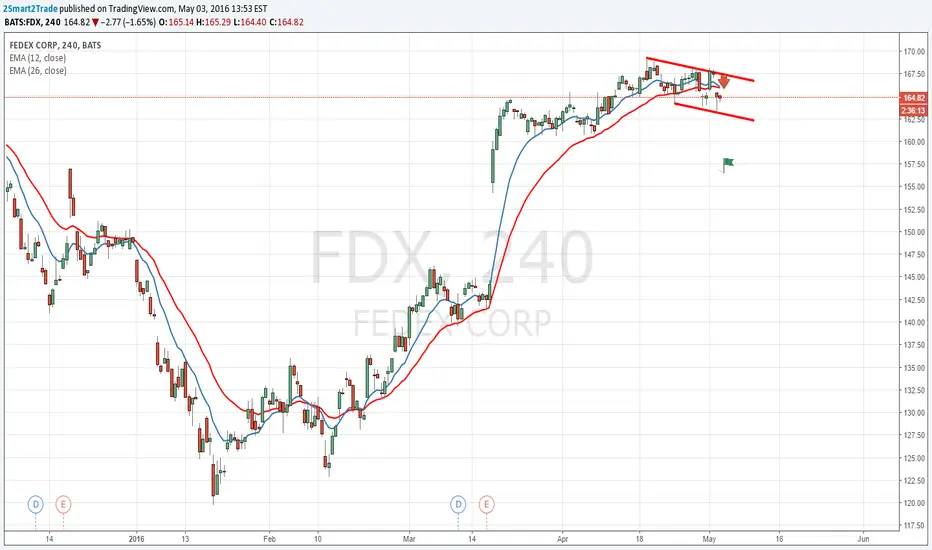
FDXLooking for a break and a daily close of the descending trend line.
I look to target the 1.272 extension of 175.5

$FDX Inverted H&SPotential inverted head and shoulders on $FDX daily into an ascending broadening wedge.
Expecting a nice move up from here.

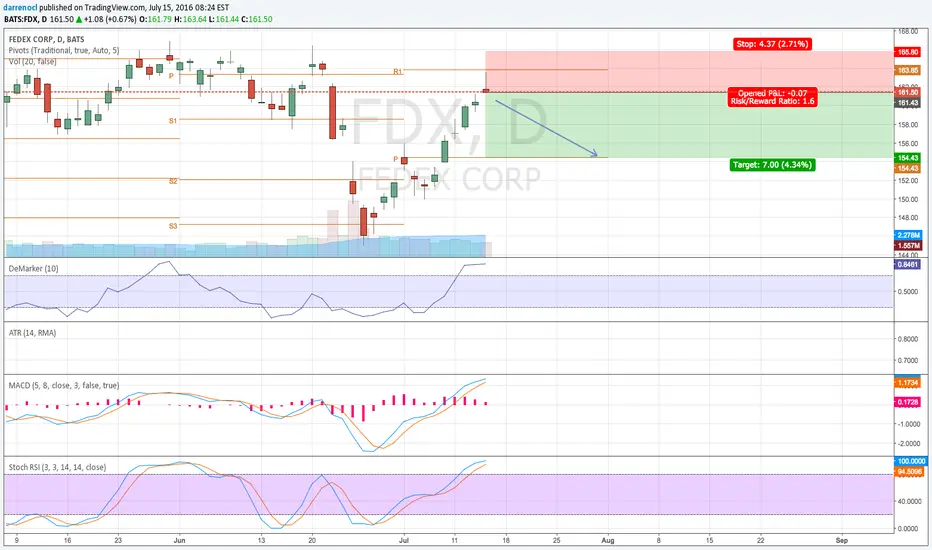
Fedex Short OpportunityFedex Looking short as fundamentals are saying to sell this up right away plus it is rejecting over major resitance
FEDEX forming another double topThis FDX weekly charts is one of my favourites. When I see a double top it is a very good indication that there will likely be significant downside. Lets see

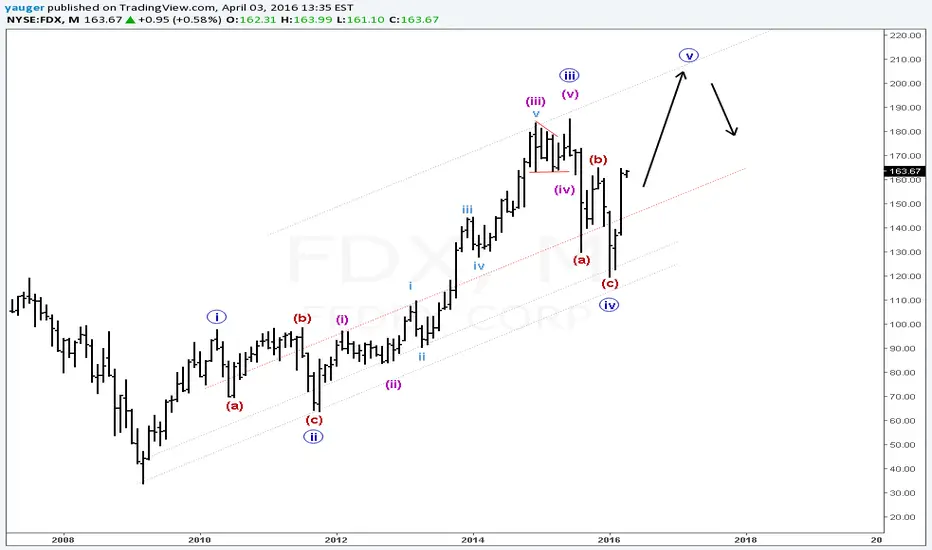
Bullish update on FDXFDX has started another rally that has more to go short term and long term. We need to move above 185 to end something. We are not there yet thus rally not over. How exactly we will get there is another story.
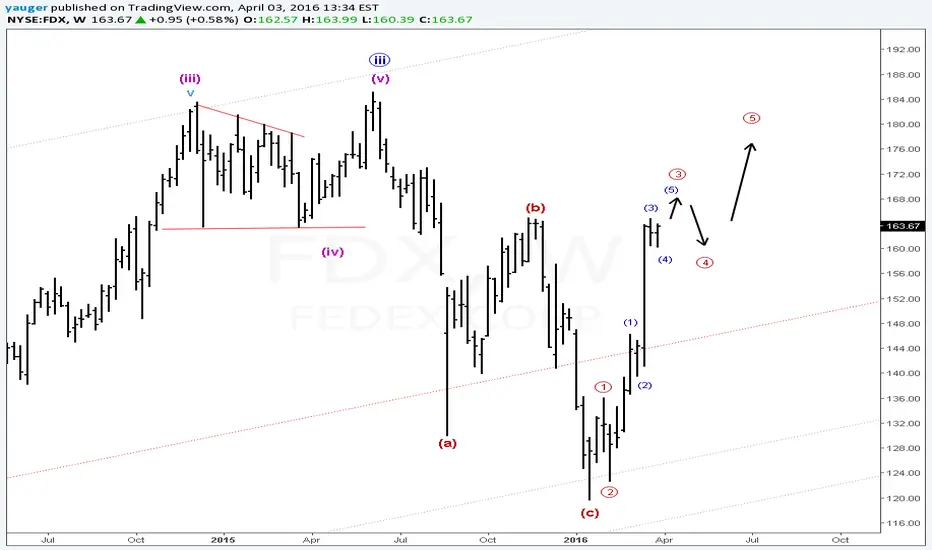
Short term it appears we need at least another push up but it would look better the way I labeled the climb as shown here on this weekly chart. Doing just that going into May then that would be a case of "Sell in May and go Away".
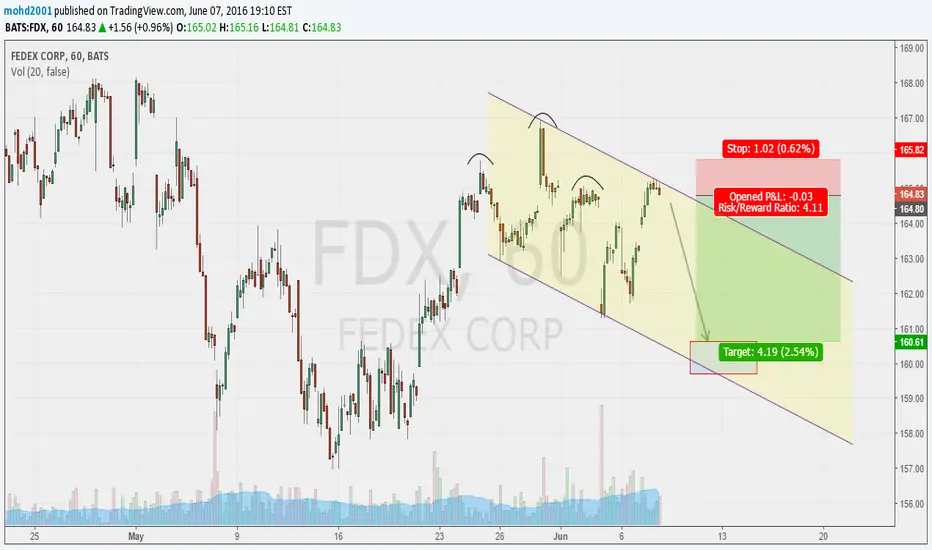
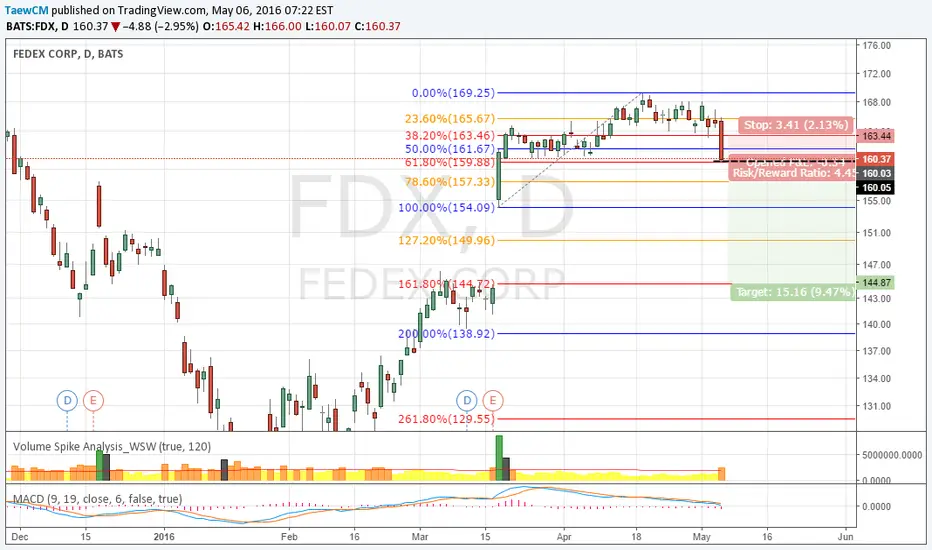
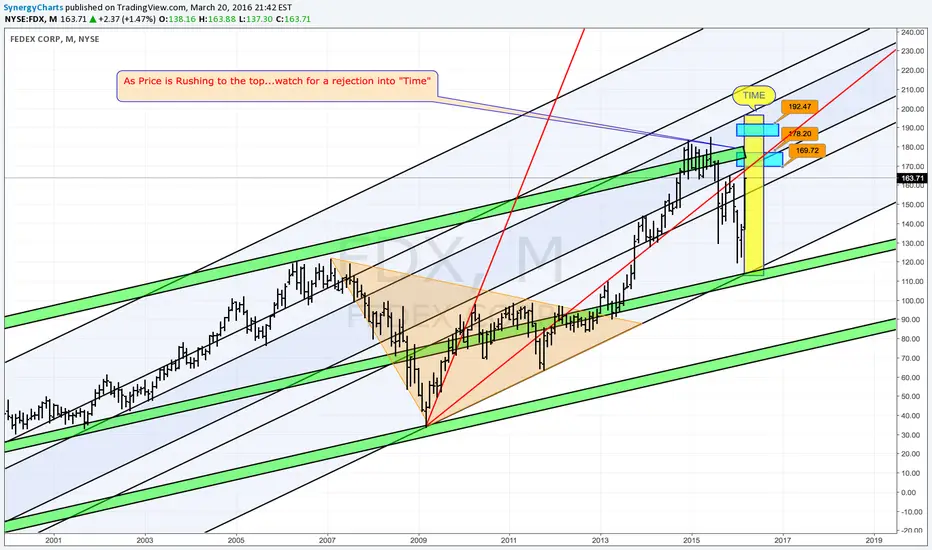
Becareful of your Deliveries....Price is retesting the high with great force....Watch for a rejection back down to consolidate before it resumes the uptrend.
FedEx StrengthStrong Weekly Englufing Pattern. Additionally, MFI indicates a Bullish Divergence. It is showing continued underlying strength


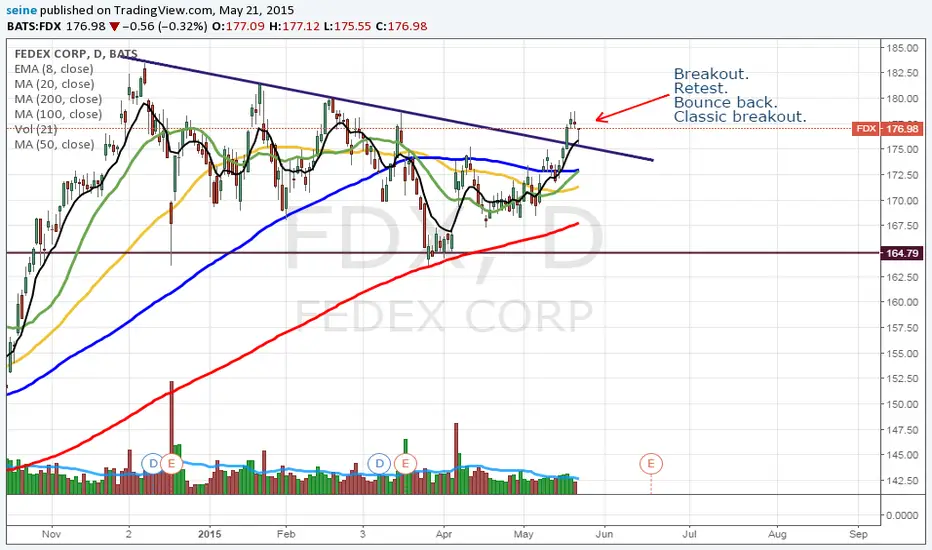
Light at end of technical tunnel?Broke above trend line. Ready to move up if bulls want it bad enough from ER.
EARNINGS PLAYS THIS COMING WEEK -- FDX, ORCLOnly two earnings plays stick out to me this coming week -- FDX and ORCL, both of which announce earnings on 12/16 (Wednesday) after market close, so look to put on setups before NY close on Wednesday.
Currently, FDX's 52 week IVR is at 54 (IV 34), which isn't stellar, but it's at 92 for the past six months. Moreover, there is pretty good credit to be had whether you go short strangle or iron condor, so I imagine I'll play that one way or another if the IV sticks in there.
ORCL (IVR 75/IV 35) isn't looking all that hot, frankly, because I can't get 1.00 in credit with either a short strangle or iron condor (a Dec 24 34.5/39.5 short strangle will only get you a .61 credit at the mid price right now, which isn't anything to go crazy over; a same expiry iron condor just isn't worth it). Nevertheless, we could see a greater volatility pop toward earnings that makes it a little bit more worthwhile such that I'll play just because there isn't that much else worthwhile to do ... .
(Of course, there is that all FOMC thing next week, too).
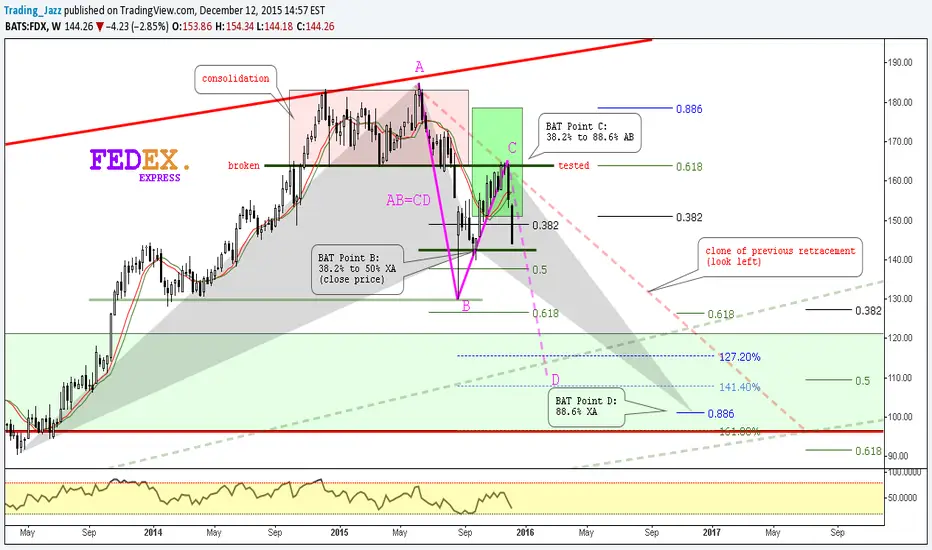
Express delivery // Bullish Bat & AB=CD patterns // IF=THEN ®NYSE:FDX
Bullish BAT:
Point B:
38.2% to 50% XA
Point C:
38.2% to 88.6% AB
Point D:
88.6% XA (buy)
Targets:
TP1 38.2% AD
TP2 61.8% AD
Safe Trades;
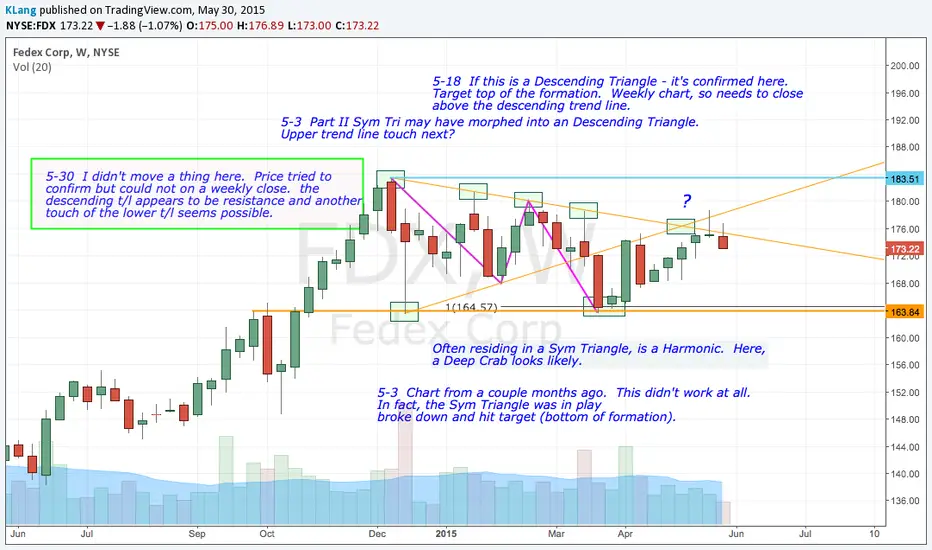
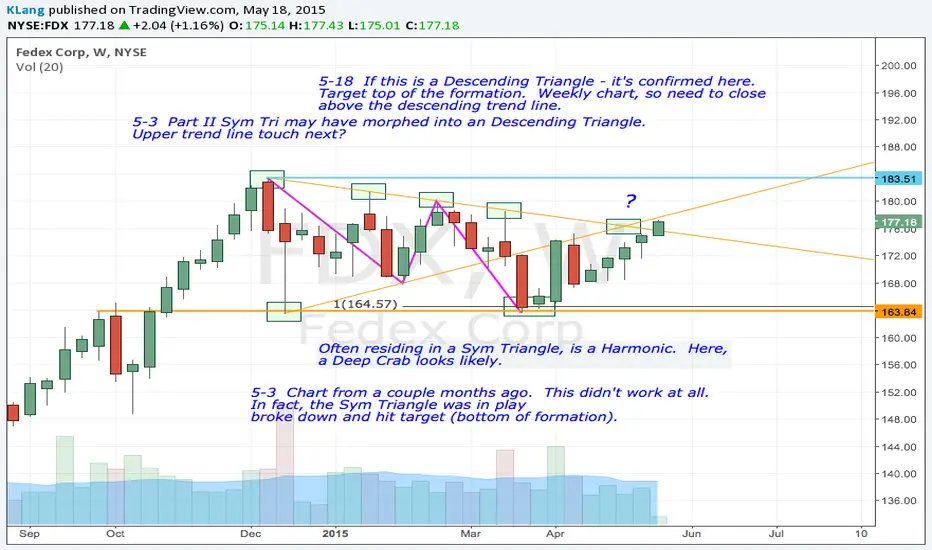
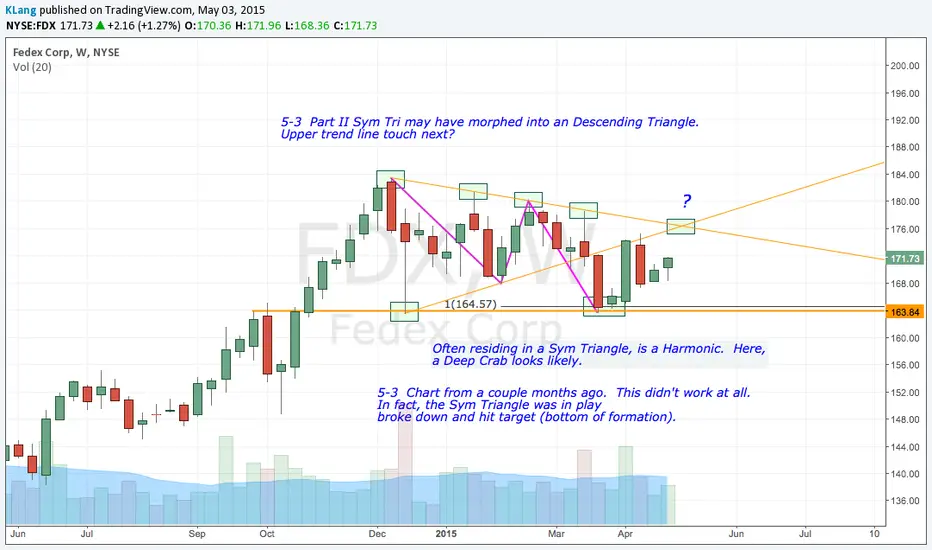
FDXUpdated notes on chart. Price did continue on to the upper trend line as expected, but didn't close above it on a weekly basis. Lower t/l seems probable.