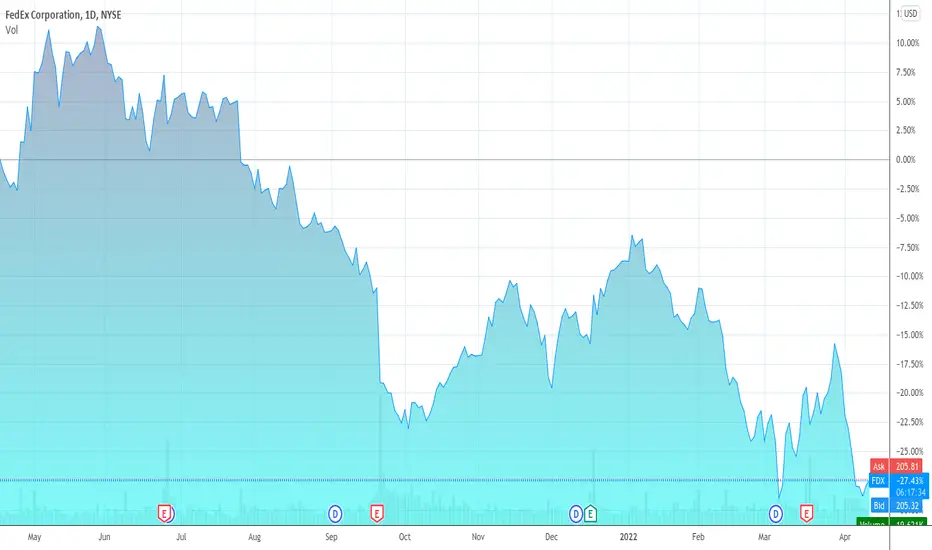
FedEx and the Falling Wedge 📈FedEx NYSE:FDX 📦 gave the falling wedge look back in January 2022—after it failed to break-through trendline resistance.
Since then, it's been an easy stock to watch bounce around and consolidate into a more defined falling wedge, threatening to break trendline support throughout the month of April. After signaling an inverse head and shoulders coming into May, it was a reliable trade up to 225 resistance before failing victim to the three black crows —right back to trendline support on June 13. 📉
The catalyst was an announcement of a 53% raise of the quarterly dividend that sent a big gap up over 218 resistance/support through 225 to test the very top of the falling wedge trendline. Closing near the highs around 231 resistance will provide room for a breakout, however, it would be better to see a few days of consolidation above 225 before confirming the breakout—on volume—over 231.
Depending on what comes out from the Federal Reserve meeting on Wednesday, June 15 will either send this into full breakout mode or send this back toward 218 support.
Keep this one on the top of your radar.
FDXD trade ideas
FDX: Looking for Potential Double TopFedEx is currently in a descending wedge pattern. I am looking for FDX to break out of this pattern in the next few days and retest $240.
Not financial advice


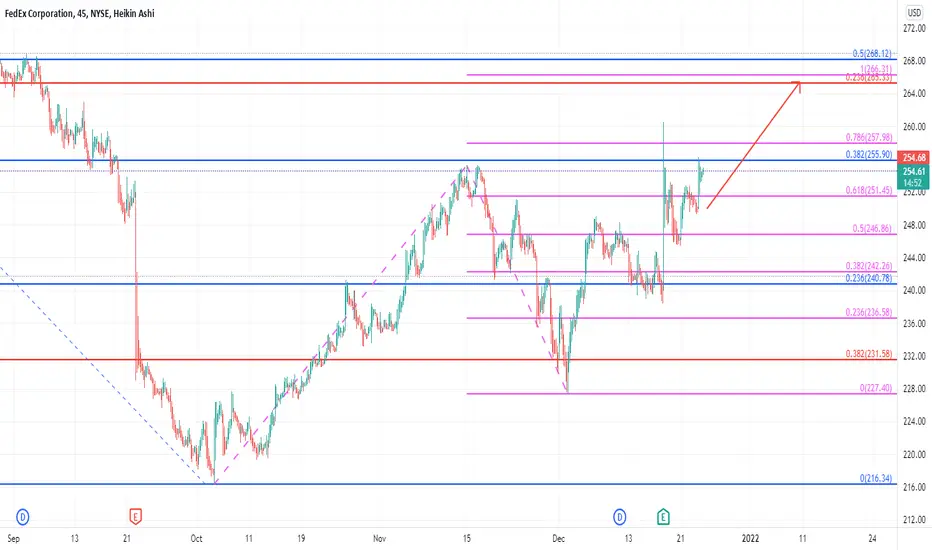
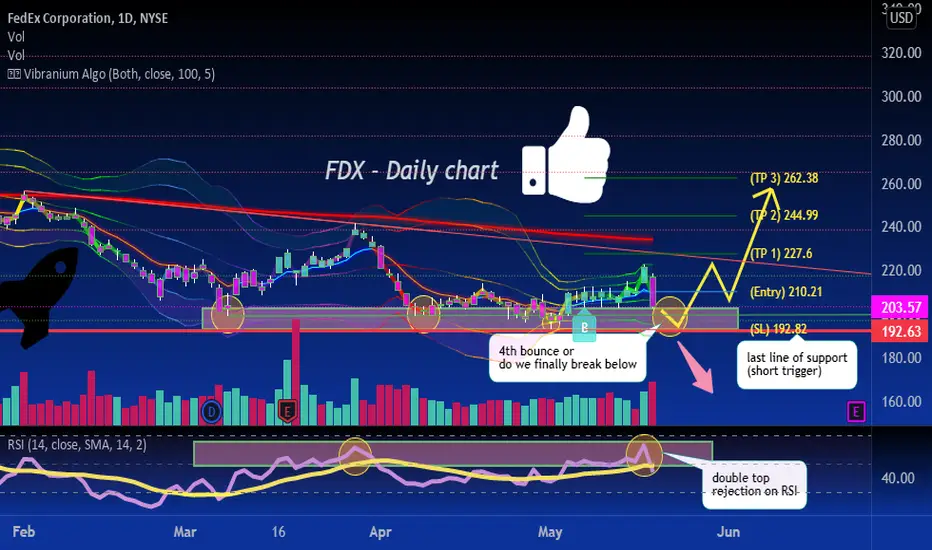
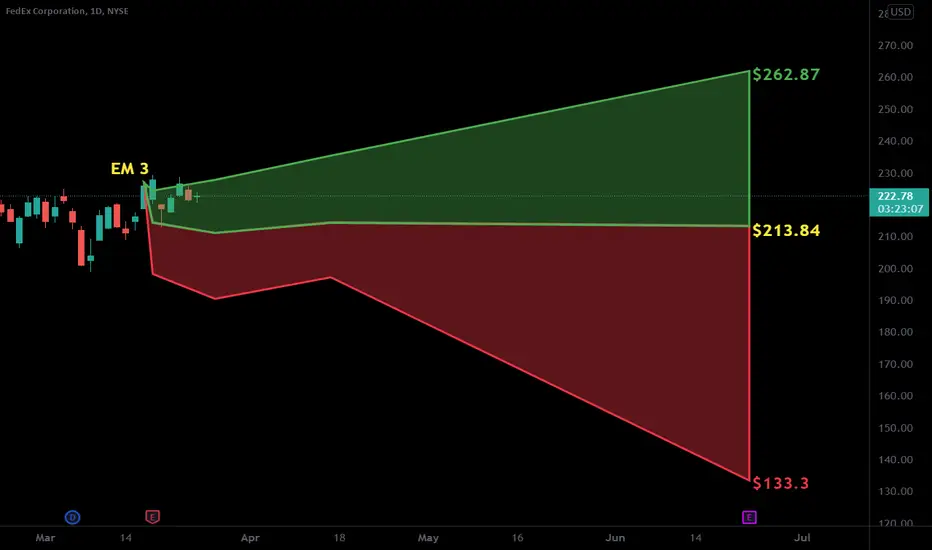
will support hold or do bears send to new lows? time will tell:)FDX is approaching extreme support zone, if it can hold and bounce for the 4th time my upside targets are 227.6-244.99-262.38, a break below 192.63 and I we can target 180-160 range.
Fedex Long off RetracementFedex NYSE:FDX is the latest stock on my radar to do a 50% Retracement from the COVID low to All Time High at 204.30. This morning there was a price volatility spike on the 30 minute timeframe (see below) to trigger attention to the setup. I am going to give it a wide berth to play the weekly level but start the position on today's down day.

Fedex USA Sun Storm Investment Trading Desk & NexGen Wealth Management Service Present's: SSITD & NexGen Portfolio of the Week Series
Focus: Worldwide
By Sun Storm Investment Research & NexGen Wealth Management Service
A Profit & Solutions Strategy & Research
Trading | Investment | Stocks | ETF | Mutual Funds | Crypto | Bonds | Options | Dividend | Futures |
USA | Canada | UK | Germany | France | Italy | Rest of Europe | Mexico | India
Disclaimer: Sun Storm Investment and NexGen are not registered financial advisors, so please do your own research before trading & investing anything. This is information is for only research purposes not for actual trading & investing decision.
#debadipb #profitsolutions
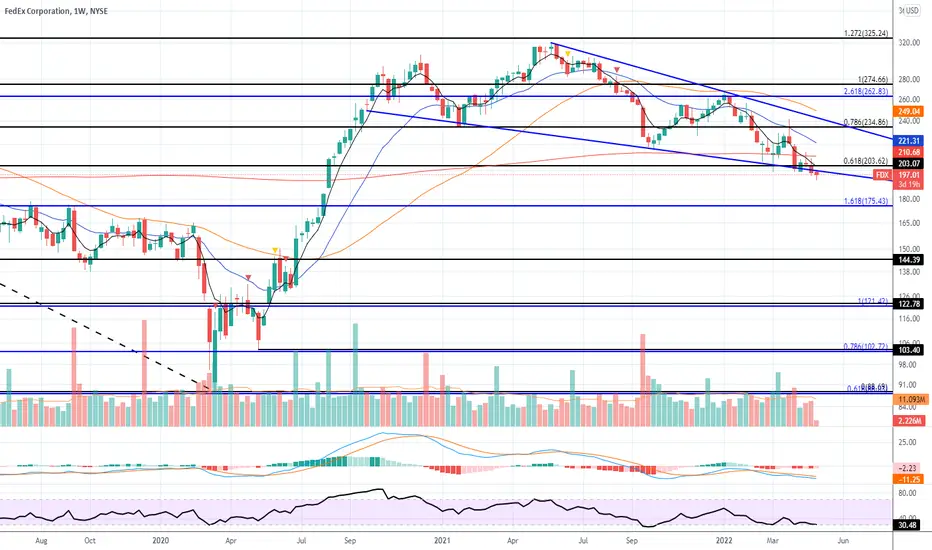
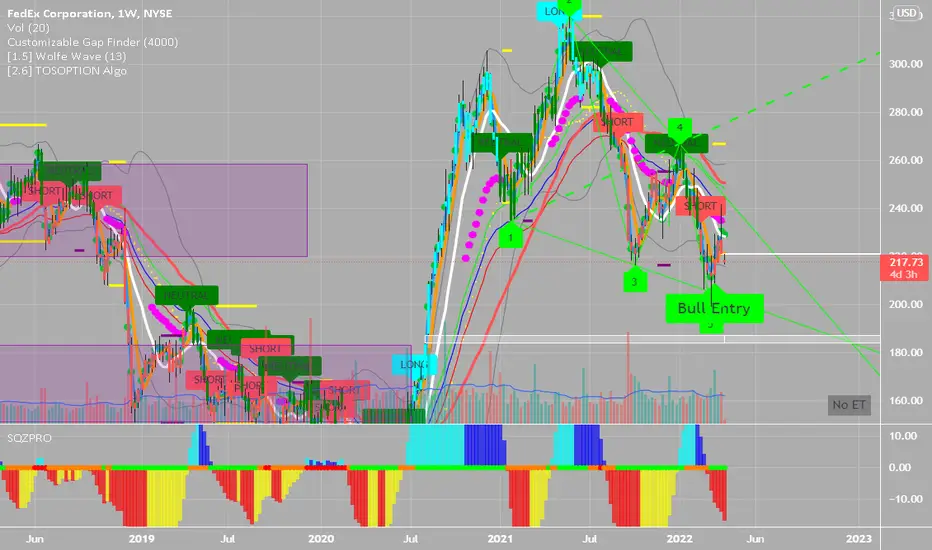
FDX 1W wolfe wave 4/4A Wolfe Wave is a chart pattern composed of five wave patterns in price that imply an underlying equilibrium price. Investors who use this system time their trades based upon the resistance and support lines indicated by the pattern.

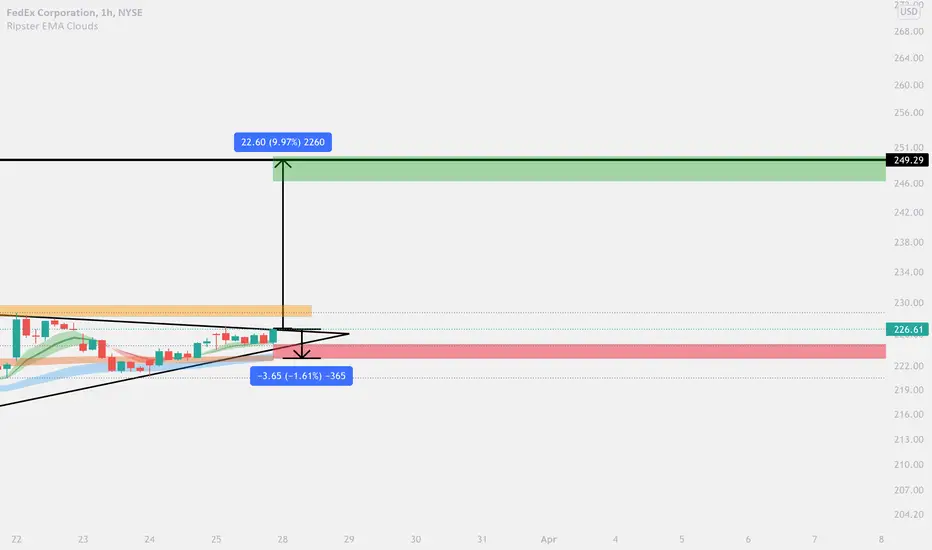
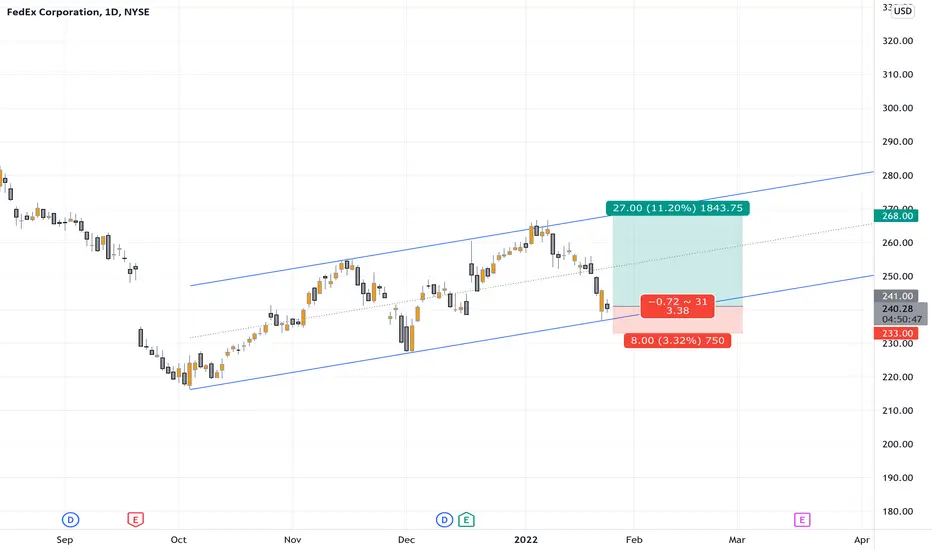
$FDX Long - Continuation Breakoutprice has broken upward out of a consolidation period, suggesting a continuation of the prior uptrend. Risk Reward based on support/resistance.
$FDX with a Bearish outlook following its earnings #Stocks The PEAD projected a Bearish outlook for $FDX after a Negative under reaction following its earnings release placing the stock in drift D with an expected accuracy of 70%.
FDX Q3 Earnings Lag EstimatesFedEx (FDX) quarterly earnings of $4.59 per share VS Zacks Consensus Estimate of $4.69 per share.
Revenues of $23.64 billion, surpassing the Zacks Consensus Estimate by 0.30%.
My buy area is around the $180 support.
Looking forward to read your opinion about it.

FEDEX - BULLISH SCENARIOFedEx is scheduled to report its fiscal Q3 2022 results on Thursday, March 17.
Revenues and EPS are expected to be above the consensus estimates.
With an average target price of $308.42, FedEx seems like a good opportunity today for long-term investors.
The first resistance is located at $238.
Risk Disclosure: Trading Foreign Exchange (Forex) and Contracts of Difference (CFD's) carries a high level of risk. By registering and signing up, any client affirms their understanding of their own personal accountability for all transactions performed within their account and recognizes the risks associated with trading on such markets and on such sites. Furthermore, one understands that the company carries zero influence over transactions, markets, and trading signals, therefore, cannot be held liable nor guarantee any profits or losses.

Head & Shoulders $FDX on the weekly Head & Shoulders $FDX on the weekly
- H&S formation on the weekly
- Bear flag

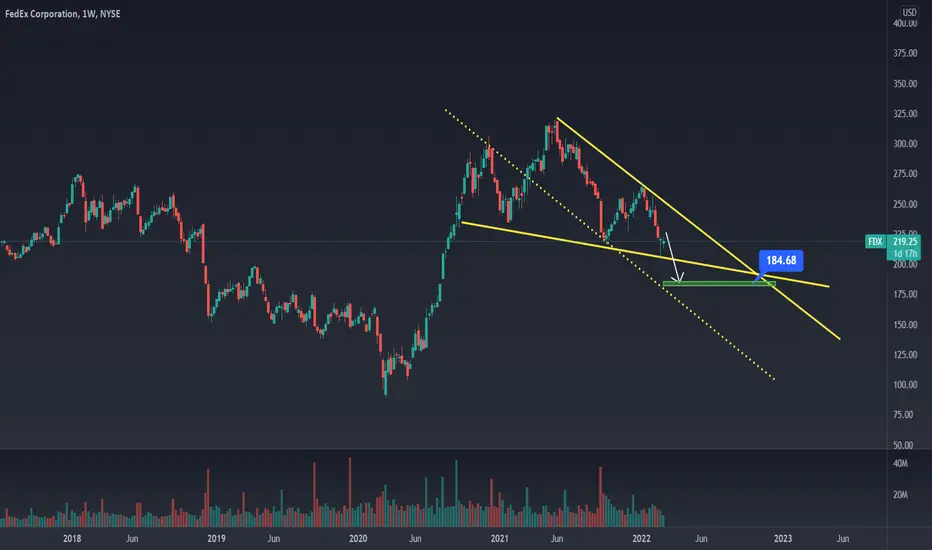
FEDEX PRICE TARGET 186 - END OF MARCHAfter potentially retesting 227, I see FEDEX approaching the bottom of this wedge (and a soft channel), and falling through - causing the price to reach 190/ 185 by the end of March or early April.
Potential H&S in FEDEX (mid long term)Potential H&S in FEDEX (mid long term)
First target 180 then 150
Keep unloading

$FDX - Downside Trade OpportunityOverall market weakness and real life events such as trucker protests and more can lead to downside trade set ups. In this case, despite $UPS's strong earnings, most of that move has been given back. With sentiment shifting towards energy, banks and other defensive stocks. Money is coming out of these, otherwise fundamentally strong, businesses.
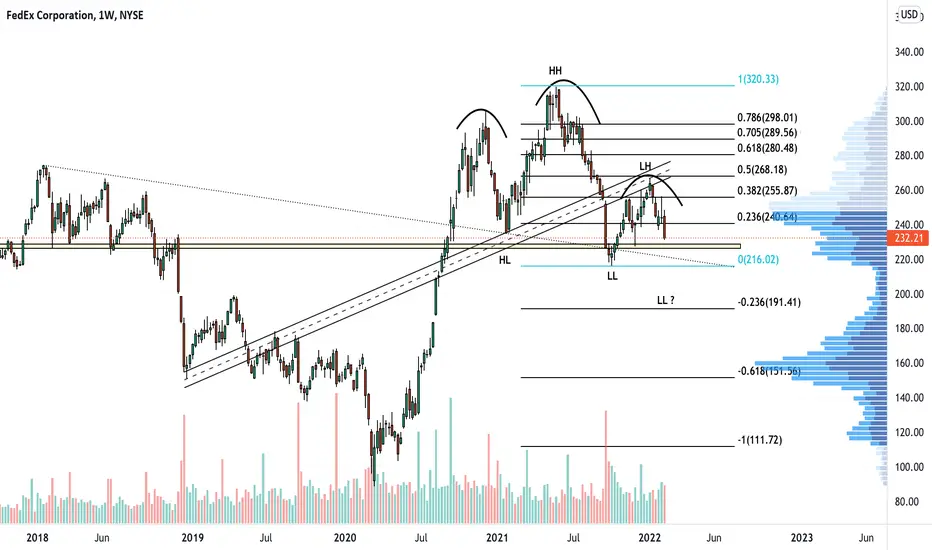
$FDX has a massive head and shoulders. A smaller one has formed on this right shoulder which can be a trade in and of itself, but for the present I'd like to focus on the larger one.
A head and shoulders is characterized by 3 high peaks, the middle one being the highest of the 3. Traders often enter at a break or retest of the neckline due this being 'confirmation' of the impending downside move. In this chart, we did a fibonacci retracement from the HH (higher high) to the LL (lower low). A clean rejection at the 0.50 fibonacci so far as led to a $36 downside move.
I don't think we're done yet though. I believe we will see at bare minimum: $216 and very possibly even $191.
Hopefully this analysis/breakdown is helpful. Please like and follow!
Warwick, OptionsSwing Analyst
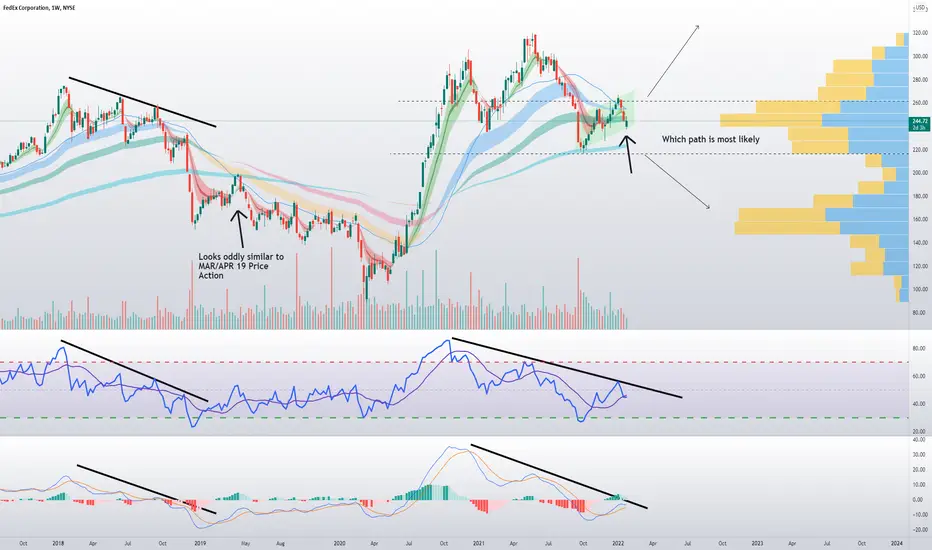
$FDX Weekly - what is the path of least resistance ? FDX weekly - is the shaded box "higher lows" and thus preparing for a rally to ATHs ? Or is the shaded box a Bear flag with a break down imminent.
Time will tell ... Looks oddly similar to APR-MAY 2019 price action
My bias is to the downside but will wait for confirmation - no trade for me ... yet
Is this a double top for FDX (Fedex Corporation)Wait for price to close below trend line in considering a short opportunity.

#FDX $FDX looking to break out upwards strong trend from DecFDX has shown a solid pattern on the uptrend for the last month or so, and is currently within reach of ATH. Shipping is getting more expensive, and FDX is in the process of a share buyback program. I can see this going to 285 or so, top of 300.
NFA
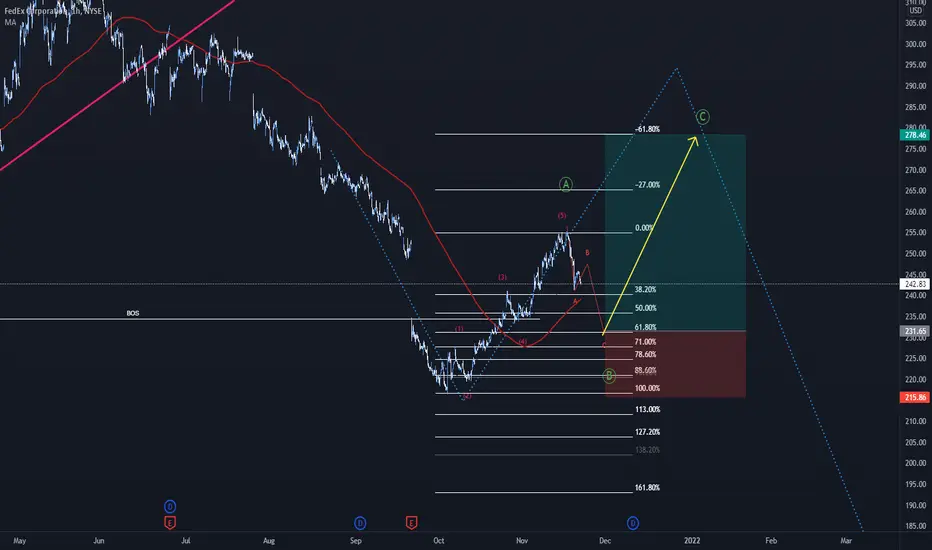
Fedex one more run, sure let's rideAlright drill starts here again Monthly in Red, Weekly in Blue and Short term in Pink
Ok so we are in ABC pattern in short term and that leads us to a touch of 23% monthly target and also 100% extension short term. Honestly I am looking at mid range between 50% and 61.8% weekly target, it all depends upon the risk you can take. Weekly 23% can be a stop loss , we are exactly at 38% weekly. Remember this is my opinion and not any kind of advise. I learned hard way and I am presenting things as simple as possible. I am ready to learn from you if it can be simpler than this. Good luck.