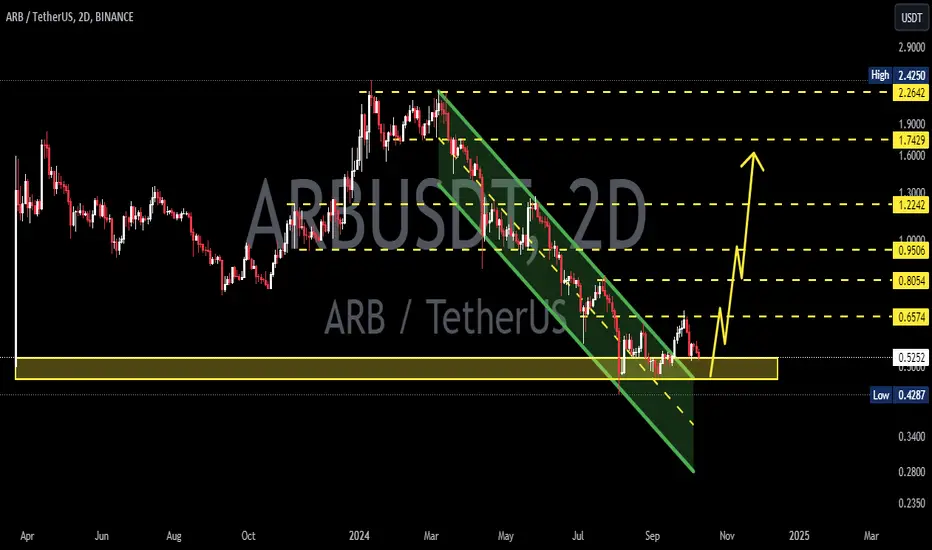
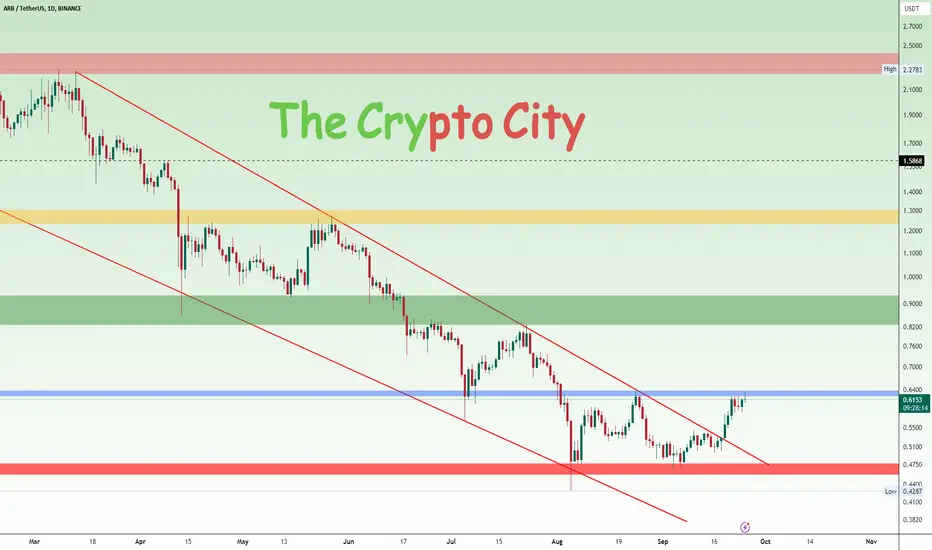
ARB Long SetupARB has dipped lower to sweep the low and garb the liquidity, and from a strong support level, the trend reversed to an upward movement by breaking through the trendline resistance.
Now, we just need to wait for a pullback into the discount zone, where we can place several limit orders in anticipation of a stronger upward move.
ARBUSDT.P trade ideas
ARBUSDTARB ~ 2D ✅
#ARB Do you still have Conviction on this coin? If yes,. perhaps this support block will be an interesting purchase for now.
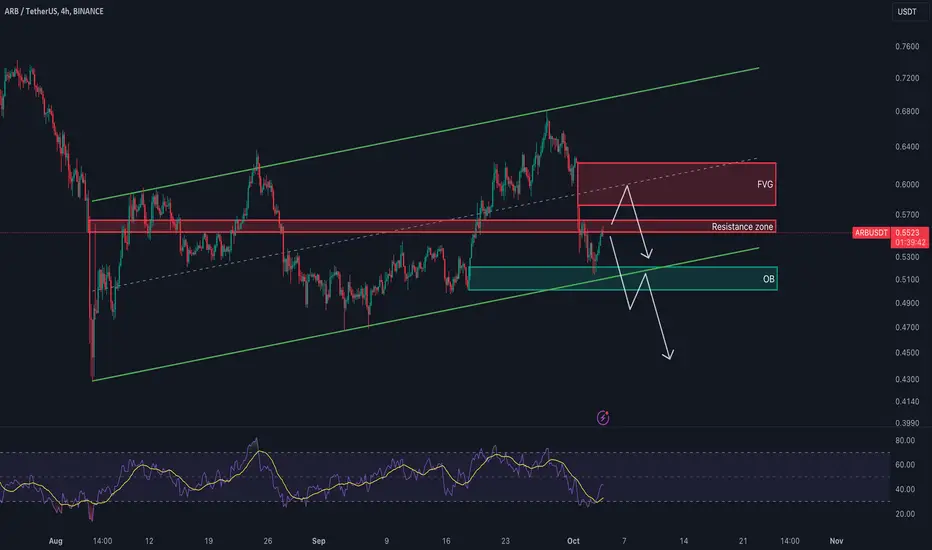
ARB USDTWe can expect a rejection from the resistance zone and the above FVG, RSI also can down more, So price can also down with that
ARB could drop until 0.7$ and more i think ARB could drop until 0.7$ and more , maybe we will see a move up then go down and thant it will be like last kick for ARB
this is just an analyse , be carfull with this coin

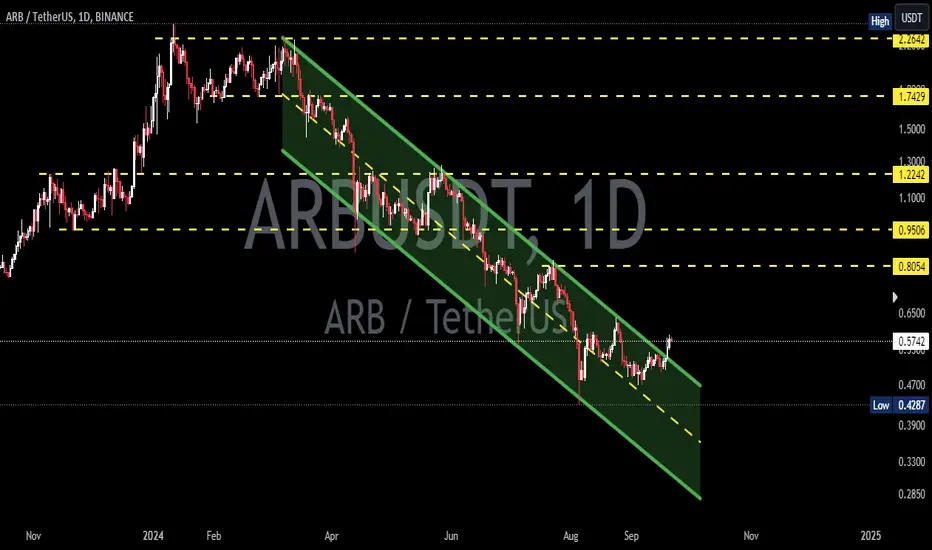
ARB USDTARB has just broken above the Descending Channel after a solid push from the support zone at $0.4565 to $0.4786 marked in Red . This is a significant move, as ARB has been consolidating between support zone in Red and the resistance zone at $0.6238 to $0.6390 from approximately 54 days, and approximately trading within the descending channel from 184 days.
The price of ARB has to break above the resistance zone in Blue for bullish moves. If it clears this zone, the next target will be the major resistance zone at $0.8263 to $0.9312, which could potentially ignite a strong upward rally.
If ARB loses momentum, we could see a pullback to retest the descending channel upper trendline or the support zone in Red.
ARBUSDTARB ~ Update
#ARB It finally broke through the resistance line of this descending pattern. Bulls should start to take control from here.
Breakout Alert: #ARBUSDT Breaks Out of Descending Channel Yello, Paradisers! Could we be standing on the edge of a major market move for #Arbitrum? Let's break it down and see what's happening with #ARBUSDT:
💎#ARB has just broken above the Descending Channel formation after a solid push from the demand zone at $0.497. This is a significant move, as AMEX:ARB has been consolidating within this formation for the past 4-5 months, and now, this breakout opens up the possibility of a bullish rally toward the internal resistance.
💎To confirm this bullish scenario, we will need to see #ARB break above the key internal resistance at $0.637. If it clears this level, the next target will be the major resistance zone, which could potentially ignite a strong upward rally.
💎But here’s the catch: If #Arbitrum loses momentum, we could see a pullback to retest the breakout near the demand zone. If it fails to hold this level, the next likely target is the lower support at $0.428.
💎A breakdown below this lower support would invalidate our bullish outlook, handing complete control over to the bears, and #ARB could continue its decline.
Stay focused, patient, and disciplined, Paradisers🥂
MyCryptoParadise
iFeel the success🌴

#ARB/USDT#ARB
The price is moving in a downtrend on the 4-hour frame and is about to rebound down
We have a trend to stabilize below the moving average 100
We have a downtrend on the RSI indicator that supports the rise by breaking it upwards
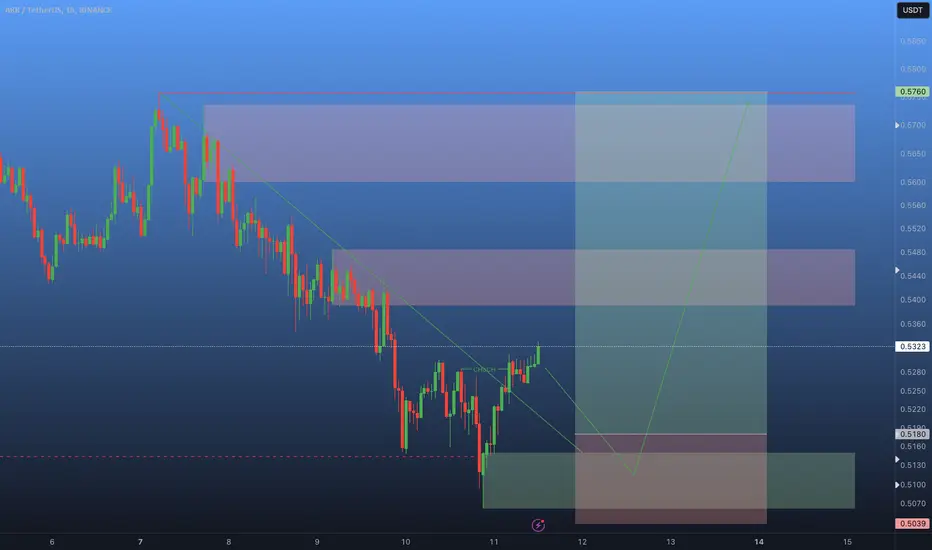
We have a resistance area at the downtrend of the channel at a price of 0.5040
Entry price 0.5032
First target 0.4888
Second target 0.4685

Arbitrum breaking outLayer 2 cryptos are very important now and could be lifted during this cycle.
I don't think we are in crypto "party mode" yet, but looking closer. It is important to monitor whether this move-up consolidates during the following days.

ARB/USDT 15m 1h OB-MSS-EQH-FVGA good entry was made with a 0.15% drawdown from the hourly order block after MSS confirmation, with a 1:6 risk-reward ratio. The target is to take out the local equal highs in the daily imbalance zone. I'll see what the market forms there. There's a possibility of reaching the midpoint of the imbalance at 0.5520

ARBUSDT - forming the bottomhi traders,
Let's take a look at ARBUSDT on a 3D time frame.
In my opinion, the bottom may be in.
Bullish divergences on 3D time frame are about to play out.
Many traders are bearish at the bottom, but here it is clear to me that it's time to accumulate cheap ARB.
The entry, stop loss, and 2 targets are shown on the chart.
Good luck!

LONG TRADE ARB/USDT ON 1H TF WITH CONTINUATION PATTERNHere ARB/USDT started its movement upside on 1H, making continuation pattern (SYMMETRICAL TRIANGLE).

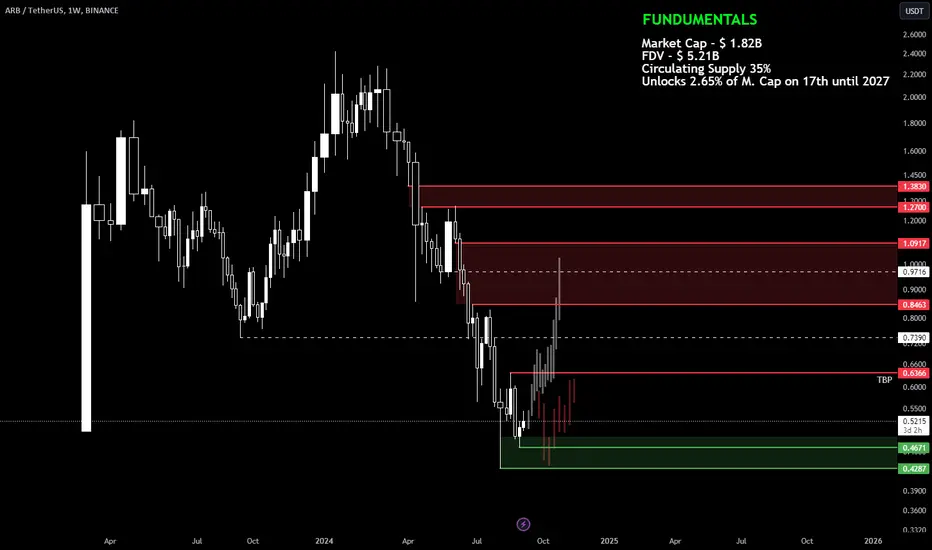
ARB - Trading Plan on the 1W Timeframe🔻Trend Break Point: Price needs to hold above $0.64 for a potential bullish trend break.
🔻Decision Zone: Key levels to watch for full profit-taking or continuation are $0.9 - $1.1.
🔻Fundamentals: After the Sybil airdrop rush, activity has significantly decreased. Monthly token unlocks every 16th could lead to manipulative movements.
🔻Downside Risk: If the lows are broken, it’s difficult to determine the next support level as the chart shows a potential freefall. Prices below this point are highly speculative.
🟢Green zone = buying opportunities. 🔴Red zone = selling or profit-taking zones. Watch for price action and setups in these key areas.
#ARB potential breakoutHere we have a double bottom at crucial support. If we breakout of the downtrend and get a confirmation we can expect to touch the next resistance at 0.75. If we breakdown, we will see new lows!
ARBUSDT XABCD Pattern ARBUSDT has very great Technical and Chances for going upto 120% Up from this position as it is at the low and Trend Changing Position.

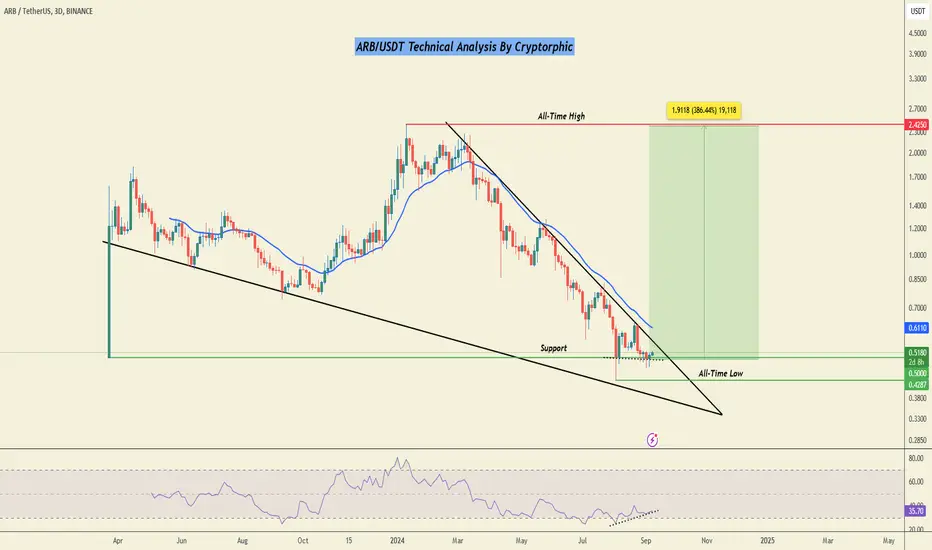
ARB Technical Analysis in a 3-Day TimeframeHello everyone, I’m Cryptorphic.
I’ve been sharing insightful charts and analysis for the past seven years.
Follow me for:
~ Unbiased analyses on trending altcoins.
~ Identifying altcoins with 10x-50x potential.
~ Futures trade setups.
~ Daily updates on Bitcoin and Ethereum.
~ High time frame (HTF) market bottom and top calls.
~ Short-term market movements.
~ Charts supported by critical fundamentals.
Now, let’s dive into this chart analysis:
ARB recently reached a new all-time low of $0.4287. The current price of $0.5125 is holding at a support line and is likely to break out above the resistance trendline and the 21 EMA.
Once the price breaks above the resistance level, it will need to remain above it until the 3-day candle closes to stay on a bullish track.
The RSI is showing a bullish divergence, indicating a potential bullish move for ARB. All it needs is a breakout and a close above the resistance level.
Key levels:
- Primary Support/Entry: $0.5.
- Lower Support/Accumulation: $0.3718 to $0.4287.
- Resistance: $0.54-$0.61.
- Target: $2.425.
DYOR, NFA.
Please hit the like button to support my content and share your thoughts in the comment section. Feel free to request any chart analysis you’d like to see!
Thank you!
#PEACE
ARB, great time to go long.The asset is a great buy when Bitcoin falls, as soon as Bitcoin goes up we will see a boom. We have completed the 2nd wave of correction, a quick 3rd wave awaits us.

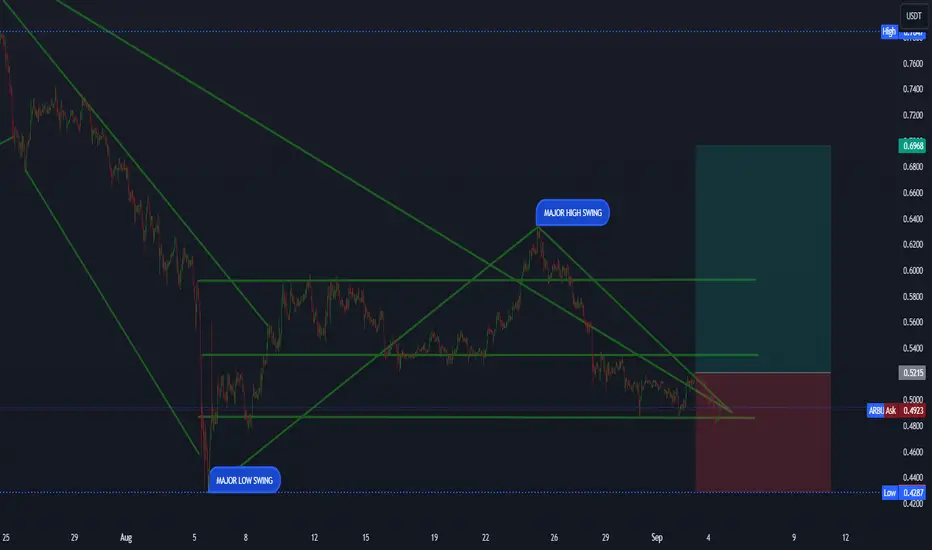
ARBUSDT 1D - HAS IT TOUCHED BOTTOM?ARBUSDT 1D - HAS IT TOUCHED BOTTOM?
It marked historical lows on August 05, 2024 at 0.43
ARB Historical Price
24h Range
$0.4888 – $0.5133
7d Range
$0.4835 – $0.5307
All-Time High
$2.39 79.3%
Jan 12, 2024 (8 months)
All-Time Low
$0.4316 14.7%
Aug 05, 2024 (about 1 month)
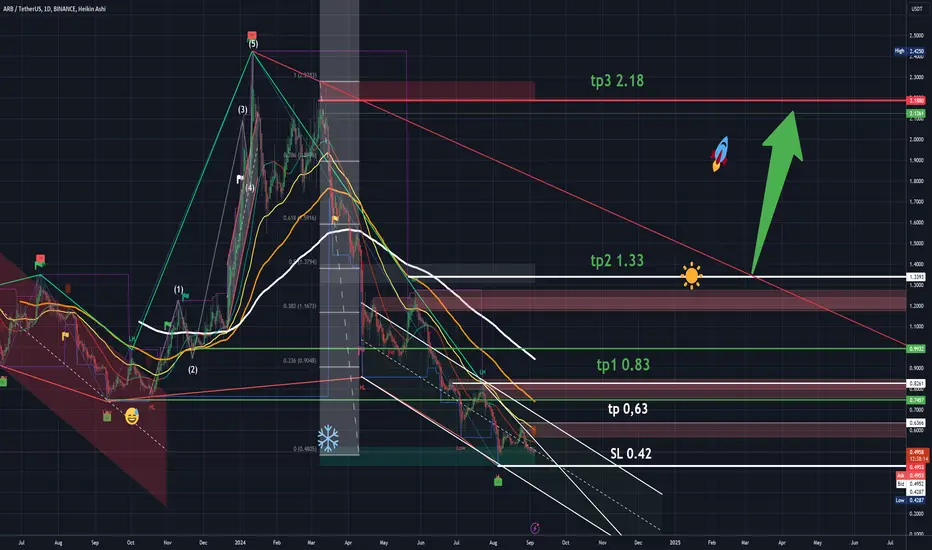
SL 0.42
TP 0.63
TP1 0.83
TP2 1.33
TP3 2.18
The RISK - REWARD equation in this value is worth it, but it is not a question of rushing. You just have to wait to see how it behaves in this area and establish a bullish structure breakout strategy again.
ARBUSDT ANALYSISthis is research are base on my knowlegde and skills i hope you understans guys. im open on your feedback guys. actually your feedback on my work is made me a better trader someday .... thank you for your support guys
Risky Long Position on ARBUSDT / Trading SetupBINANCE:ARBUSDT
COINBASE:ARBUSD
SL1 ---> Low-risk status: 3x-4x Leverage
SL2 ---> Mid-risk status: 5x-8x Leverage
👾The setup is active but expect the uncertain phase as well.
➡️Entry Area:
Yellow zone
⚡️TP:
On the Chart
🔴SL:
On the Chart
🧐The Alternate scenario:
If the price stabilizes below the trigger zone, the setup will be cancelled.

ARB/USDT 15m / D BB & FVG / ELLIOT / LIQUIDATIONS / FIBOAccording to higher timeframes, the market sentiment is bullish. We are moving within an ascending channel with the potential to rise to 0.7416. To increase the probability of this outcome, the price needs to establish itself above the ascending channel.
Locally, within the range of the daily breaker block (D BB) and the daily imbalance (D FVG), three potential entry points are visible:
1. Liquidity grab (Sellside liquidity)
2. 0.5 Fibo
3. 0.618 Fibo / bottom of the ascending channel
4. The target is the local high, which is at the midline of the channel.
Locally, based on the EFIATR oscillator, volume, and liquidation levels, there is a likelihood of growth. According to Elliott Wave theory, a 5-wave pattern and an ABC correction in the 4th wave are visible, which further increases the probability of upward movement.

ARBUSDT 1WARB ~ 1D
#ARB Make purchases gradually in this descending pattern. it is only a matter of time that this descending pattern will be broken.

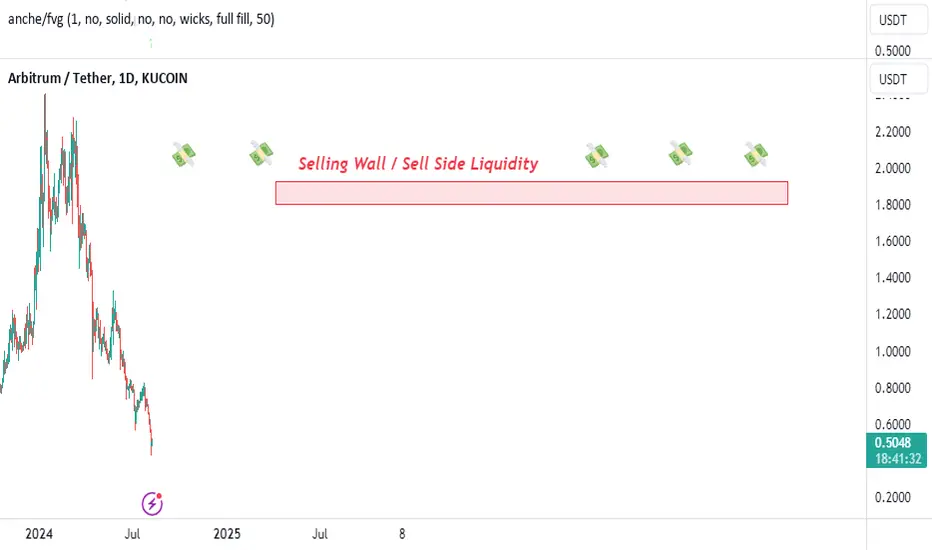
#ARB 2 Dollar.. Exit Pump.There is a very high chance that ARB will come to take liquidity on the sell side. If you have #ARB, hold onto it, as it will pump very quickly.