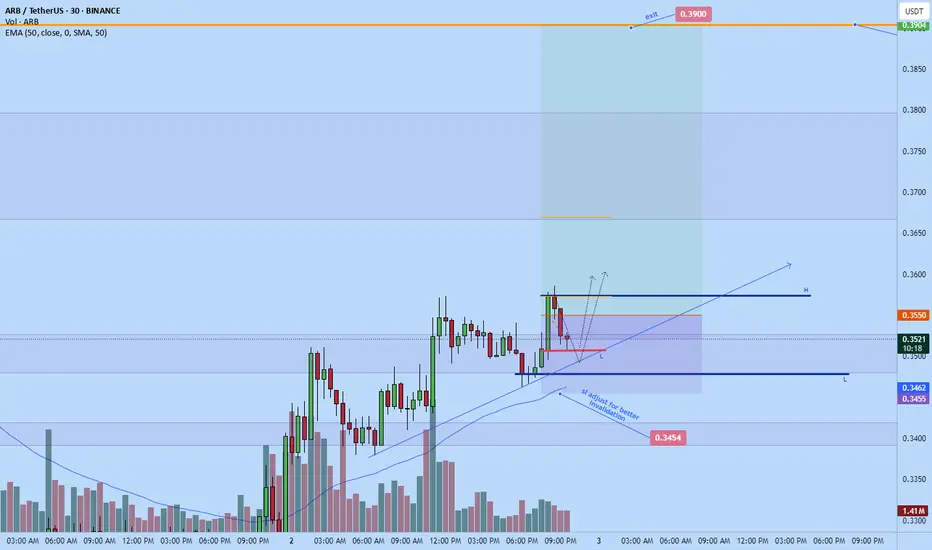
Arbitrum long to $0.3904I recently opened a long position on Arbitrum
SL: $0.3454
Tp $0.39
Currently in draw down, anticipating a push back up soon. So anyone seeing this now can get a better entry than me and can even move stop a bit lower to like $0.3445 for a comfortable stop placement as mine is still a little tight
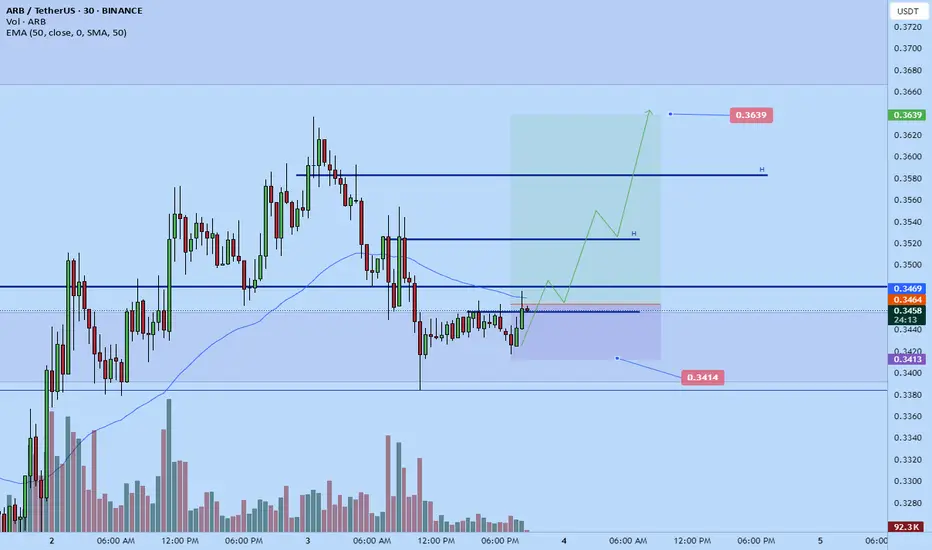
Arbusdt long to $0.3639Based on my analysis arb is likely to push back up before the weekend . I think its at a good level right now and likely to t break to the upside soon. Its not the cleanest of setup, its more of a anticipation of bullish trend shift setup. Structurally price is in a down trend on the 1h tf but its a
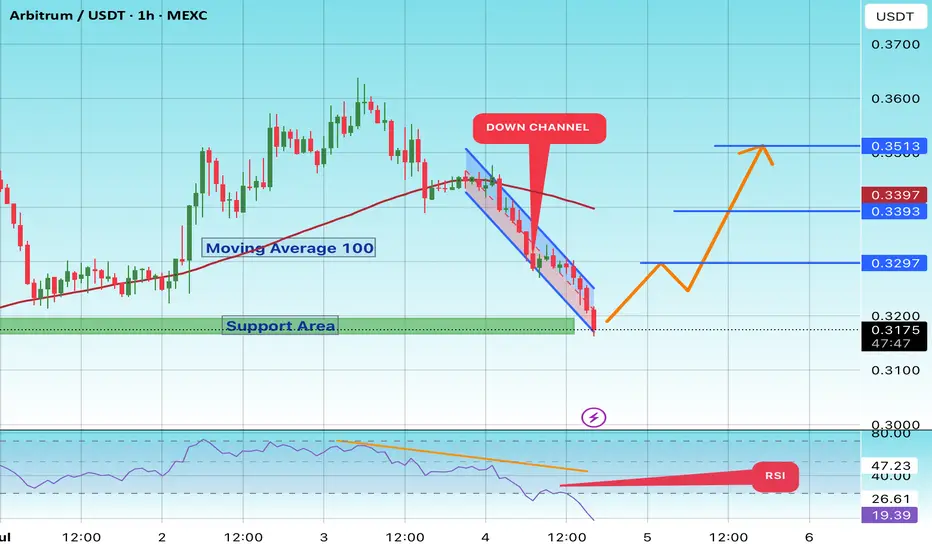
#ARB Can Long Soon#ARB
The price is moving within a descending channel on the 1-hour frame and is expected to break and continue upward.
We have a trend to stabilize above the 100 moving average once again.
We have a downtrend on the RSI indicator that supports the upward move with a breakout.
We have a support a
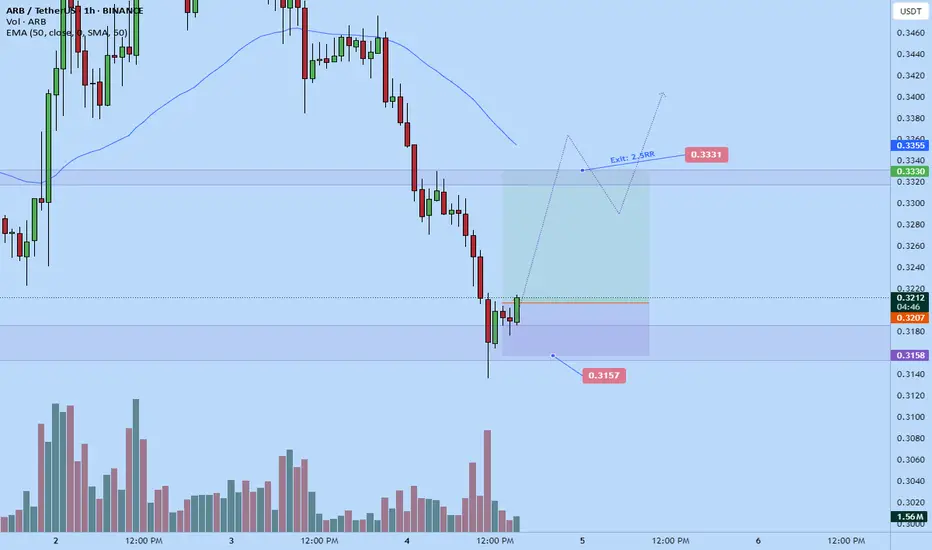
Arbitrum scalp long to $0.3331Just now opened up a scalp long on arb.
2.5RR
Aiming for $0.3331 . The market have fallen relatively low and is a daily demand / support. I think there's a good probability we'll correct back up a bit before end of day.
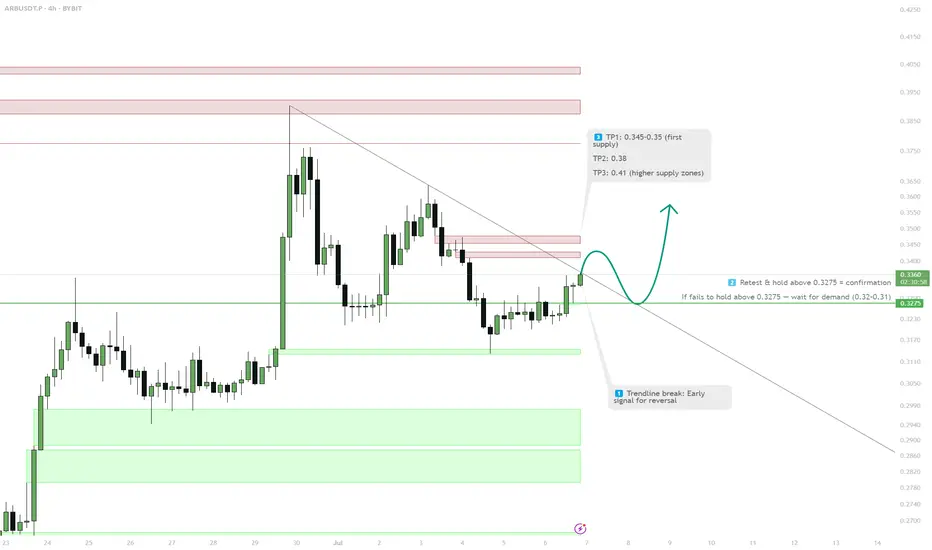
ARB — 4H Supply Break & Trend Reversal1. Watch for confirmed trendline break
2. Retest & hold above 0.3275 for entry
3. TP1: 0.345–0.35 / TP2: 0.38 / TP3: 0.41
4. If fails, watch demand zones below
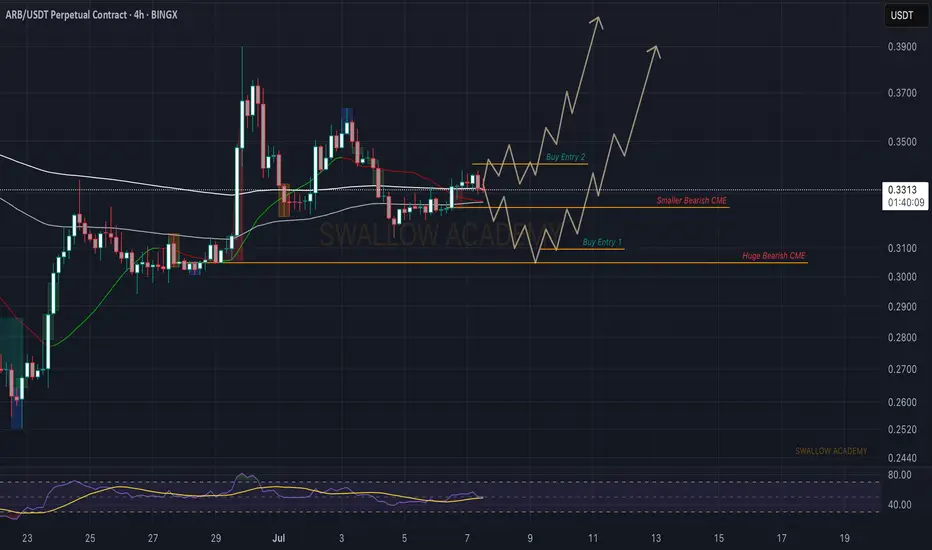
Arbitrum (ARB): Looking For Buy Entry | 2 Zones To Keep an EyeArbitrum caught our attention with potential buy zones that we might be seeing pretty soon. We are looking for slight downward movement from here toward the major CME gap, which would be an ideal area for a buy entry, once we form the proper MSB there, so that's what we are looking for.
Swallow Aca
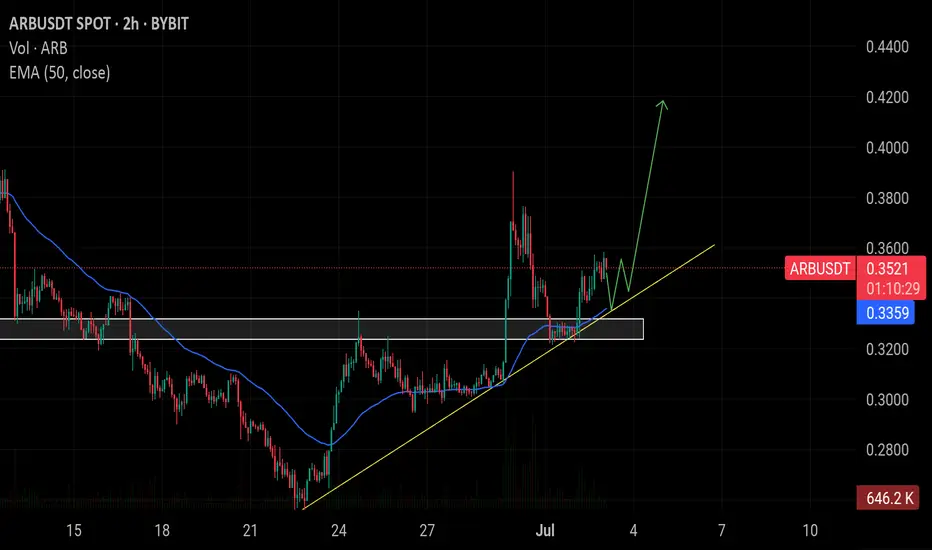
$ARB showing strength above the trendline support and 50 EMA. AsAMEX:ARB showing strength above the trendline support and 50 EMA. As long as it holds above the $0.33–$0.34 zone, a continuation towards $0.40+ looks likely. Watch for retest and bounce for possible long entry.
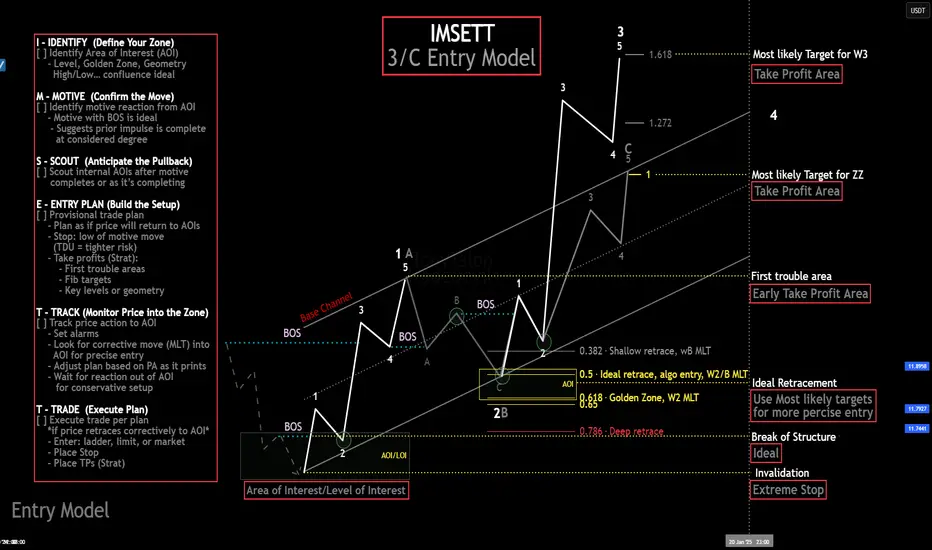
My Ideal Elliott Wave Entry ModelThe IMSETT 3/C Entry Model.
Every trader wants to catch the big moves the ones that pay quickly and decisively. In Elliott Wave, those moves often come during Wave 3. It's the strongest part of the trend, and when you're positioned early, the risk-to-reward is unmatched.
But not every opportunity
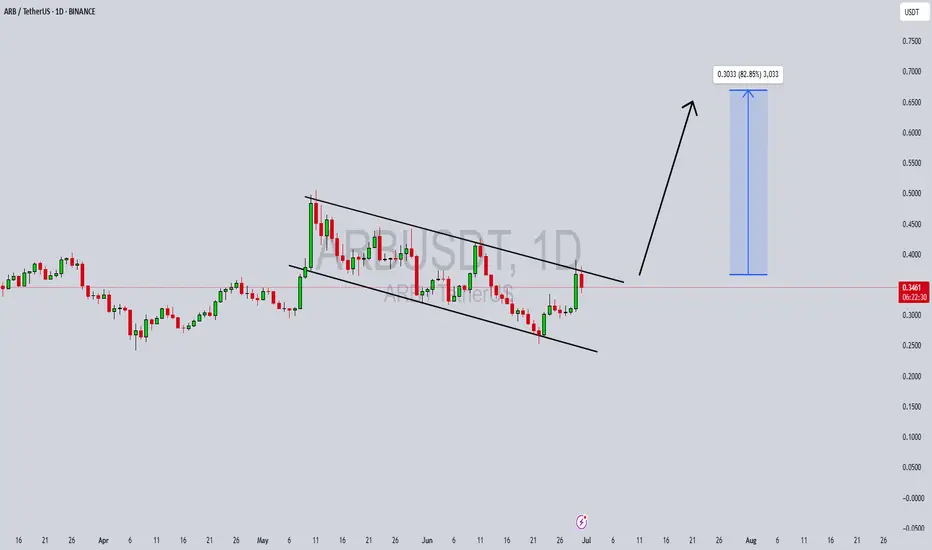
ARBUSDT Forming Descending ChannelARBUSDT is showing an interesting setup with its clear descending channel pattern on the daily chart, signaling a potential reversal is on the horizon. This technical formation suggests that the bearish momentum may be exhausting and that a breakout could pave the way for a strong bullish wave. Trad
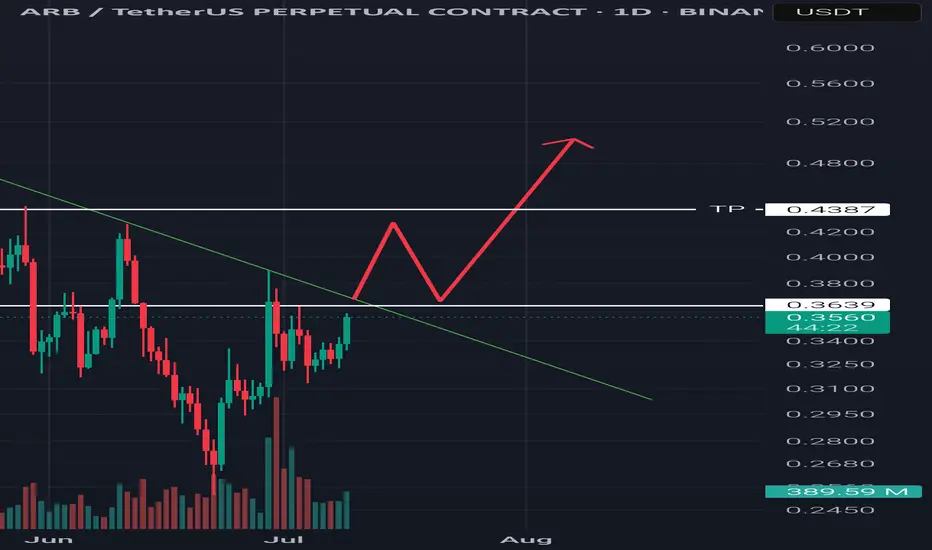
ARB/USDT Analysis – Potential Breakout Ahead?📅 Timeframe: 1D
💰 Current Price: $0.3559 (+5.33%)
📊 Volume Spike: 389.18M
ARB is currently testing a descending trendline resistance that's been respected since mid-May. Price action has formed a base around the $0.35 level and is now showing signs of strength with a recent bullish candle.
📈 Key L
See all ideas
Summarizing what the indicators are suggesting.
Oscillators
Neutral
SellBuy
Strong sellStrong buy
Strong sellSellNeutralBuyStrong buy
Oscillators
Neutral
SellBuy
Strong sellStrong buy
Strong sellSellNeutralBuyStrong buy
Summary
Neutral
SellBuy
Strong sellStrong buy
Strong sellSellNeutralBuyStrong buy
Summary
Neutral
SellBuy
Strong sellStrong buy
Strong sellSellNeutralBuyStrong buy
Summary
Neutral
SellBuy
Strong sellStrong buy
Strong sellSellNeutralBuyStrong buy
Moving Averages
Neutral
SellBuy
Strong sellStrong buy
Strong sellSellNeutralBuyStrong buy
Moving Averages
Neutral
SellBuy
Strong sellStrong buy
Strong sellSellNeutralBuyStrong buy
Displays a symbol's price movements over previous years to identify recurring trends.