ARBUSDT: Strong Buy Opportunity with Bullish IndicatorsARBUSDT is currently trading at $0.550, and several technical indicators suggest a bullish reversal is imminent, presenting a strong buying opportunity. The Relative Strength Index (RSI) has recently crossed above 50, indicating increasing bullish momentum. The Moving Average Convergence Divergence (MACD) histogram is showing diminishing bearish momentum, with the MACD line poised to cross above the signal line, which is a traditional buy signal.
Moreover, the price action has formed a strong support zone around $0.54, which has been tested multiple times and held firm. This support level indicates a potential bottom, suggesting that the downward movement may be exhausted. Additionally, the 50-day Moving Average is trending upwards and approaching the 200-day Moving Average, setting up a potential golden cross, which is a highly bullish indicator.
The volume profile also supports a bullish outlook, with increasing buying volume around the current price level, indicating strong accumulation by market participants. Furthermore, the recent price action shows the formation of a bullish hammer pattern on the daily chart, which often signals a reversal in trend.
The Fibonacci retracement levels also provide a positive signal, with ARBUSDT holding above the 61.8% retracement from its previous swing low, indicating strong underlying support and the potential for a rebound.
Given these indicators, the current price of $0.550 presents a compelling entry point for traders looking to capitalize on a medium-term bullish move. Investors should consider accumulating ARBUSDT at this level and holding in anticipation of a significant price rise. A return to the $0.65-$0.70 range appears plausible, given the technical setup and historical price action. This confluence of signals makes the current market conditions an opportune moment to buy, with the potential for substantial gains as the market sentiment shifts towards bullishness.
ARBUSDT.PS trade ideas
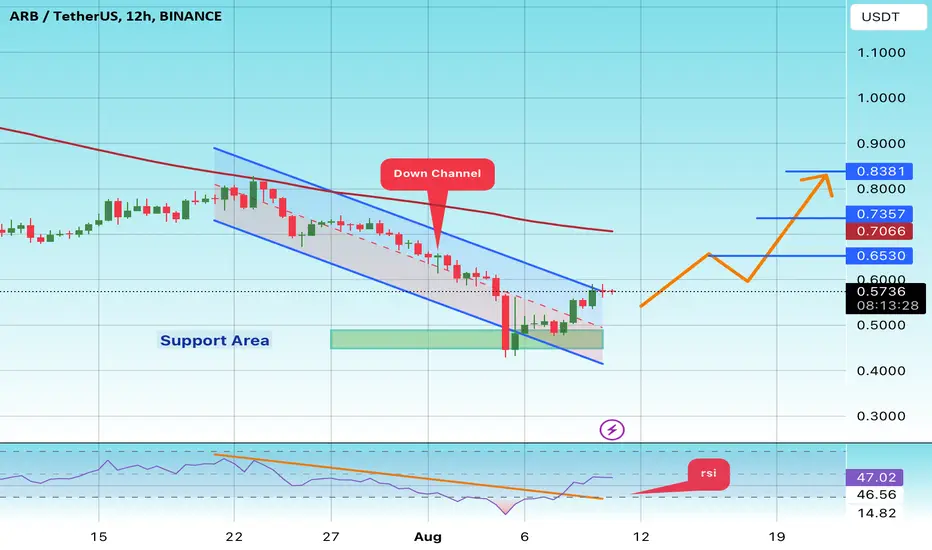
#ARB/USDT#ARB
We have a downtrend pattern on the 12-hour frame, the price is moving within it and adhering to its boundaries well
We have a support area in green at 0.4700 after the price touched it and bounced from it
We have a trend to stabilize above the 100 moving average
We have a downtrend on the RSI indicator that supports the price upwards
Entry price 0.5720
First target 0.6530
Second target 0.7357
Third target 0.8380
Arbitrum Price Analysis Signals Potential UpsideBINANCE:ARBUSDT has shown mixed signals in its recent price action, with momentum indicators hinting at potential upward movement while still facing significant resistance. Over the past few sessions, ARB has oscillated within a relatively narrow range, indicating that market participants are still weighing their options amid broader market conditions.
The Arbitrum price has been trading around the $0.5654 mark, showing resilience despite facing significant resistance at higher levels. The first major resistance at $0.6538 is crucial, as a break above this level could trigger further gains, potentially leading the pair to test the $0.676 resistance level. A sustained rally above $0.676 would open the door to a challenge of the $0.6954 level, which marks a key psychological barrier.
On the downside, the $0.4828 level serves as the immediate support, with the $0.4466 level providing a stronger safety net in case of bearish pressure. A breach below these support levels could see the pair revisiting lower price territories, potentially leading to a deeper correction.
Meanwhile, the 9 EMA has recently crossed above the 20 EMA, signaling a short-term bullish trend that could attract more buyers. This crossover is often seen as an early sign of a potential rally, suggesting that the bulls might be gaining control. However, the pair is still hovering close to its resistance levels, making the next few trading sessions critical.
The MACD histogram remains in positive territory, reinforcing the idea of a bullish momentum build-up. However, the MACD line is approaching its signal line from above, which could indicate a slowing momentum if a crossover occurs. Traders should watch for any signs of divergence, which might suggest an impending reversal.
The RSI, currently around the 58.8 mark, indicates that the asset is neither overbought nor oversold, providing room for further movement in either direction. This neutral stance suggests that traders should be cautious and wait for a more definitive trend to develop before committing to large positions.
For traders looking to go long, a break above the $0.6538 resistance level could be an ideal entry point, with a target towards the $0.676 and $0.6954 levels. On the other hand, those anticipating a reversal might consider entering a short position near these resistance levels, particularly if the price shows signs of stalling.
Given the current market conditions, a stop loss just below the $0.4828 support level for long positions or above the $0.6954 resistance level for short positions could help mitigate risks.
Overall, recent movements of the Arbitrum price and technical indicators suggest that while there is potential for upside, significant resistance levels need to be overcome for a sustained rally. Traders should closely monitor these levels and use them as key decision points for their trades.

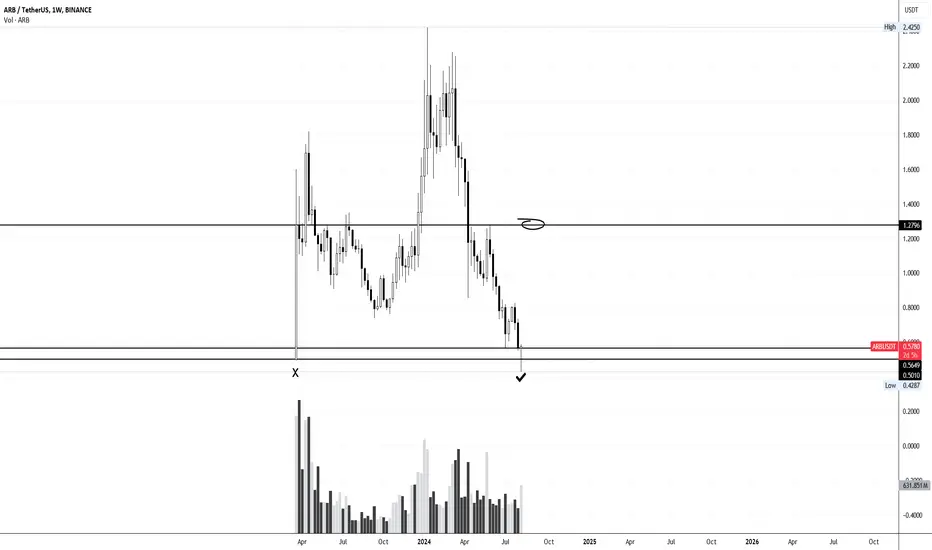
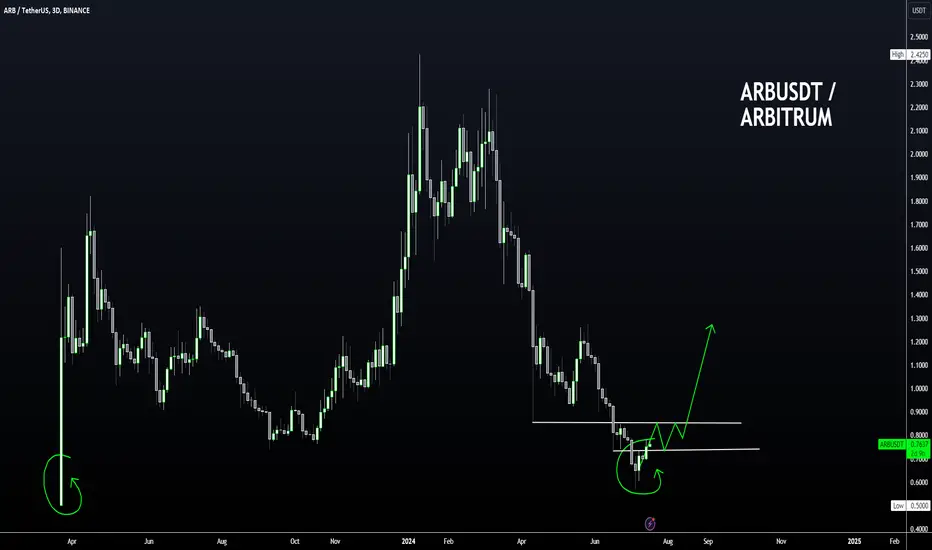
My LAST attempt on ArbitrumNow you may or may not know, that I've been trying to catch the bottom for Arbitrum for months now but it just kept making new lows over and over.
But let me tell you, this time it's different (it's probably not)...
Arbitrum dropped all the way to ~50 cent and I just can't think of anything besides some major news etc. that could make Arbitrum any lower than that... the weekly candle is already looking somewhat decent but it's the weekend ahead and still 2.5 days to got, so anything could happen.
But if this is not the bottom, I really don't know. It could all just have been a cash grab and ARB is going to disappear forever. We have seen this many time, even with the promising projects.
So, this will be the last time I'm buying ARB at current prices, target as shown in the chart. Fingers crossed.
A long trade on ARB/USDT with PRZ.ARB/USDT making a strong harmonics pattren(CRAB). We are waiting trend to be reversed.

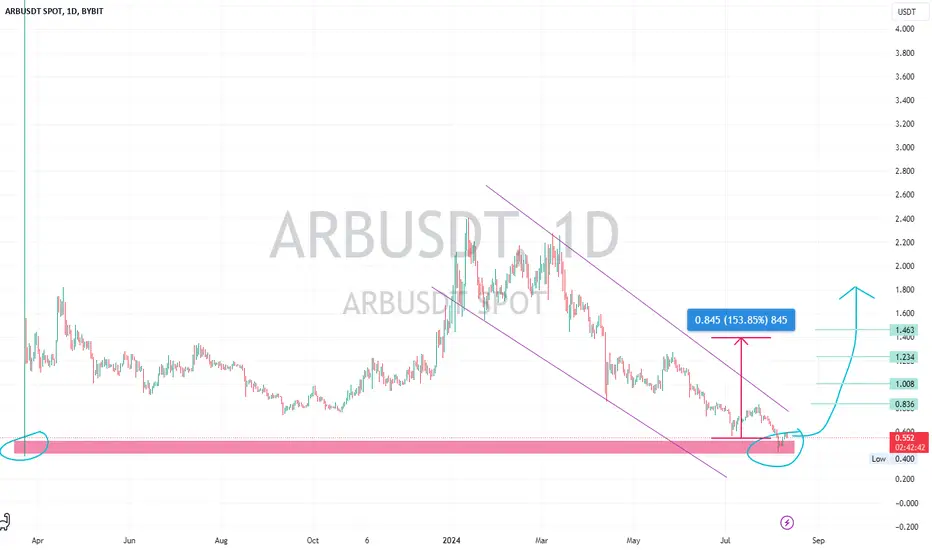
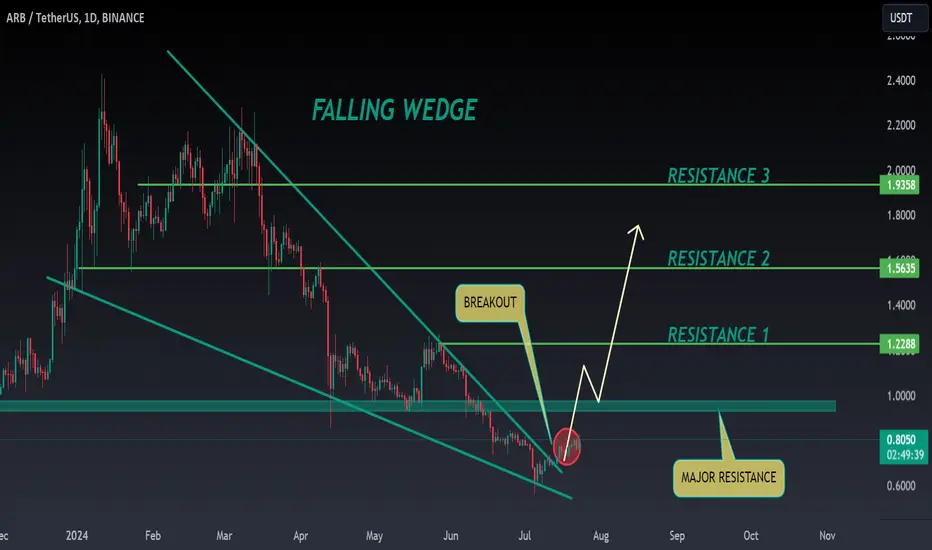
ARB ANALYSIS🔮 #ARB Analysis - Breakout 🚀🚀
💲💲 In daily time-frame, Falling Wedge Pattern is forming✅
But right now we can see that #ARB is trading around its all time low level and if #ARB breaks the pattern with high volume then we would see a bullish move 💯🚀
💸Current Price -- $0.5100
📈Target Price -- $1.2190
⁉️ What to do?
- We have marked crucial levels in the chart . We can trade according to the chart and make some profits. 🚀💸
#ARB #Cryptocurrency #Breakout #DYOR

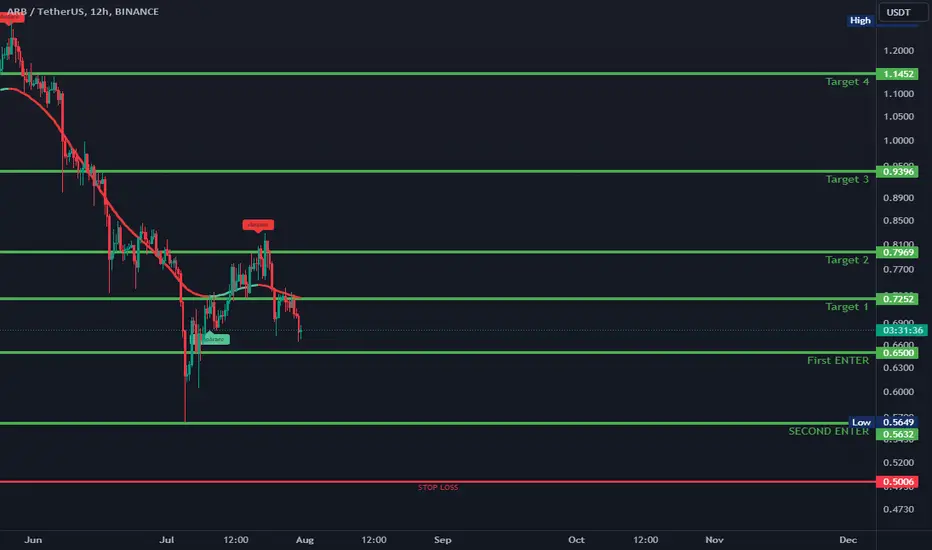
ARBUSDT LONG✉️ Pair: ARBUSDT
📈 Direction: Long
💯 Leverage: Cross 5X - 10X - 20X
📊 Entry 1: $0.6501
📊 Entry 2 (DCA): $0.5649
✅ Target 1: $0.7250
✅ Target 2: $0.7969
✅ Target 3: $0.9396
✅ Target 4: $1.1452
⛔️ Stop Loss: $0.5000
Analysis:
Arbitrum has exited the ascending channel and continues its downward trend on the daily timeframe, respecting the descending trend line and breaking the support level of $0.7350-$0.7850. This suggests a potential continued decline towards $0.5000. However, if the price manages to break and confirm a break above the dynamic resistance, it could signal a trend reversal. In this case, entry is recommended at $0.6501, with a second buying opportunity (DCA) at $0.5649.
The targets are set based on the potential recovery and trend reversal:
Target 1 at $0.7250 reflects a significant initial resistance.
Target 2 at $0.7969 and Target 3 at $0.9396 are higher resistance levels that could be reached during a positive trend.
Target 4 at $1.1452 is a more ambitious long-term goal, considering a potential complete reversal of the downward trend.
The stop loss is set at $0.5000 to limit risks in case the price continues to decline below the major support level.
ARB/USDT possible long opportunity.
ARB/USDT - Futures
Spotted the liquidity yesterday and set a Long limit order.
After the liquidity grab, the trade triggered and delivered 100% before coming down.
The pair has created another liquidity below at 0.6964 as you can see on the chart and there's another buy Buy opportunity.
Would you take this trade?

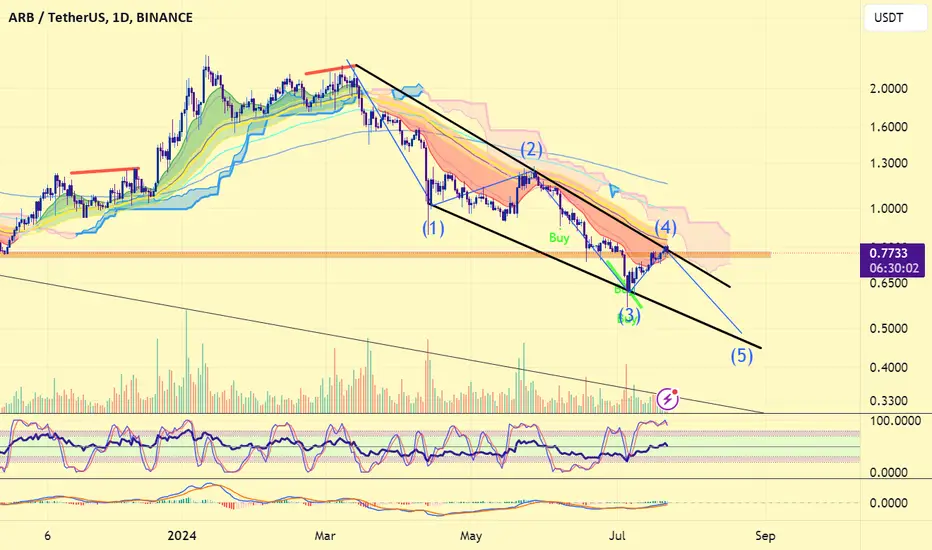
ARBUSDT.PWe are still in downtrend on ARB on 1D TF and higher. Price has breakdown the uprising channel, retest it and now accumulating below the resistance level. The level is strong, as the lower border of the uprising channel stays together with strong horizontal channel, and we got rejection from it. Expecting trend continuation to the next support zone.
DYOR


Arbitrum ARB price is still in the downward trendEverything that was given away relatively “for free” by ARB , CRYPTO:STRKSUSD , CRYPTOCAP:W - you can write your own options in the comments - is mercilessly falling in price.
For example, #Arbitrum was distributed for $1 billion+, and now the “happy ARB holders” are patiently waiting for someone to buy this “very necessary asset” and they will sell it at a x3 premium)))
And who needs an ever-falling asset?
Well, certainly not retails ... and it does not "exist" at the current stage of the market...
“Big money” - maybe, but before that, they need to be able to buy out the ‘controlling stake’ of coins at a very laaaarge discount. And only then can they start a systematic pumping.
Therefore , in our opinion, until the OKX:ARBUSDT price breaks through the blue trend line and consolidates above $0.80, it is not worth looking in its direction, because there will be no "power" and money there.
_____________________
Did you like our analysis? Leave a comment, like, and follow to get more

Arbitrum to the Moon: Strategic Targets and Growth PotentialDonald Trump spoke at the Bitcoin conference. I decided to watch it again. Here's a brief summary:
1. The USA will become the cryptocurrency capital of the world.
2. Create a strategic Bitcoin reserve for the USA.
3. Fire Gary Gensler (SEC) on Donald Trump's first day as president.
4. Move Bitcoin mining to the USA.
And much more. I think this is the beginning of growth for Ethereum, Bitcoin, and altcoins. I gathered data from Coinbase's Orderbook and noted the large limit orders that were placed before the price correction of Arbitrum. I believe these are the approximate targets for sending Arbitrum to the Moon. The best choose Arbitrum, Optimism, and zkSync in your portfolio. May the Jedi force be with us.
#arbitrum #ethereum #optimism #DonaldTrump #zkSync

ARB ANALYSIS🔮 #ARB Analysis - Breakout 🚀🚀
💲💲 In Daily Timeframe,Falling Wedge Breakout is Done✅
But right now we can see that #ARB is trading below its crucial resistance zone and if #ARB breaks this resistance zone then we would see a bullish move 💯🚀
💸Current Price -- $0.8058
📈Target Price -- $1.9358
⁉️ What to do?
- We have marked crucial levels in the chart . We can trade according to the chart and make some profits. 🚀💸
#ARB #Cryptocurrency #Breakout #DYOR
ARB/USDT Main trend. Pivot Points.Main trend. There is a lot of hype on this cryptocurrency in the Internet space. Although according to the graph especially profit in comparison with other similar HYIP altcoins is not. Take into account and “prices” and volume, at which this cryptocurrency got to the so-called early “investors”.
Secondary trend . Medium-term, the price is in an ascending channel.
Locally at this moment in time the price is at the horizontal consolidation of the local distribution. If the price does not break and consolidate above the resistance of 1.75, a downward flag to the lower boundary of the ascending channel may be realized.
Razloki and price . Note that there was an understandable decline during the last local breakout. The next breakout will occur on 04/16/2024, which is a few days before the bitcoin halving. It is very likely that there will be a decline.
The main support zones are highlighted in gray. Also, specially drawn a simple fan, so that were clear visually dynamic support and resistance zones of the most developing trend in the future, when the price will leave the channel zone.
Local trading situation. Clearly on the linear.
The marker shows the logic and percentages of this important local reversal zone, in case of its breakout or not. Also, the meridian of the channel (green dotted line) has local resistance. Although insignificant in this trading situation. Observe risk management working with HYIP cryptocurrencies.

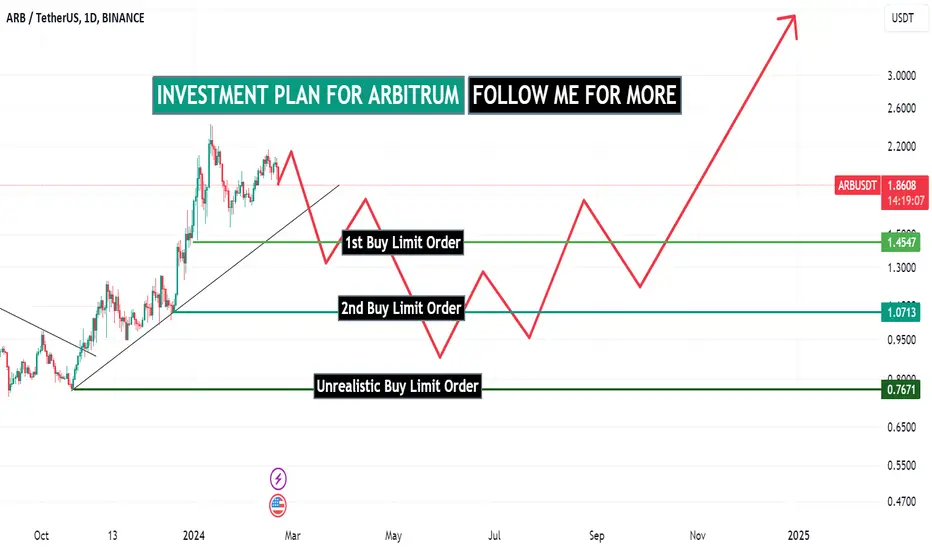
Bull Run Investment Plan for Arbitrum for 10X ProfitsDo you know that BINANCE:ARBUSDT has never experienced any bull season before?
Because of its onchain data, I am extremely bullish on Arbitrum as it has the potential to hit $25B mcap in the next bull season.
If you are not positioned on ARB coin yet, now you have a detailed plan on how to get into the coin.
Set your limit orders according to the plan.
No take profit until we get 800% returns on investment because I will be visiting this plan as often as I can for updates.
What do you think about this plan?
If this makes sense to you, follow me now and support my idea.
Don't forget to share your thoughts with me via the comment box.
Cheers!
#ARB FOR LONG TERM HOLDERPerhaps this article will receive a lot of criticism, but this is my long-term vision, and I will follow my plan. To those who have the chance to see this analysis and perspective, I wish you good luck.

Arbitrum may do something like thisIf #arbitrum price declines here, AMEX:ARB #arb may head to complete the 5th correction wave by ~ 50 cent. Breaking out this trendline resistance invalidates the 5th wave and bounces hard.
ARB reaccumulating in September.with standard deviation Fibonacci ratios, we can see that ARB has put in its overall bottom since July 4th now in a slow period of small pumps for an overall retest of the 0.79-0.62 fib to pump higher from a retest of the 0.6200$-0.6400$ levels on ARB are where institutions will have buy orders set at.
from Q4 2023 to the end of Q1 2024 ARB has pumped during these times last year and soon we will be approaching the same monthly timeframe this year where now we see arb has pushed lower during the Q2-Q3 year of 2024 expecting a push when September hits and we will be going into Q4 of 2024.
expect ARB to break $1 in October 2024 and possibly go all the way back up to $1.81.

ALTCOINS That are STRONG NOW1) AVAX
If AVAX can close ABOVE the short term resistance zone, the way up is cleared and more upside potential becomes highly likely:
2) OPUSDT:
OP bottom should be either close, or in as it made a full retracement after the last high:
3) PALM AI
Palm has made a full retracement and filled out the opening candle. If you've been following me for a while, you'll know that this is an important metric for me to watch when buying newly released alts:
4) ARB
Incase you don't know, I have this belief on buying newly released alts where I say the price WILL return to the opening candle zones sooner or later. A healthy bounce from here is then perceived as a sign of strength as the alt is ready for more upside.
More on the above strategy here: HOW to BUY NEW ALTS:
ARBUSDT (Arbitrum) Elliott Wave Count and trade signalARB has just completed a 5-wave upside move. From what it seems, currently we might be witnessing a final corrective C-wave. After the correction is completed, we expect a strong and fast rally to the upside.

Potential Big Moves for ARBUSDT: Bullish Continuation Ahead?Yello, Paradisers! Are you ready for some potential big moves with #ARBUSDT? Let’s dive into the analysis to see what’s brewing!
💎#ARBITRUM is showing signs of a probable bullish continuation from a support zone at $0.7215. We have observed #ARB following a descending channel for a long time. Recently, after breaking above descending resistance, it’s restoring momentum at the key support.
💎If the price successfully manages to hold momentum at this support level of $0.7215, there is a great probability of a bullish ride, similar to previous behavior at this level. If #ARB manages to break above the probable resistance at $0.8516, it will likely target the next resistance zone and beyond. However, if the price fails to hold momentum at the key support, we’re expecting a probable bullish rebound from the lower demand zone around $0.6306.
💎It's vital to maintain vigilance and closely observe #ARB price movements. A breakdown below the demand area, confirmed by a daily closure, would challenge the bullish scenario and could result in further declines.
Stay focused, patient, and disciplined, Paradisers!
MyCryptoParadise
iFeel the success🌴

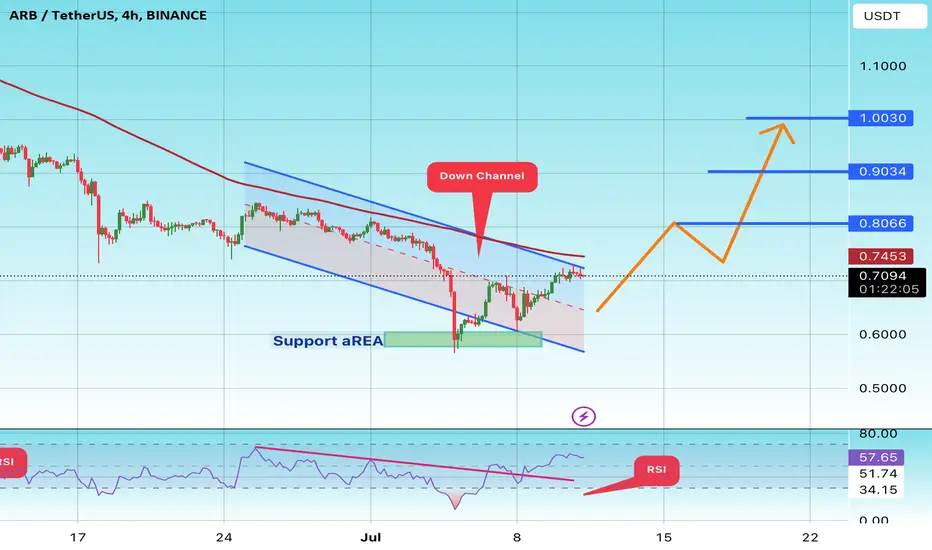
#ARB/USDT#ARB
We have a descending channel pattern on the 4-hour frame, the price is moving inside it and adhering to its borders well
We have a support area in green at a price of 0.600 after the price touched it and rebounded from it
We have a trend to stabilize above the moving average 100
We have a downtrend on the RSI indicator that supports the price upwards
Entry price 0.65
First target 0.80
Second target 0.90
Third target 1.03
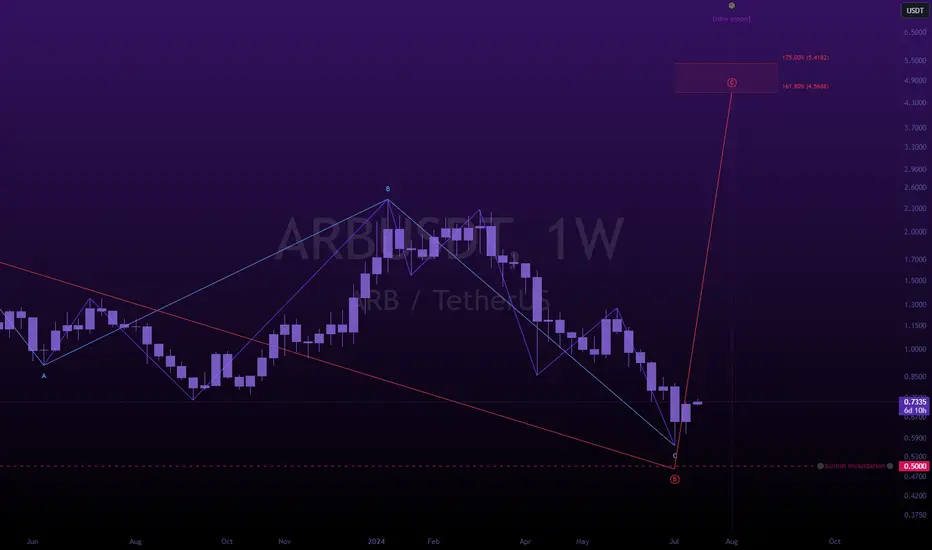
$4 arbisomeone say something about defi summer?
oh yeah, that was me.
---
im predicting arbitrum hits $4.50 into august.
---
structure is simple,
airdrop came up in 5 waves,
has since corrected in 3 waves down through an expanded flat.
expanded flat is labeled as wave (b) for strategic purposes.
some might label it as wave (2), but not me,
not this time.
---
buy arb here (market order)
tp $4+
sl 0.499
🌙