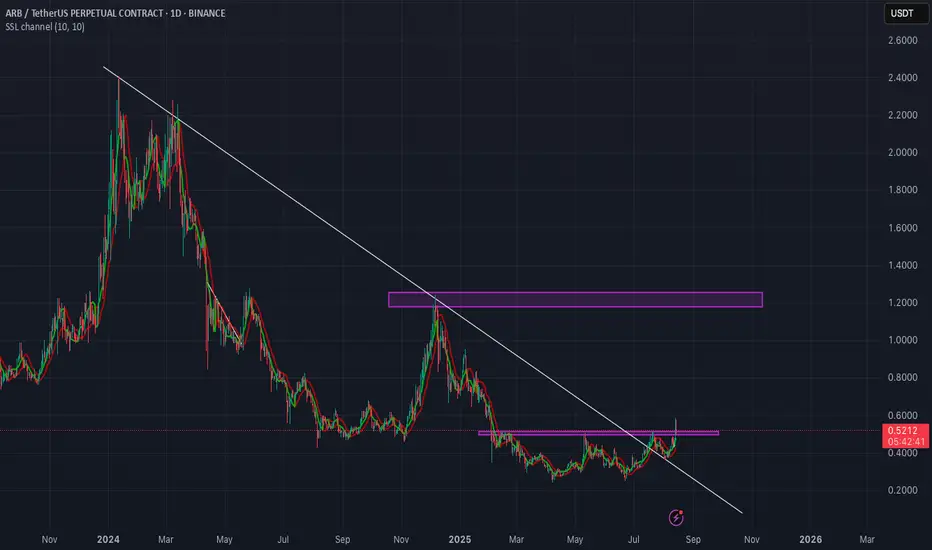
ARB/USDT Swing Trading Plan
Current price: $0.522
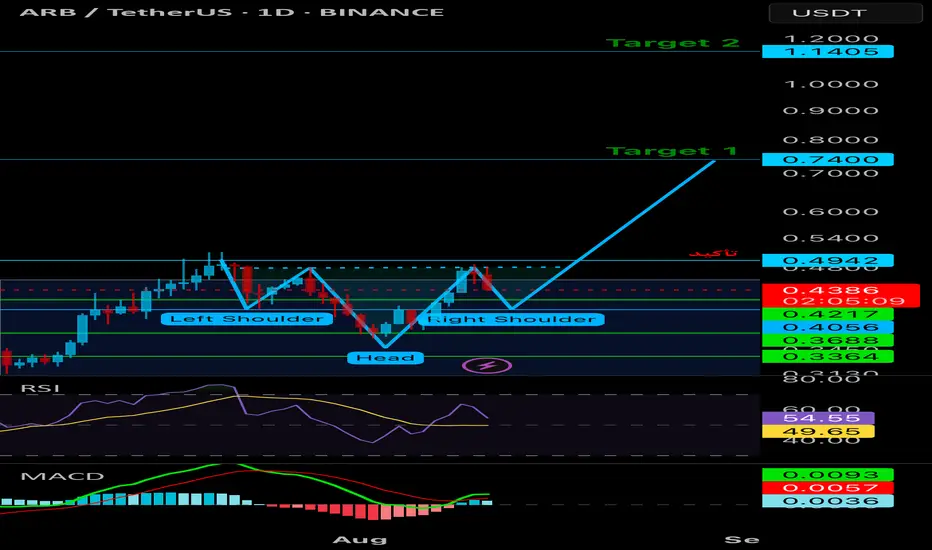
Bullish Scenario (Breakout Play)
Entry: $0.53–$0.55 (confirmation above recent horizontal resistance)
Stop-loss: $0.48 (below recent swing low & breakout level)
Take Profit Targets:
TP1: $0.68 (previous high before breakdown)
TP2: $0.88 (mid-range supply zone)
TP3: $1.20–$1.25
Related pairs
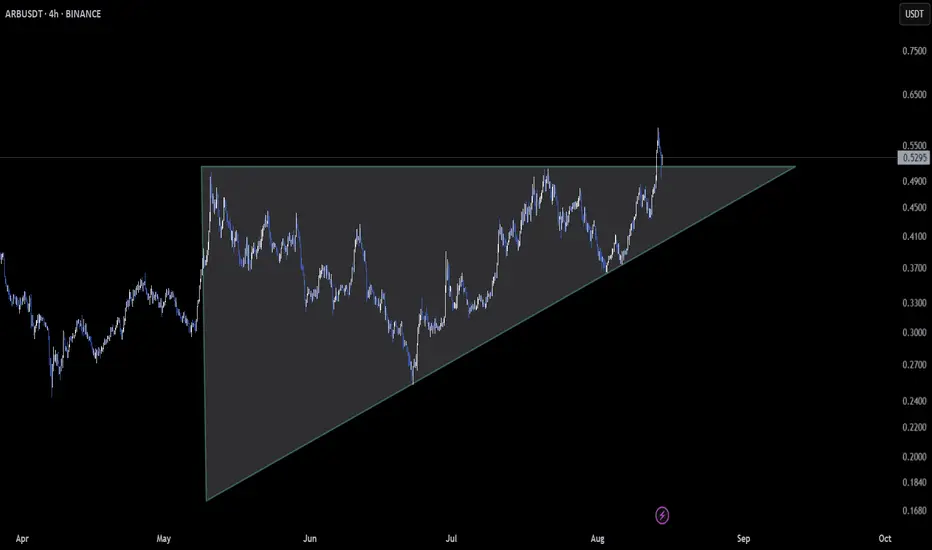
ARB – Retesting Ascending Triangle Breakout
📆 On the Daily timeframe , AMEX:ARB has broken out of an ascending triangle and is now **retesting the breakout support** 🛡️. This is a textbook scenario where market participants gauge whether the breakout has real strength.
If this level holds, it could pave the way for the next bullish leg
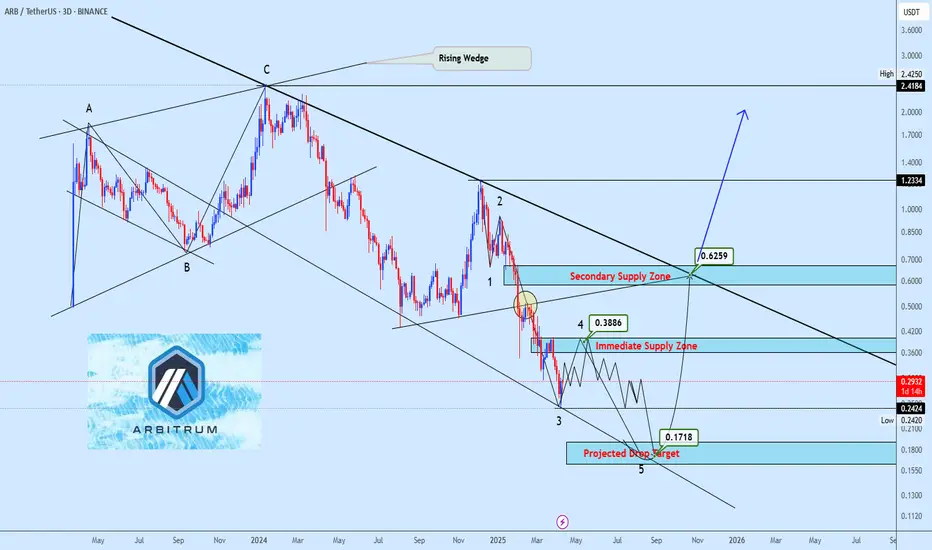
Relief Rally or Further Drop? Key Levels to Watch on ARBUSDTARBUSDT continues its descent after invalidating the macro rising wedge, with price action firmly suppressed below key supply zones. Current wave structure hints at a potential relief rally toward 0.3886 before resuming the broader bearish trajectory toward the projected drop target at 0.1718. Until
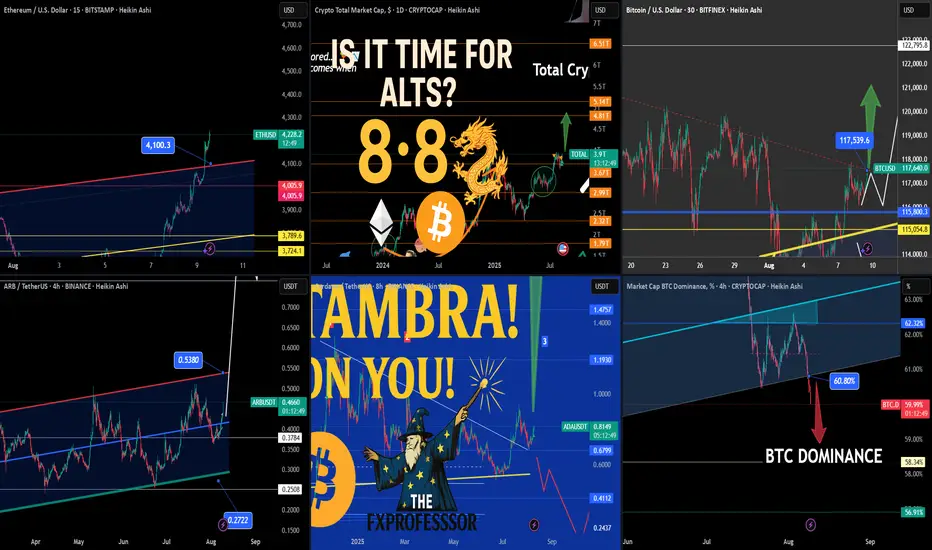
Today’s Crypto Market – From Ethereum Strength to ALTS Setup📅🔥 Today’s Crypto Market – From Ethereum Strength to ALTS Setup 🚀💡
In today’s market update video, we broke down what could be the critical handoff from Ethereum’s dominance to a broader ALT season.
The sequence is clear:
1️⃣ Bitcoin led the way.
2️⃣ Ethereum took control, smashing through $4,100.
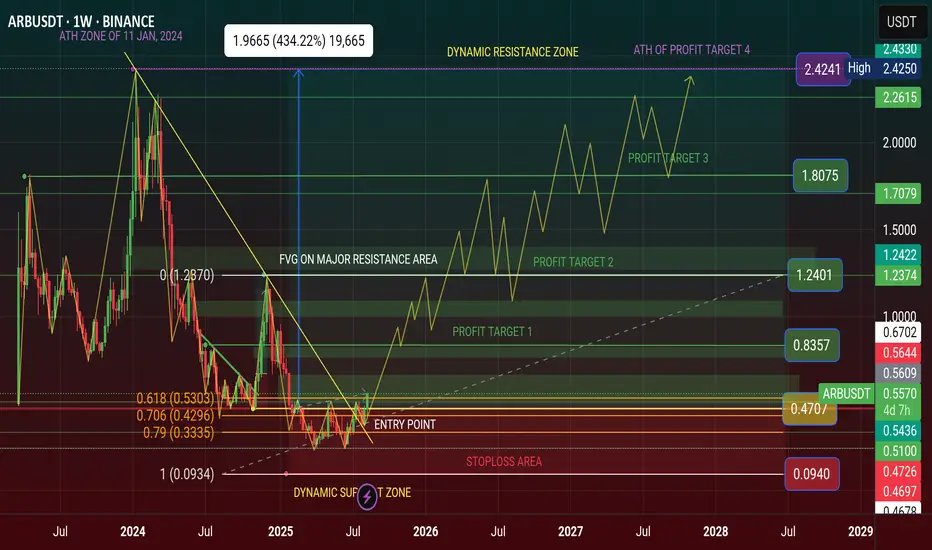
$ARB Finally Breakout $0.50 and going to +$1 This August 2025✨ AMEX:ARB Finally Breakout $0.50 and it's going to Rocket +$1 This August 2025 and +$2 in 2026
I was Share my Prediction on TradingView and Binance Square. Lastly, i was telling the ARB price is Showing a Bullish Reversal Pattern and this is Last hope in Bottom Price of Dynamic Support Level Area
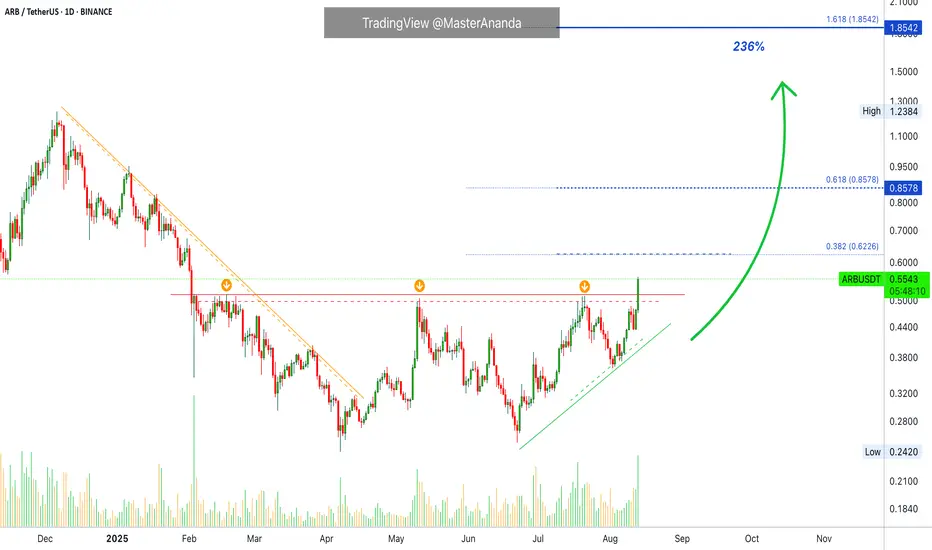
Arbitrum: How to Sell at the TopToday ARB finally broke out of a bottom pattern and trades at the highest price since February 2025, eight months ago.
Here we have a very strong chart and signals. All the signals are very advanced and fully confirmed. For example, today's candle is full green and hitting the highest price in mont
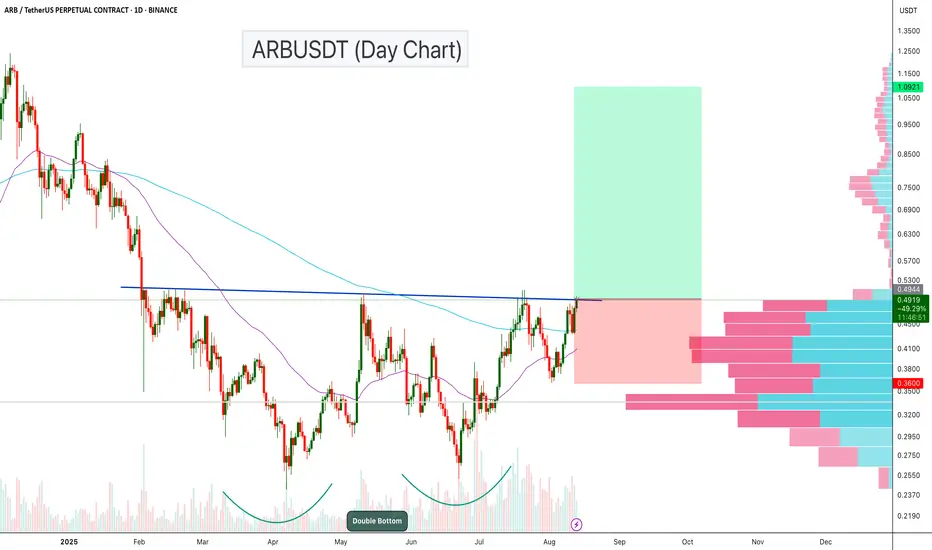
ARBUSDT – Double Bottom Breakout Loading?ARBUSDT is showing a strong bullish structure on the daily chart, with a classic Double Bottom pattern forming over the past few months. Price is now pressing against the neckline resistance, which, if broken, could trigger a powerful upside move.
Key Points:
Double Bottom Formation: The pattern
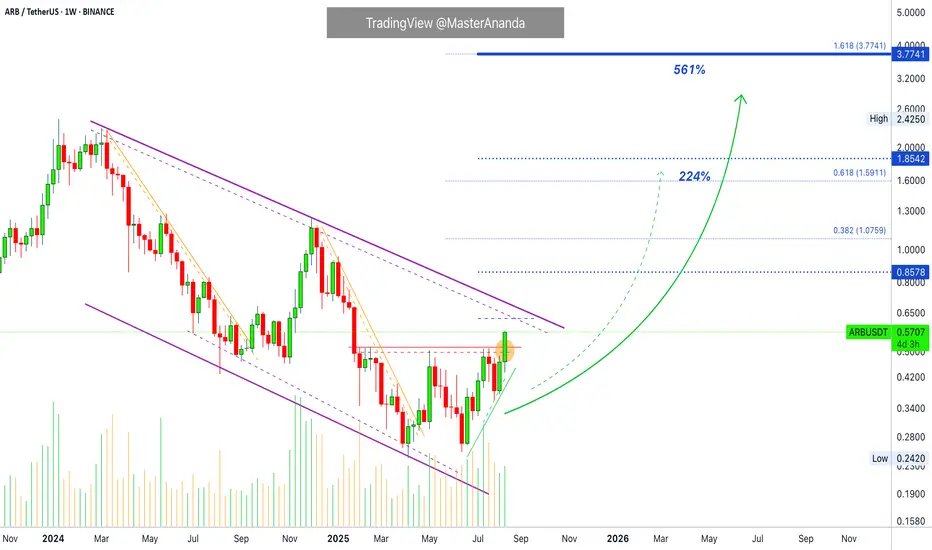
Arbitrum Long-Term vs Daily · Weekly TimeframeI Just showed you recently a chart for ARBUSDT on the daily timeframe. The main target was $1.85 mid-term. This target here shows 224% profits potential and is only a halfway through resistance, not a major point.
When we zoom out, looking here at ARBUSDT on the weekly timeframe, we can see the ma
Altseason is Loading... Which One’s Your 10x Pick – $POL or $ARB🚨 BULL MARKET ACCUMULATION ALERT 🚨
Both PSX:POL and AMEX:ARB are currently trading below $0.40, and both charts are showing strong long-term bullish structure.
PSX:POL Analysis:
• Current Price: Under $0.40
• Strong Entry Zone: $0.20 – $0.17
• Bull Run Targets: $2 – $5
• Backed by powerful fu

See all ideas
Summarizing what the indicators are suggesting.
Oscillators
Neutral
SellBuy
Strong sellStrong buy
Strong sellSellNeutralBuyStrong buy
Oscillators
Neutral
SellBuy
Strong sellStrong buy
Strong sellSellNeutralBuyStrong buy
Summary
Neutral
SellBuy
Strong sellStrong buy
Strong sellSellNeutralBuyStrong buy
Summary
Neutral
SellBuy
Strong sellStrong buy
Strong sellSellNeutralBuyStrong buy
Summary
Neutral
SellBuy
Strong sellStrong buy
Strong sellSellNeutralBuyStrong buy
Moving Averages
Neutral
SellBuy
Strong sellStrong buy
Strong sellSellNeutralBuyStrong buy
Moving Averages
Neutral
SellBuy
Strong sellStrong buy
Strong sellSellNeutralBuyStrong buy
Displays a symbol's price movements over previous years to identify recurring trends.
Frequently Asked Questions
The current price of ARBUSDT SPOT (ARB) is 0.4802 USDT — it has fallen −6.72% in the past 24 hours. Try placing this info into the context by checking out what coins are also gaining and losing at the moment and seeing ARB price chart.
ARBUSDT SPOT price has risen by 15.52% over the last week, its month performance shows a 10.33% increase, and as for the last year, ARBUSDT SPOT has decreased by −10.58%. See more dynamics on ARB price chart.
Keep track of coins' changes with our Crypto Coins Heatmap.
Keep track of coins' changes with our Crypto Coins Heatmap.
ARBUSDT SPOT (ARB) reached its highest price on Jan 12, 2024 — it amounted to 2.4046 USDT. Find more insights on the ARB price chart.
See the list of crypto gainers and choose what best fits your strategy.
See the list of crypto gainers and choose what best fits your strategy.
ARBUSDT SPOT (ARB) reached the lowest price of 0.2420 USDT on Apr 7, 2025. View more ARBUSDT SPOT dynamics on the price chart.
See the list of crypto losers to find unexpected opportunities.
See the list of crypto losers to find unexpected opportunities.
The safest choice when buying ARB is to go to a well-known crypto exchange. Some of the popular names are Binance, Coinbase, Kraken. But you'll have to find a reliable broker and create an account first. You can trade ARB right from TradingView charts — just choose a broker and connect to your account.
Crypto markets are famous for their volatility, so one should study all the available stats before adding crypto assets to their portfolio. Very often it's technical analysis that comes in handy. We prepared technical ratings for ARBUSDT SPOT (ARB): today its technical analysis shows the buy signal, and according to the 1 week rating ARB shows the buy signal. And you'd better dig deeper and study 1 month rating too — it's sell. Find inspiration in ARBUSDT SPOT trading ideas and keep track of what's moving crypto markets with our crypto news feed.
ARBUSDT SPOT (ARB) is just as reliable as any other crypto asset — this corner of the world market is highly volatile. Today, for instance, ARBUSDT SPOT is estimated as 1.90% volatile. The only thing it means is that you must prepare and examine all available information before making a decision. And if you're not sure about ARBUSDT SPOT, you can find more inspiration in our curated watchlists.
You can discuss ARBUSDT SPOT (ARB) with other users in our public chats, Minds or in the comments to Ideas.