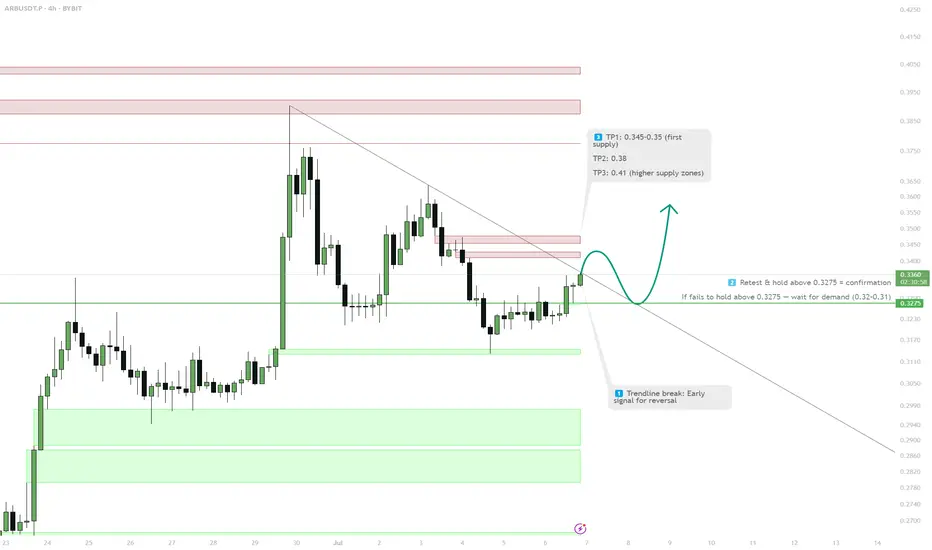
ARB — 4H Supply Break & Trend Reversal1. Watch for confirmed trendline break
2. Retest & hold above 0.3275 for entry
3. TP1: 0.345–0.35 / TP2: 0.38 / TP3: 0.41
4. If fails, watch demand zones below
ARBUSDT trade ideas
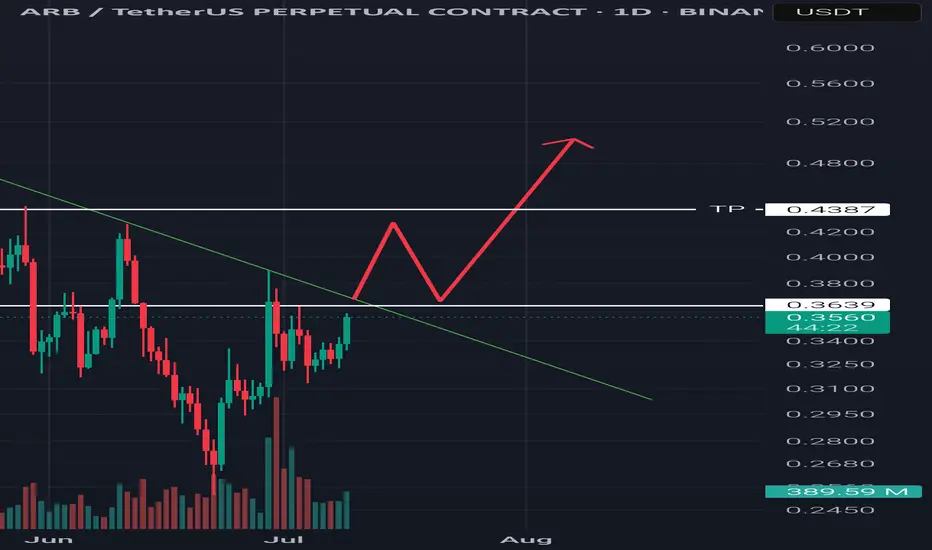
ARB/USDT Analysis – Potential Breakout Ahead?📅 Timeframe: 1D
💰 Current Price: $0.3559 (+5.33%)
📊 Volume Spike: 389.18M
ARB is currently testing a descending trendline resistance that's been respected since mid-May. Price action has formed a base around the $0.35 level and is now showing signs of strength with a recent bullish candle.
📈 Key Levels:
Resistance to Watch: $0.37 - $0.38 (trendline + horizontal level)
Breakout Target: $0.45 - $0.55 zone if the breakout is confirmed
Support: $0.33 - $0.34 range
🧠 Bullish Scenario:
If ARB can break and close above the trendline with volume, a potential retest and continuation move could take price towards the $0.45-$0.55 area.
🛑 Invalidation:
A daily close below $0.33 may signal weakness and delay the bullish breakout.
📌 Watch for:
Break and retest confirmation
Volume confirmation on breakout
RSI and momentum support
📉 Not financial advice. Always do your own research. #ARB #Crypto #Breakout #TechnicalAnalysis #Altcoins #TradingView
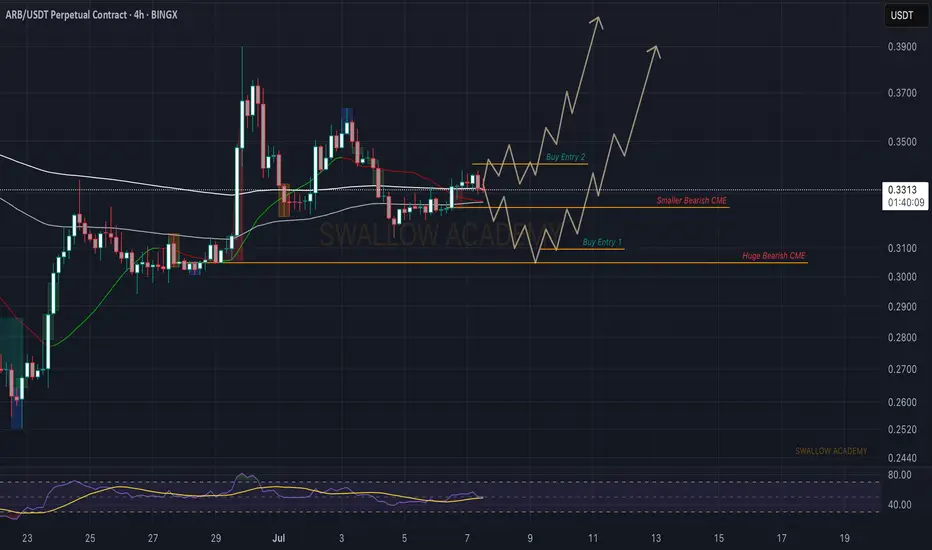
Arbitrum (ARB): Looking For Buy Entry | 2 Zones To Keep an EyeArbitrum caught our attention with potential buy zones that we might be seeing pretty soon. We are looking for slight downward movement from here toward the major CME gap, which would be an ideal area for a buy entry, once we form the proper MSB there, so that's what we are looking for.
Swallow Academy
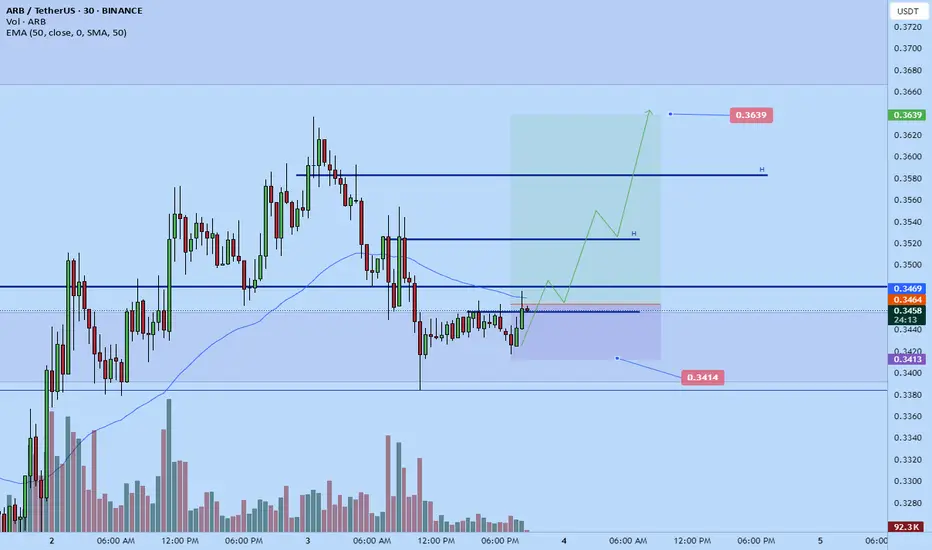
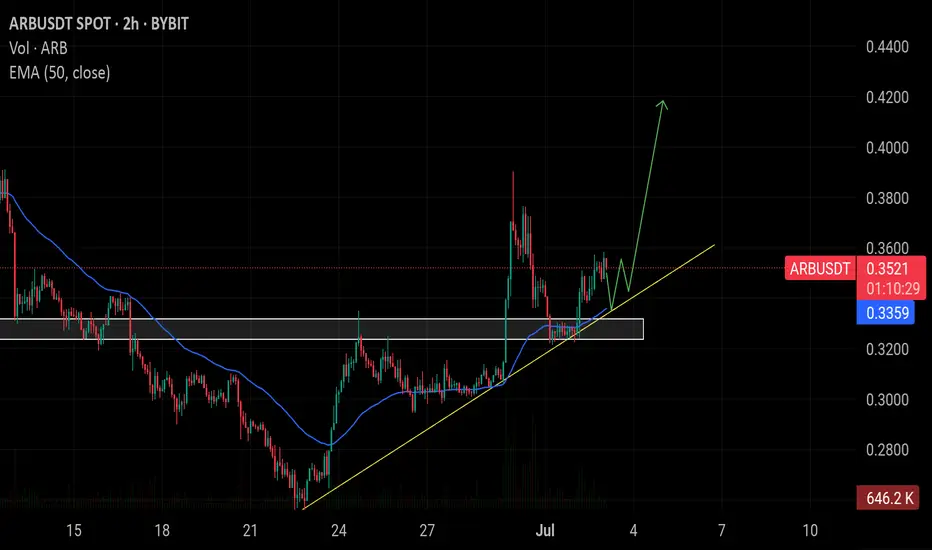
Arbusdt long to $0.3639Based on my analysis arb is likely to push back up before the weekend . I think its at a good level right now and likely to t break to the upside soon. Its not the cleanest of setup, its more of a anticipation of bullish trend shift setup. Structurally price is in a down trend on the 1h tf but its at lower low point and at daily key level and showing signs of bulls taking back control so expecting a bullish flip.
Need some strong demand to break, I'll be monitoring it though incase it attempts to push and fail to break to potentially exit earlier..
#ARB/USDT Arbitrum scalp long to $ 0.4451#ARB
The price is moving within a descending channel on the 15-minute frame and is expected to break and continue upward.
We have a trend to stabilize above the 100 Moving Average once again.
We have a bearish trend on the RSI indicator, supporting the upward break.
We have a support area at the lower boundary of the channel at 0.4070, acting as strong support from which the price can rebound.
We have a major support area in green that pushed the price upward at 0.3970.
Entry price: 0.4160.
First target: 0.4300.
Second target: 0.4407.
Third target: 0.4451.
To manage risk, don't forget stop loss and capital management.
When you reach the first target, save some profits and then change the stop order to an entry order.
For inquiries, please comment.
Thank you.

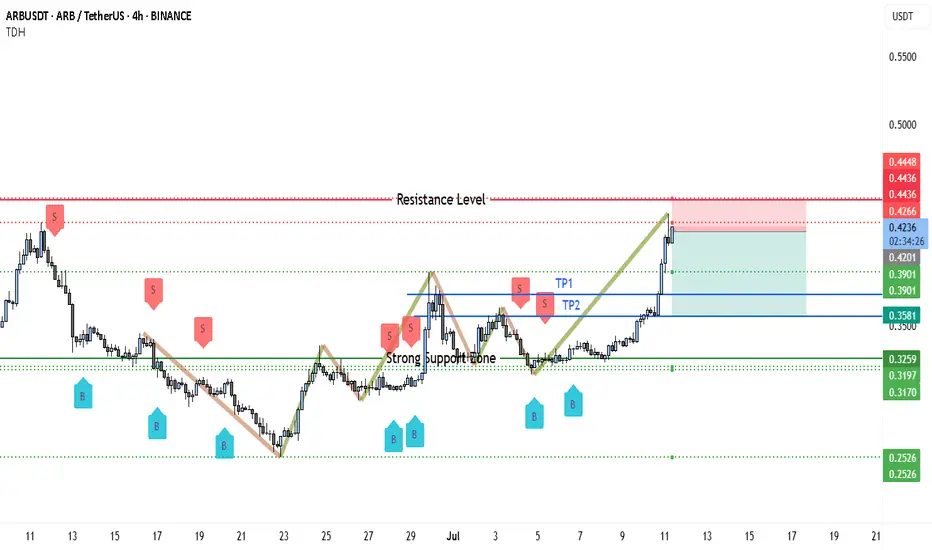
Perfect Short Setup? ARB Enters Bear TerritoryARB/USDT on the 4-hour chart is trading right into a proven resistance zone between 0.4266 and 0.4448 USDT, where the price has reversed multiple times before, as shown by the red “S” markers. This level acted as a ceiling during prior rallies, triggering sharp declines each time it was tested.
The current move up is steep and impulsive, climbing almost vertically from the strong support around 0.3581 without meaningful consolidation. Such rallies often attract profit-taking as traders who bought lower look to exit into overhead supply. The fact that price is already stalling just below resistance suggests momentum is weakening and sellers may soon step back in.
Another reason for a bearish bias is the absence of any strong base or sideways build-up under this resistance area. Typically, a sustained breakout requires accumulation or compression just below resistance; here, price simply surged straight up into it. If this zone holds again, it will likely trigger a pullback back toward the last breakout levels.
A short scenario is attractive because the trade offers a clear invalidation level and clean downside targets. Entering near 0.4266–0.4448 with a stop above 0.4450 protects against a breakout trap while aiming for a retracement first to the 0.3901 zone, which acted as former resistance-turned-support, and potentially deeper to the strong support around 0.3581.
In summary, the chart structure favors a short-term bearish reversal at this resistance. The combination of historical rejection, overextension without consolidation, and evident prior sell reactions makes this level a high-probability area to look for shorts, unless price convincingly breaks and closes above 0.4450 with strong bullish candles.
#ARB Can Long Soon#ARB
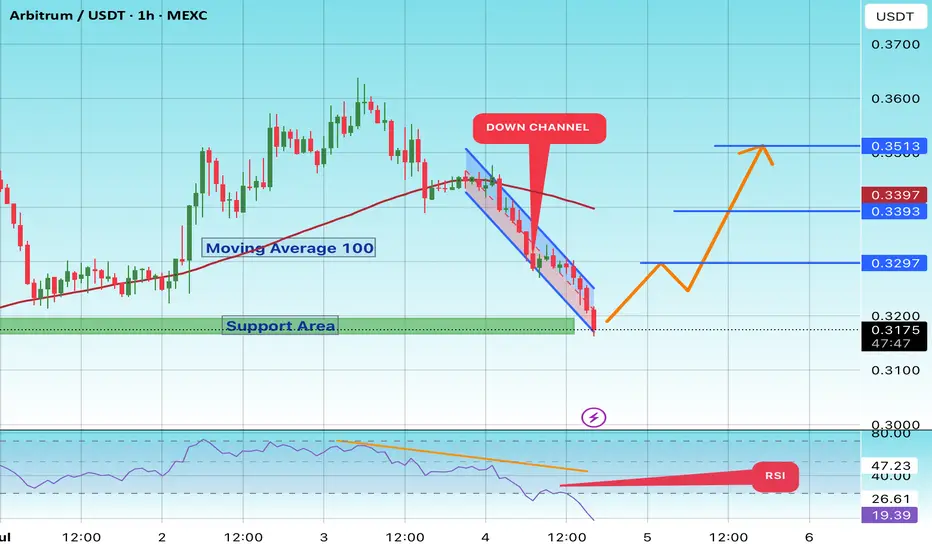
The price is moving within a descending channel on the 1-hour frame and is expected to break and continue upward.
We have a trend to stabilize above the 100 moving average once again.
We have a downtrend on the RSI indicator that supports the upward move with a breakout.
We have a support area at the lower boundary of the channel at 0.3190, acting as strong support from which the price can rebound.
We have a major support area in green that pushed the price upward at 0.3180.
Entry price: 0.3200
First target: 0.3297
Second target: 0.3393
Third target: 0.3513
To manage risk, don't forget stop loss and capital management.
When you reach the first target, save some profits and then change your stop order to an entry order.
For inquiries, please comment.
Thank you.
Altcoin Season loading?Arbitrum has broken out of the descending wedge, reclaimed the POC and is headed to higher levels. We went long at the breakout and stop loss has been placed at break even.
Not financial advice, do what’s best for you
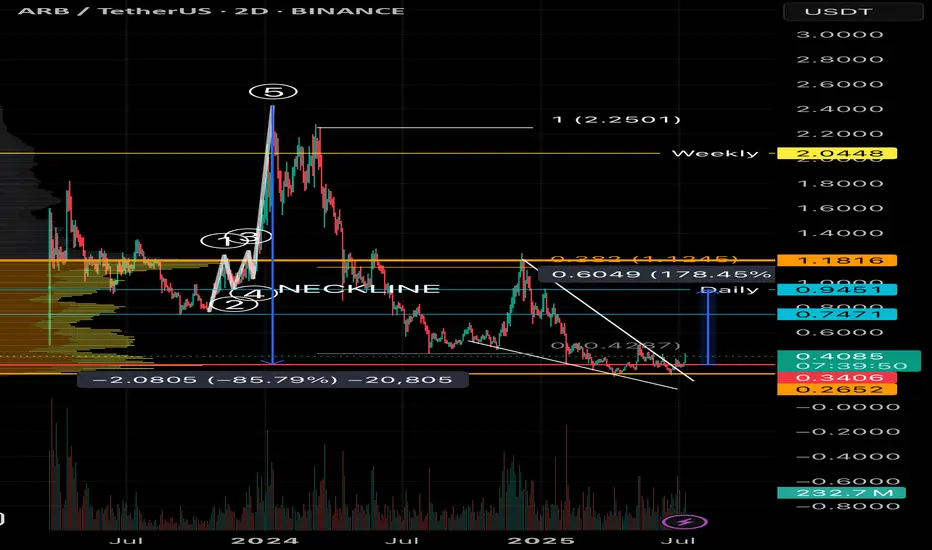
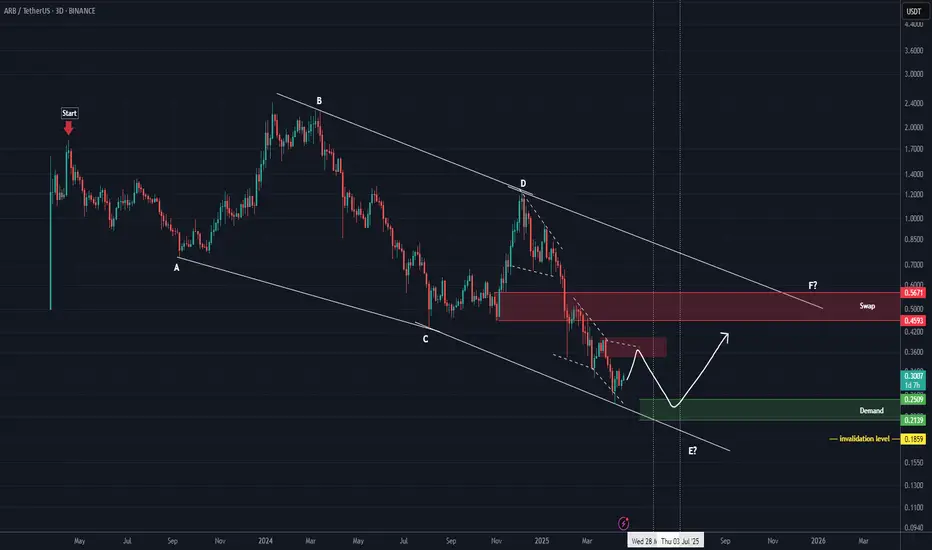
ARB New Analysis (3D)Before anything else, pay attention to the timeframe | it's a higher timeframe and will take time.
The higher timeframe structure of ARB is honestly not that bullish. In this scenario, we’ve considered the entire correction | starting from where the red arrow is placed on the chart | as a diametric/symmetrical pattern.
From a time perspective, wave E has not yet completed, and it is expected to finish somewhere between the two vertical lines. Wave E here is a bearish wave.
If the price pulls back and reaches the green box, we can look for a buy setup in that area.
A 3-day candle closing below the invalidation level will invalidate this analysis.
For risk management, please don't forget stop loss and capital management
When we reach the first target, save some profit and then change the stop to entry
Comment if you have any questions
Thank You
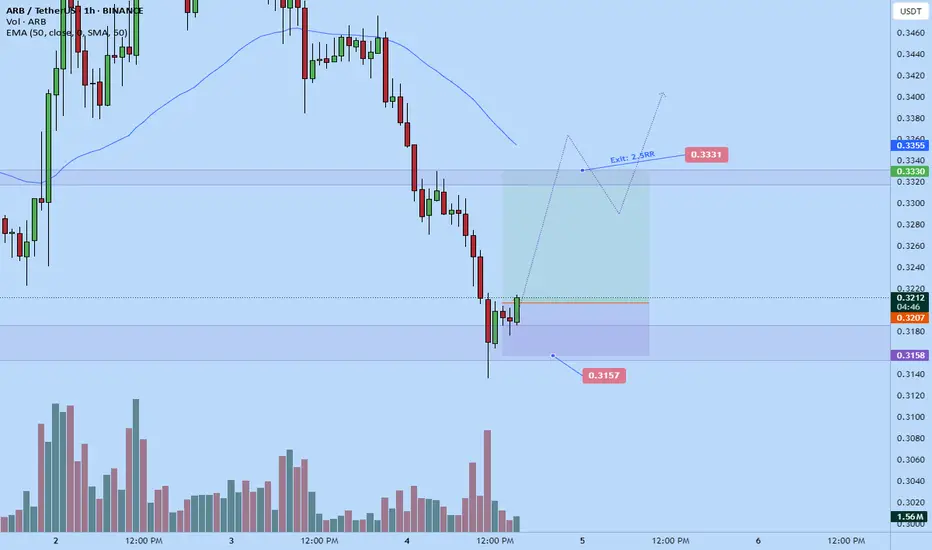
Arbitrum scalp long to $0.3331Just now opened up a scalp long on arb.
2.5RR
Aiming for $0.3331 . The market have fallen relatively low and is a daily demand / support. I think there's a good probability we'll correct back up a bit before end of day.
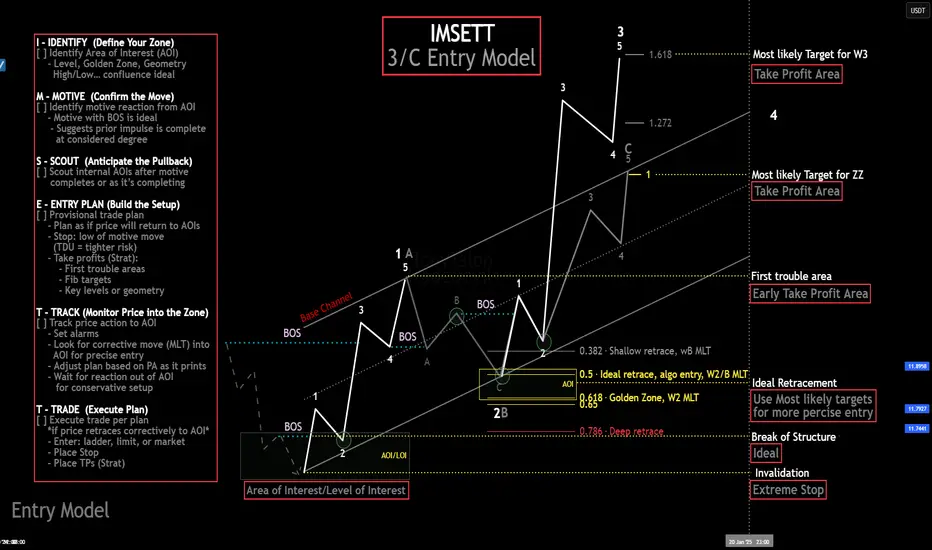
My Ideal Elliott Wave Entry ModelThe IMSETT 3/C Entry Model.
Every trader wants to catch the big moves the ones that pay quickly and decisively. In Elliott Wave, those moves often come during Wave 3. It's the strongest part of the trend, and when you're positioned early, the risk-to-reward is unmatched.
But not every opportunity hands you a clean Wave 3 on a silver platter. Sometimes you’re looking at a Wave C instead. That’s where the 3/C Entry Model comes in. It’s designed to get you aligned with high-conviction moves—whether the market is in a trend or a zig zag.
Here’s the edge: both Wave 3 and Wave C often start the same way—a strong, motive push off an AOI (area of interest), followed by a retracement. That shared structure gives us an anchor. Whether we’re labeling it a 3 or a C doesn’t change the fact that the initial impulse gives us clarity, direction, and a place to manage risk.
That’s what the IMSETT Model is built around:
Identify
Motive
Scout
Entry Plan
Track
Trade
Each step is focused, actionable, and repeatable. You're not trying to outguess the market—you’re reacting to structure, preparing for common behavior, and executing with intent.
I do have a video with a walk through.
This just the way I look for clarity in setups. As with everything in trading, nothing will work every time so do your own research this is not financial advice.
Cheers!
Trade Safe, Trade Clarity.
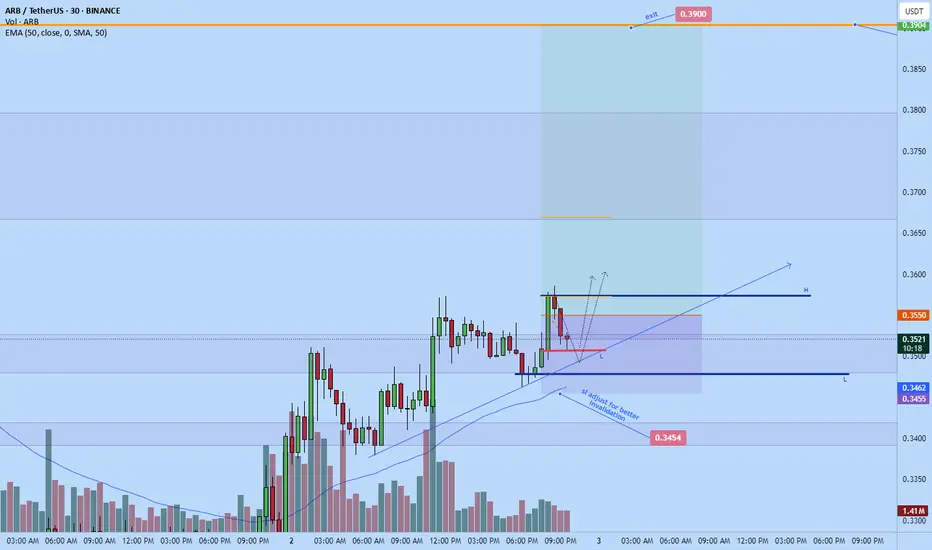
Arbitrum long to $0.3904I recently opened a long position on Arbitrum
SL: $0.3454
Tp $0.39
Currently in draw down, anticipating a push back up soon. So anyone seeing this now can get a better entry than me and can even move stop a bit lower to like $0.3445 for a comfortable stop placement as mine is still a little tight but based on my calculation should be aite.
$ARB showing strength above the trendline support and 50 EMA. AsAMEX:ARB showing strength above the trendline support and 50 EMA. As long as it holds above the $0.33–$0.34 zone, a continuation towards $0.40+ looks likely. Watch for retest and bounce for possible long entry.
$ARB Analysis📊 LSE:ARB Analysis 📊
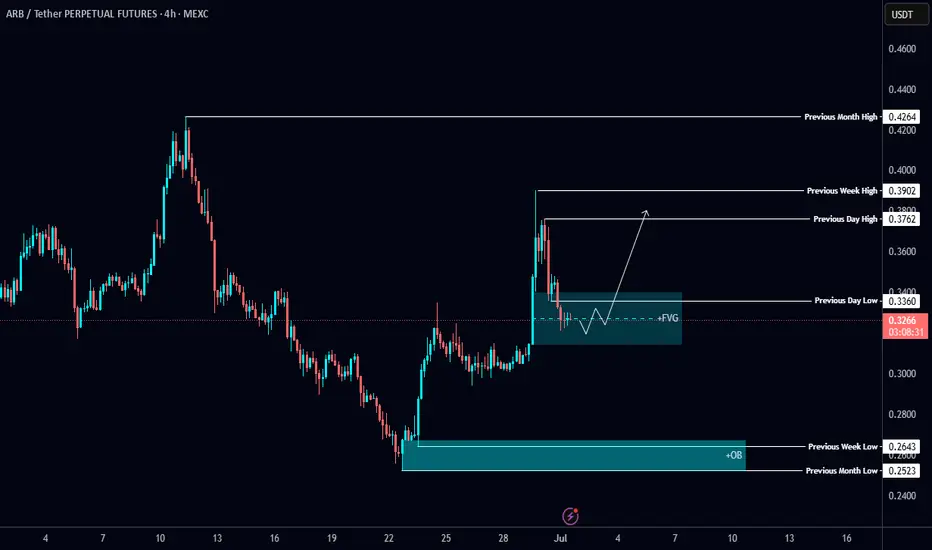
#ARB testing the 4H FVG zone 👀
Watching closely for confirmation like MSS, CISD, or a clean IFVG to go long 🎯
Let price speak — sniper entries only 🧠
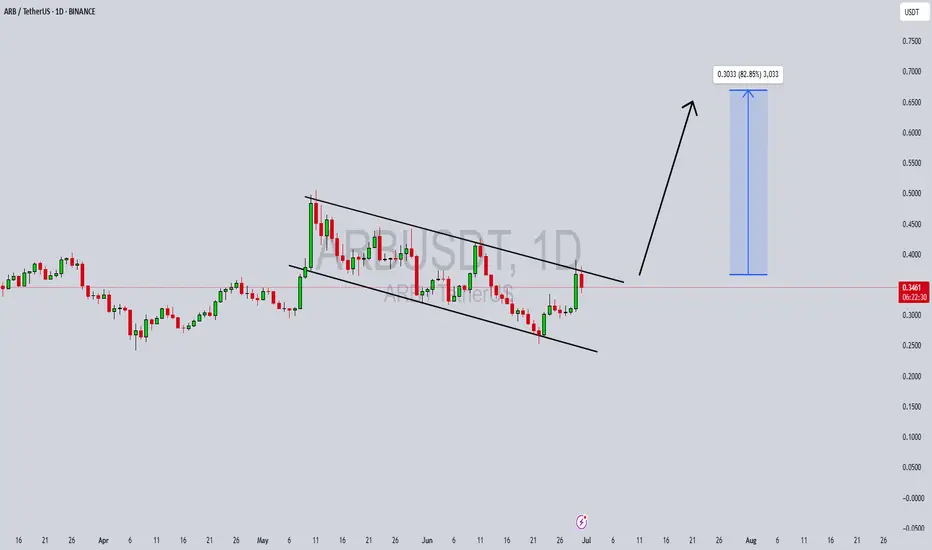
ARBUSDT Forming Descending ChannelARBUSDT is showing an interesting setup with its clear descending channel pattern on the daily chart, signaling a potential reversal is on the horizon. This technical formation suggests that the bearish momentum may be exhausting and that a breakout could pave the way for a strong bullish wave. Traders and investors alike are closely watching this pattern for a decisive move above the channel resistance, which would confirm the trend change and could set off a powerful rally.
One of the key aspects supporting this outlook is the good volume that’s been building up around current levels. Healthy volume during consolidation phases often indicates accumulation by smart money, hinting that larger players are positioning themselves for a breakout. This adds a layer of confidence to the trade idea, especially for those targeting swing trades in the crypto market. With the broader market sentiment becoming more risk-on, ARBUSDT stands out as a coin with significant upside potential.
The expected gain for ARBUSDT sits at an attractive 70% to 80%+, aligning with previous price action levels where the market found support and resistance. If the pair can maintain momentum after the breakout, there’s room for it to reclaim lost ground quickly, providing traders with multiple profit-taking zones along the way. Keeping an eye on daily closes and volume spikes will be crucial to catching this move early.
Investors are showing renewed interest in ARBUSDT, adding to its bullish case as sentiment shifts. This combination of technical pattern, volume strength, and investor confidence makes ARBUSDT a crypto pair to watch closely in the coming days and weeks. Patience and solid risk management will be key for anyone looking to capitalize on this setup.
✅ Show your support by hitting the like button and
✅ Leaving a comment below! (What is You opinion about this Coin)
Your feedback and engagement keep me inspired to share more insightful market analysis with you!
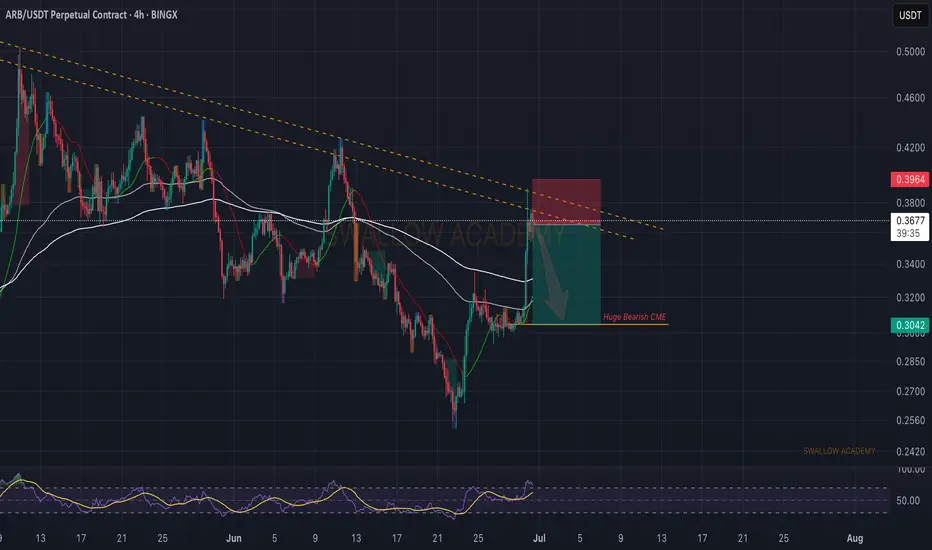
Arbitrum (ARB): Huge CME, Looking For Fill of ThatARB has a huge potential for downward movement from here, after we reached the local resistance area where we are seeing some kind of rejection.
On top of that, we are seeing the huge CME gap, which we intend to fill in upcoming days
Swallow Academy
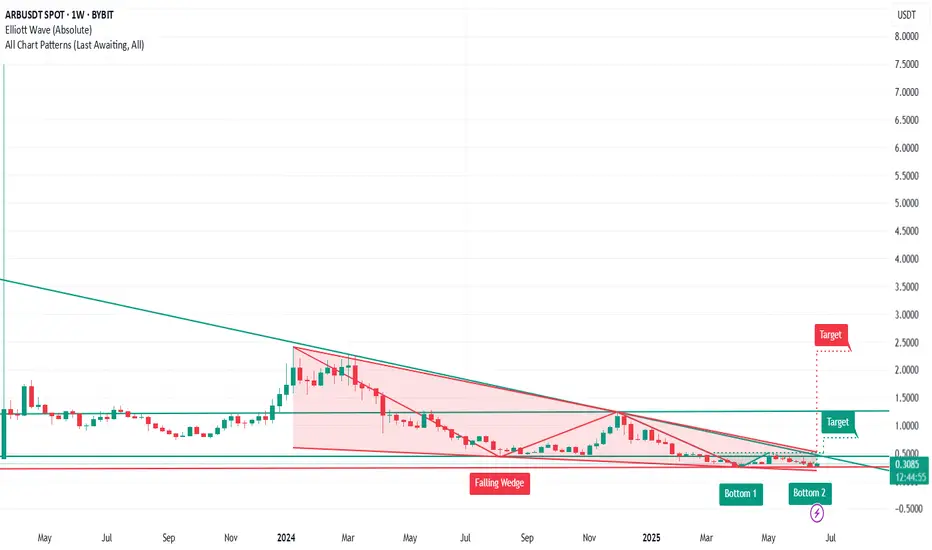
ARBUSDT – Three Possible Scenarios in the Future:ARBUSDT – Three Possible Scenarios in the Future:
🔹 Longterm: Growth up to $2.2 - $2.3
🔹 Midterms: Growth up to $0.70 - $0.75
🔹 Shorterm: Growth to $0.40 – $0.45
🚨 Key Levels to Watch:
▪️ $0.295 — falling to this level may indicate further downside to $0.25 - $0.24
▪️ $0.385 — a breakout above this level could open the path to $0.40
▪️ $0.40 — a breakout above this level could open the path to $0.50
▪️ $0.50 — a breakout above this level could open the path to $0.70 - $0.75
▪️ $0.75 — a breakout above this level could open the path to $1.20
▪️ $1.20 — a breakout above this level could open the path to $2.2 - $2.3
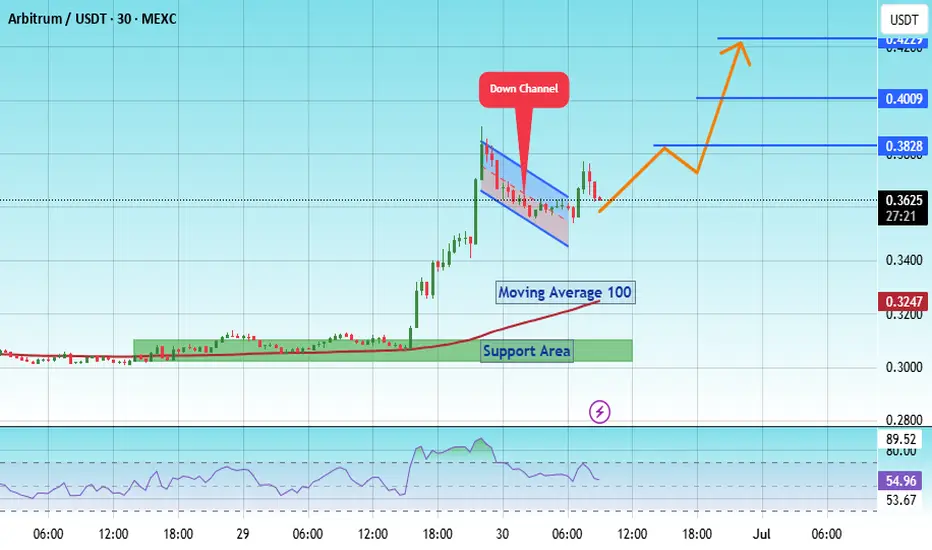
#ARB/USDT Ready for a Major Breakout!#ARB
The price is moving within a descending channel on the 1-hour frame, adhering well to it, and is heading for a strong breakout and retest.
We are seeing a bounce from the lower boundary of the descending channel. This support is at 0.3500.
We have a downtrend on the RSI indicator that is about to be broken and retested, supporting the upside.
There is a major support area in green at 0.3050, which represents a strong basis for the upside.
Don't forget a simple thing: ease and capital.
When you reach the first target, save some money and then change your stop-loss order to an entry order.
For inquiries, please leave a comment.
We are looking to hold above the 100 Moving Average.
Entry price: 0.3640
First target: 0.3828
Second target: 0.4009
Third target: 0.4229
Don't forget a simple thing: ease and capital.
When you reach your first target, save some money and then change your stop-loss order to an entry order.
For inquiries, please leave a comment.
Thank you.
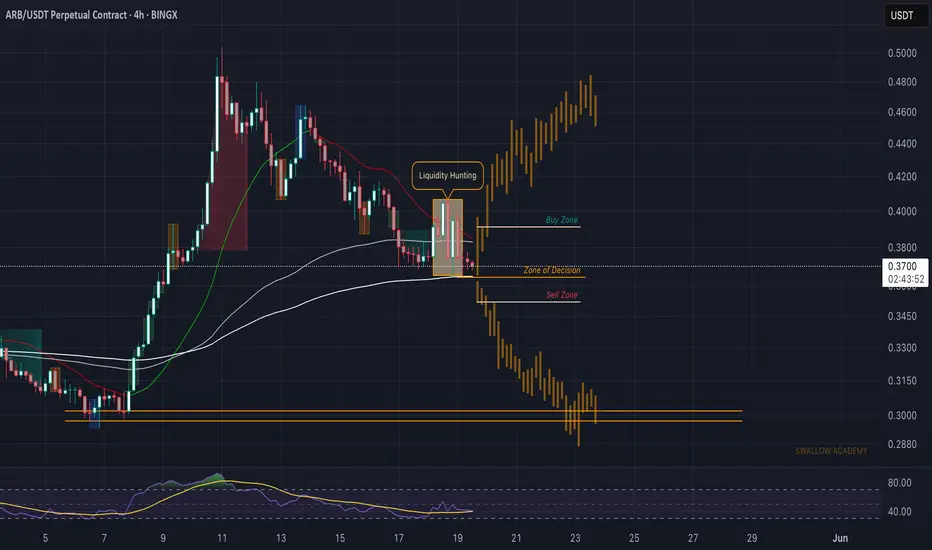
Arbitrum (ARB): Reached Important Zone 200EMA | Liquidity HuntArbitrum has reached a major area at 200EMA, where after a decent roller coaster ride we had. Now that we are approaching, we are waiting for either a proper breakout or a bounce from this area, which would give us the next direction of the ARB.
So for now we wait, wait for a breakout or bounce (MSB or BOS).
Swallow Academy
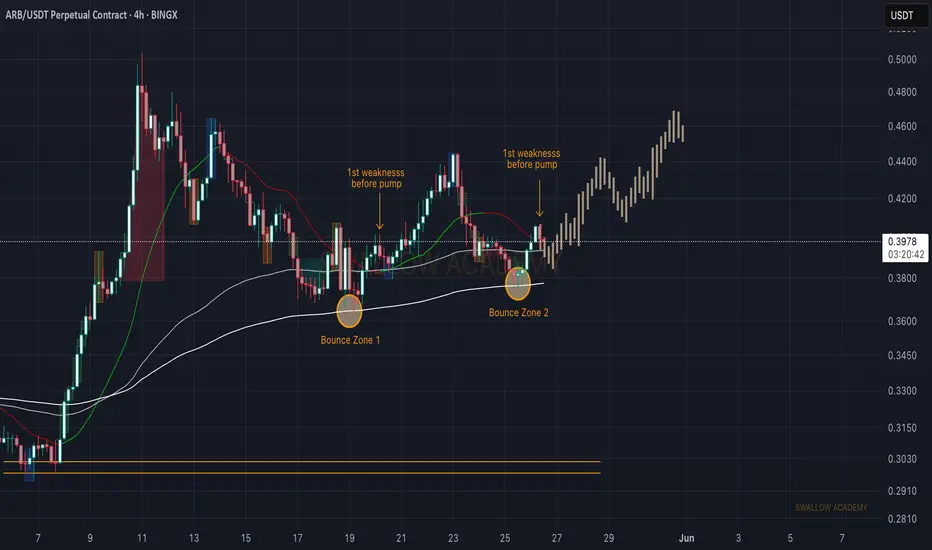
Arbitrum (ARB): Seeing Similar Pattern | Possible Buying ZoneArbitrum coin has formed a strong foundation near the 200EMA, where we are looking for further upward movement from this area.
As we have recently had another upward movement, we are at the first wave of weakness after what we last time had a strong upward movement, and that's what we are going to look for as well, which would give us a good 1:4 or even 1:5 RR trade opportunity.
Swallow Academy
Arbitrum (ARB): Waiting For 200EMA | Rejection + Volatility ZoneARB coin has done well since last time, where the price is now approaching the 200EMA line, where last time we had a big volatility movement and liquidity hunting before a proper market structure break and movement to lower zones, so that's what we are looking for here again.
Swallow Academy

Arbitrum (ARB): Multiple Good Risk:Reward Ratio Trades | SidewayArbitrum caught our attention with a possible BOS forming on smaller timeframes and a good sideways channel forming, which eventually we are looking to be broken, where we might be taking a sweet long position with some good R:R.
More in-depth info is in the video—enjoy!
Swallow Academy

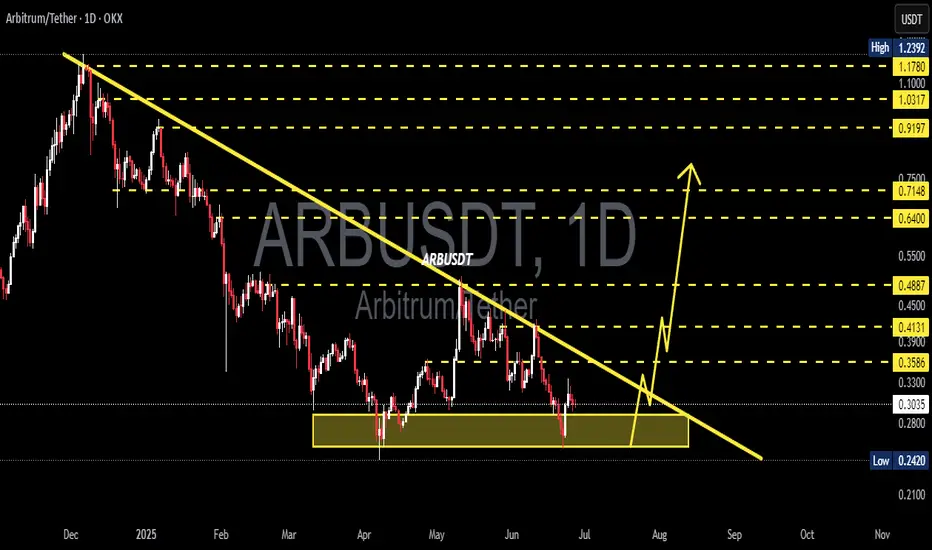
ARB/USDT Ready for a Major Breakout! Accumulation1. Downtrend Line:
ARB has been in a sustained downtrend since late 2024, marked by a descending trendline from previous highs. The current price is testing this resistance line, hinting at a possible breakout.
2. Strong Support Zone (Demand Area):
A clear accumulation zone is observed between $0.28–$0.30, where the price has consistently bounced back. This indicates solid buying pressure and strong investor interest at this level.
3. Potential Breakout Signal:
The price is now compressing near the end of the descending triangle and is forming higher lows, suggesting a breakout setup is forming.
4. Projected Price Targets (If Breakout Confirmed):
Upon successful breakout and retest confirmation, ARB may rally toward the following resistance levels:
$0.3586
$0.3930
$0.4131
$0.4887
$0.6400
Ultimate targets could reach as high as $0.7148–$0.9197, depending on market momentum.
5. Risk & Invalidations:
A failure to hold the $0.28–$0.30 support zone and a breakdown below may invalidate the bullish structure, potentially retesting the low near $0.2420.
Conclusion:
This chart presents a high-potential breakout opportunity for ARB/USDT. Strong accumulation at key support, along with building pressure against the descending trendline, suggests a significant reversal could be underway. A great setup for swing traders and medium-term investors to monitor closely.