ARB/USDT Swing Trading Plan
Current price: $0.522
Bullish Scenario (Breakout Play)
Entry: $0.53–$0.55 (confirmation above recent horizontal resistance)
Stop-loss: $0.48 (below recent swing low & breakout level)
Take Profit Targets:
TP1: $0.68 (previous high before breakdown)
TP2: $0.88 (mid-range supply zone)
TP3: $1.20–$1.25 (major supply zone marked on your chart)
Pullback Buy Plan
Entry: $0.50–$0.51 (retest of broken trendline & resistance-turned-support)
Stop-loss: $0.46
Take Profit Targets: same as above
Risk Management
Risk max 1–2% of account per trade.
Consider taking partial profits at TP1 and moving stop to breakeven.
Avoid chasing if price pumps too far above entry zone without retest.
ARBUSDT trade ideas
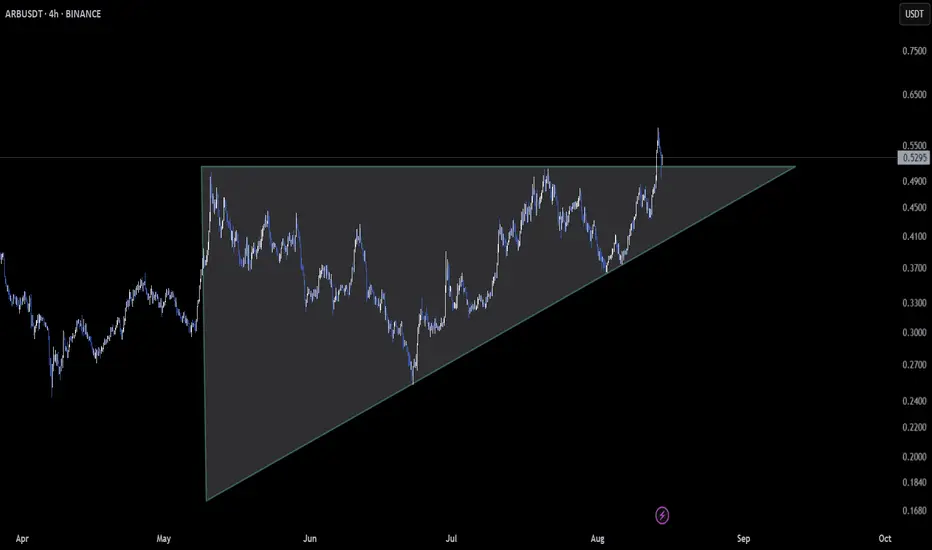
ARB – Retesting Ascending Triangle Breakout
📆 On the Daily timeframe , AMEX:ARB has broken out of an ascending triangle and is now **retesting the breakout support** 🛡️. This is a textbook scenario where market participants gauge whether the breakout has real strength.
If this level holds, it could pave the way for the next bullish leg. A clean breakdown, however, would invalidate the structure and signal caution.
👀 *Seasoned traders watch these retests closely — they often dictate the next trend direction.*
*Not financial advice.*
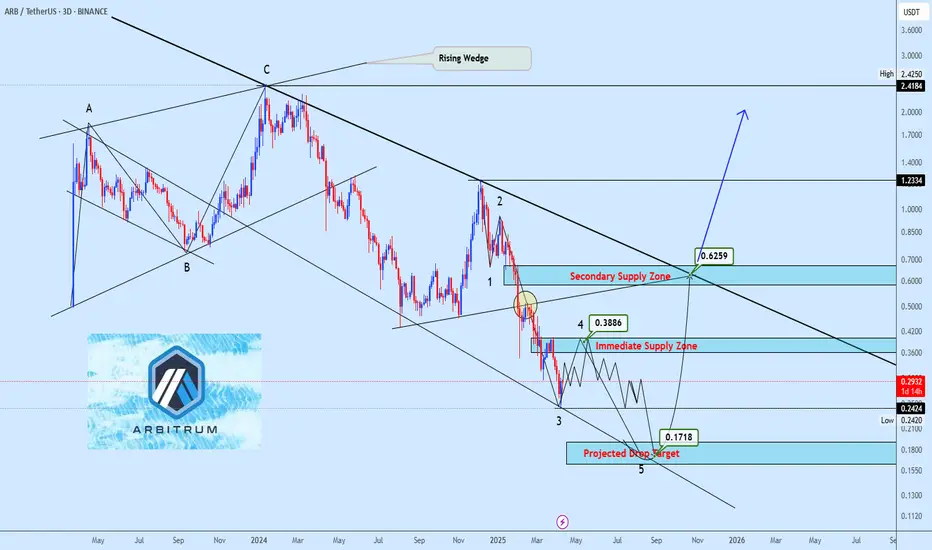
Relief Rally or Further Drop? Key Levels to Watch on ARBUSDTARBUSDT continues its descent after invalidating the macro rising wedge, with price action firmly suppressed below key supply zones. Current wave structure hints at a potential relief rally toward 0.3886 before resuming the broader bearish trajectory toward the projected drop target at 0.1718. Until the macro descending trendline at 0.6259 is decisively broken, bearish sentiment remains dominant.
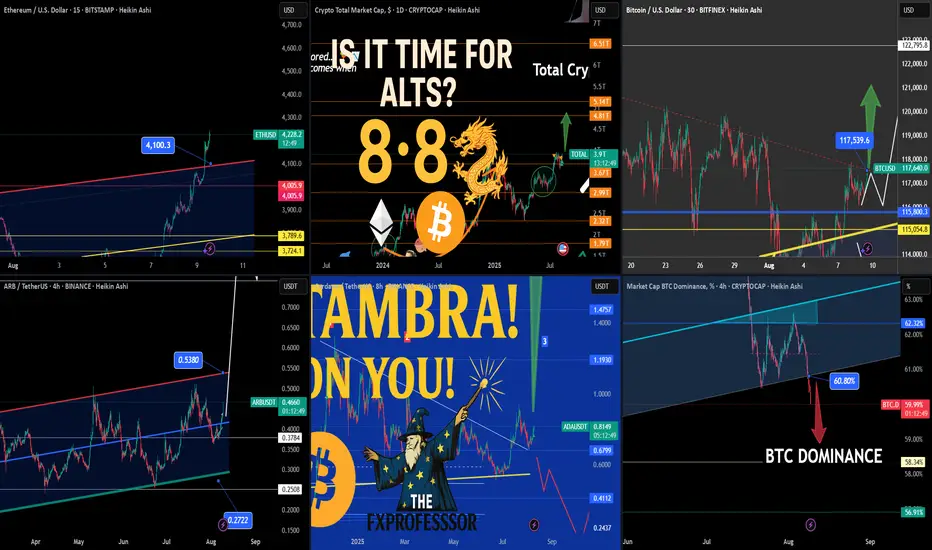
Today’s Crypto Market – From Ethereum Strength to ALTS Setup📅🔥 Today’s Crypto Market – From Ethereum Strength to ALTS Setup 🚀💡
In today’s market update video, we broke down what could be the critical handoff from Ethereum’s dominance to a broader ALT season.
The sequence is clear:
1️⃣ Bitcoin led the way.
2️⃣ Ethereum took control, smashing through $4,100.
3️⃣ Altcoins now have the setup to run, with BTC dominance breaking lower.
🎯 Key Levels from Today’s Charts:
Ethereum (ETH/USD) – $4,222 with breakout above $4,100.3; upside targets $4,420 – $4,800; supports at $4,005.9 and $3,789.6.
Bitcoin (BTC/USD) – Breaking out from wedge at $117,500; supports $115,803 & $115,054; upside potential to $120K+ and $122,795.8.
ARB/USDT – Rebound from $0.3784 aiming for $0.5380; key support $0.3500 and $0.2722.
Cardano (ADA/USDT) – At $0.8131; resistance $1.1930, then $1.4757; support $0.6799, $0.4112.
BTC Dominance – Breakdown under 60.80%, supports 58.34% & 56.91% — historically a strong trigger for ALT rallies.
📽️ Full breakdown and reasoning are in today’s video — we looked at why BTC dominance losing support is the green light for possible sector rotation, and which alts are primed.
One Love,
The FXPROFESSOR 💙
$ARB Finally Breakout $0.50 and going to +$1 This August 2025✨ AMEX:ARB Finally Breakout $0.50 and it's going to Rocket +$1 This August 2025 and +$2 in 2026
I was Share my Prediction on TradingView and Binance Square. Lastly, i was telling the ARB price is Showing a Bullish Reversal Pattern and this is Last hope in Bottom Price of Dynamic Support Level Area.
Now Price is showing Bullish Reversal of Double Bottom Pattern in Weekly Chart. Price Breakout The Neckline. My Premium Followers was Entered Long Trade or Buy Spot Trade of ARB Coin. They are now profitable in their ARB Coin investment.
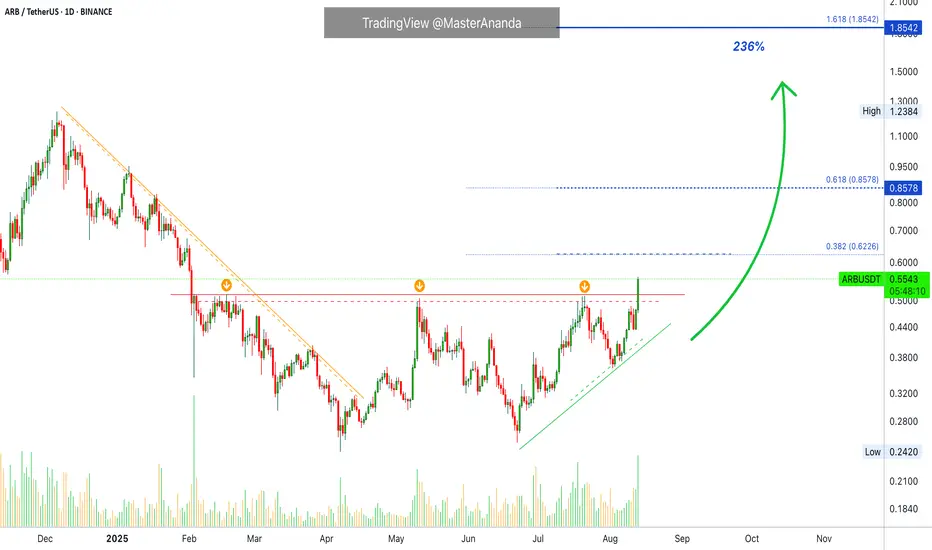
🚦From News: Arbitrum (ARB) To Soar Further? Key Harmonic Pattern Signals Potential Upside Move
The cryptocurrency market is in bullish mode as Ethereum (ETH) broke above the $4,200 level for the first time since 2021. This surge has sparked a broad rally, with major altcoins including Arbitrum (ARB) riding the wave higher. ARB has posted an impressive 20% weekly gain, but more importantly, its price chart is now flashing a harmonic pattern that may reveal its next move.
Harmonic Pattern Hints at Potential Bounce
On the daily timeframe, ARB is shaping up a Bearish ABCD harmonic pattern — a formation that, despite its “bearish” name, often includes a bullish CD leg before the price reaches its Potential Reversal Zone (PRZ).
The structure began with a strong rally from point A around $0.3237 to point B near $0.5090, followed by a retracement to point C at $0.3702, where buyers stepped back in. Since then, ARB has rebounded and is now trading around $0.4680, signaling that the CD leg is firmly underway.
Harmonic projections suggest the CD leg could extend toward the 1.236 Fibonacci extension of the BC leg, putting the PRZ around $0.5456. If achieved, this would mark an approximate 18% upside from current levels.
What’s Next for ARB?
Momentum remains tilted toward the bulls. A sustained push toward $0.5456 would complete the ABCD pattern, but that zone could also act as significant resistance, prompting some traders to secure profits.
On the downside, ARB must hold above its 25-day moving average, currently near $0.4315. A breakdown below this level could weaken the bullish case and potentially lead to a deeper consolidation phase.
#Highlights #everyone #BinanceSquareFamily #Binance #ARB #SUBROOFFICIAL
Disclaimer: This article is for informational purposes only and does not constitute financial advice. Always conduct your own research before making any investment decisions. Digital asset prices are subject to high market risk and price volatility. The value of your investment may go down or up, and you may not get back the amount invested. You are solely responsible for your investment decisions and Binance is not available for any losses you may incur. Past performance is not a reliable predictor of future performance. You should only invest in products you are familiar with and where you understand the risks. You should carefully consider your investment experience, financial situation, investment objectives and risk tolerance and consult an independent financial adviser prior to making any investment.
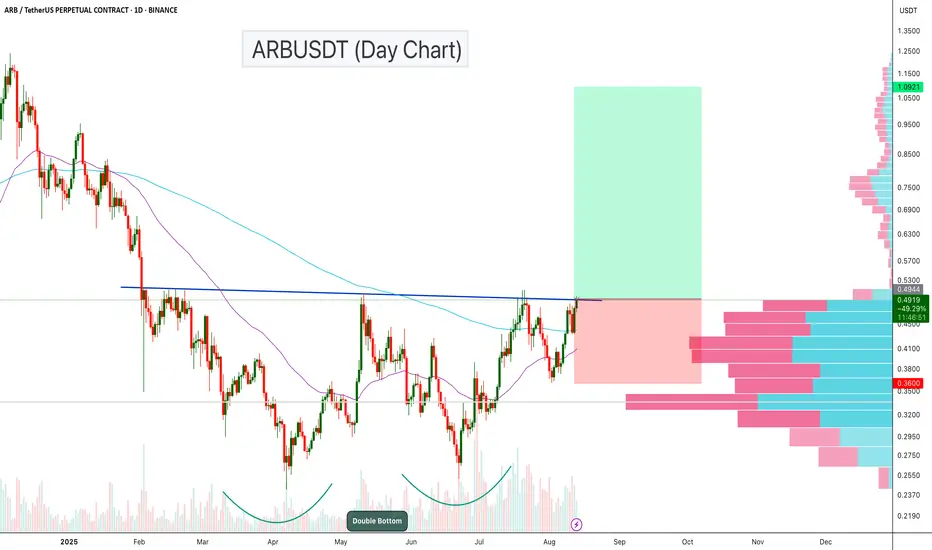
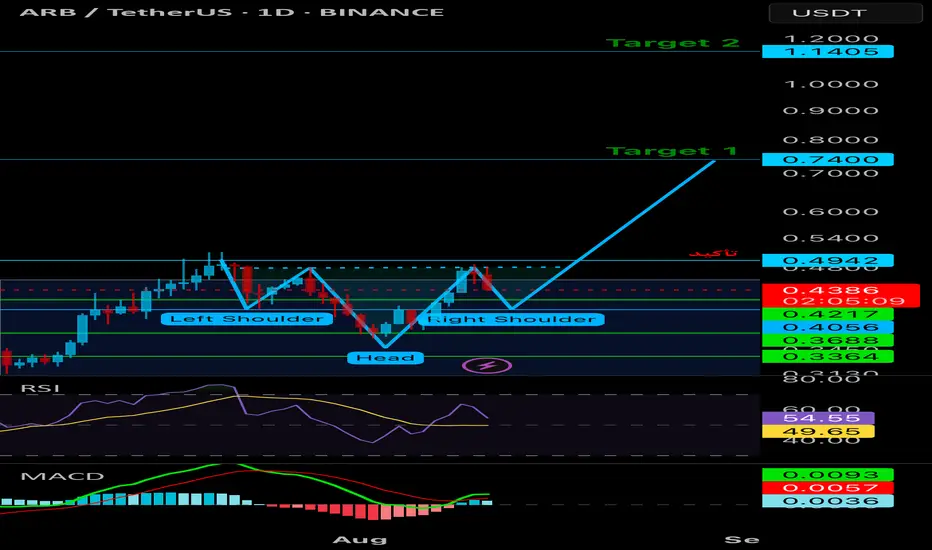
ARBUSDT – Double Bottom Breakout Loading?ARBUSDT is showing a strong bullish structure on the daily chart, with a classic Double Bottom pattern forming over the past few months. Price is now pressing against the neckline resistance, which, if broken, could trigger a powerful upside move.
Key Points:
Double Bottom Formation: The pattern started in April 2025 and completed its second bottom in July, indicating a potential long-term reversal setup.
Neckline Resistance: Price is currently testing the $0.49–$0.50 zone, which aligns with previous swing highs and marks the breakout level for the pattern.
Volume Profile: The visible range volume profile shows low-volume nodes above $0.50, suggesting a potential “thin air” move toward higher targets if the breakout is confirmed.
The chart is setting up for a potential trend reversal. A confirmed breakout from the double bottom neckline could propel ARBUSDT toward the $1+ zone
Cheers
Hexa
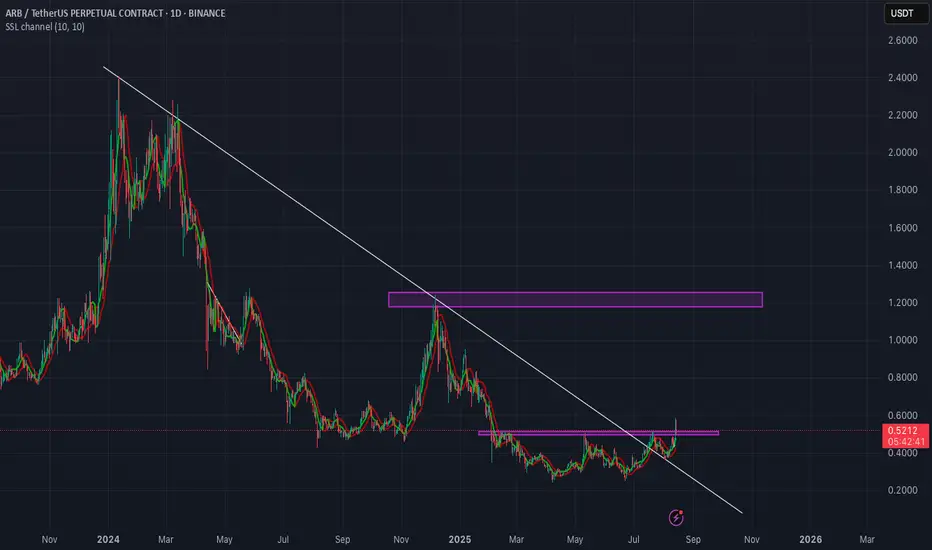
Altseason is Loading... Which One’s Your 10x Pick – $POL or $ARB🚨 BULL MARKET ACCUMULATION ALERT 🚨
Both PSX:POL and AMEX:ARB are currently trading below $0.40, and both charts are showing strong long-term bullish structure.
PSX:POL Analysis:
• Current Price: Under $0.40
• Strong Entry Zone: $0.20 – $0.17
• Bull Run Targets: $2 – $5
• Backed by powerful fundamentals, strong tech, and serious investors.
AMEX:ARB Analysis:
• Current Price: ~$0.40
• Key Accumulation Zone: $0.40 – $0.30
• Bull Run Targets: $2 – $5
• One of the strongest L2 ecosystems with deep liquidity and solid fundamentals.
Both are technically oversold, fundamentally strong, and positioned for major upside in the coming altseason.
Question for the community:
Which one hits $2 first — PSX:POL or AMEX:ARB ?
Drop your pick below 👇
NFA & DYOR

Arbitrum: How to Sell at the TopToday ARB finally broke out of a bottom pattern and trades at the highest price since February 2025, eight months ago.
Here we have a very strong chart and signals. All the signals are very advanced and fully confirmed. For example, today's candle is full green and hitting the highest price in months. Volume is the highest since February.
Here we have a rising trend. Up but not only bullish action. There are always retraces within growing periods. For example, look at July; a retrace but this retrace ends in a higher low followed by additional growth. Present, breaking resistance but once the next resistance level is hit, the possibility always opens for a new retrace. The retrace we know ends in a higher low and additional growth because we are in a bull market.
The current uptrend should go for months.
This is a mid-term chart you are looking at based on the daily timeframe. Targets are likely to hit within 1-3 months.
Arbitrum is rising nicely soon to meet 0.6226 as the first resistance zone for the current advance. Here we can see some minor disturbance followed by additional growth.
The 0.8578 resistance is much stronger than the previous one so profits can be secured around this zone only with the intention of buying everything back lower. Since we are certain—high positivity—that a strong bullish wave follows, we don't want to sell too early. The goal is to sell high.
The main target for this move is 1.85. After this level, we should get some sort of stop. Some pairs stop above the conquered resistance and go sideways for a while. Some produce a strong flush while others start a small correction, invariably, everything leads to additional growth and the market grows.
So, aim high and profit the most. When your pairs start hitting 300% profits start planning your take profits strategy and you can't never go wrong at this point. The most common mistake can be selling too early, not holding long enough. Another mistake is to hold forever and miss the top.
Namaste.
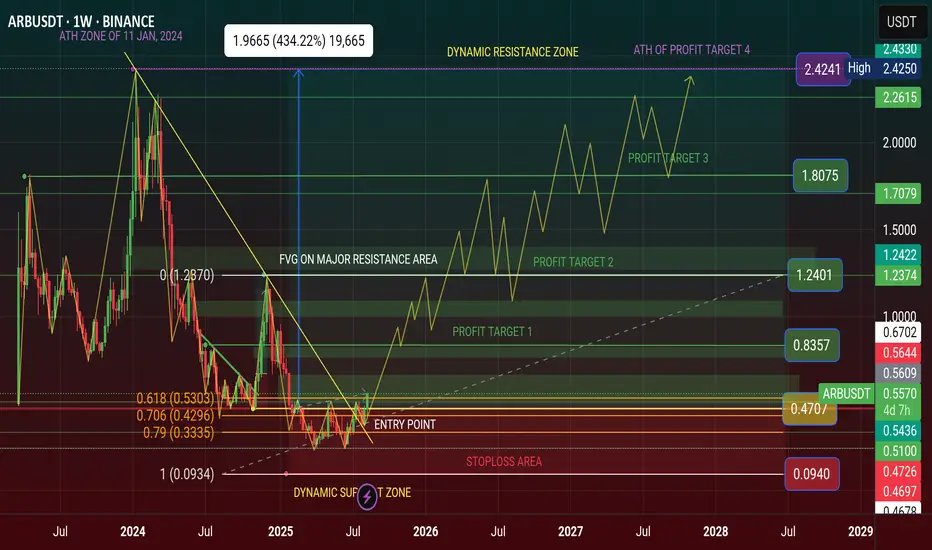
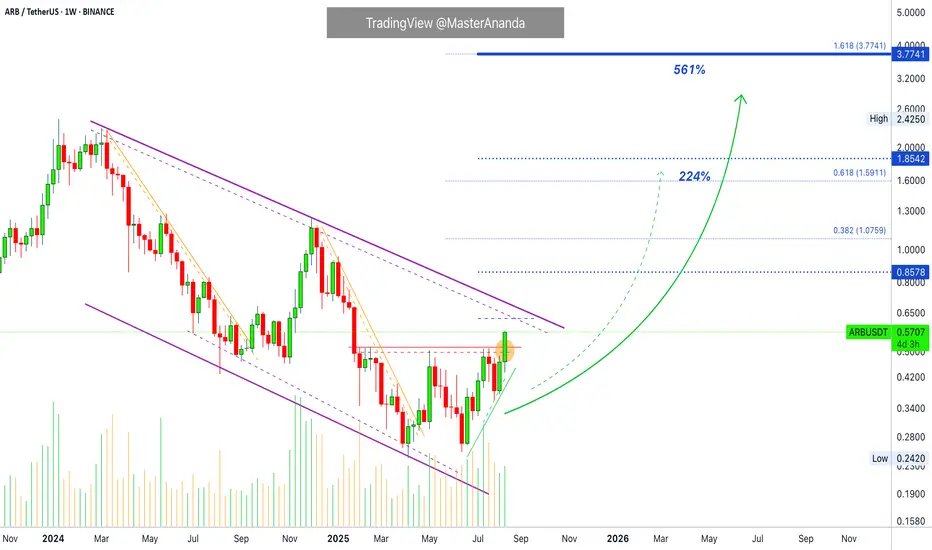
Arbitrum Long-Term vs Daily · Weekly TimeframeI Just showed you recently a chart for ARBUSDT on the daily timeframe. The main target was $1.85 mid-term. This target here shows 224% profits potential and is only a halfway through resistance, not a major point.
When we zoom out, looking here at ARBUSDT on the weekly timeframe, we can see the main target now being $3.77 for this move with a nice 561% total growth potential. More than twice as much as before.
ARBUSDT is now breaking local resistance with a full green candle. The weekly session is trading at the top and the week is only in half, we have many more days that can accommodate additional growth.
The daily timeframe can be used by those trading short to mid-term while the long-term timeframe, this one, can be used for long-term holders, buyers, traders.
My suggestion is to focus on the higher targets, even if just this one time because this is the time that matters and the time that counts. After this bullish cycle, you can secure profits on your trades at 30%, 50% or 100%. Now, you have to aim high because the market will produce the best possible, we have to make the most of this opportunity.
Thank you for reading.
Namaste.
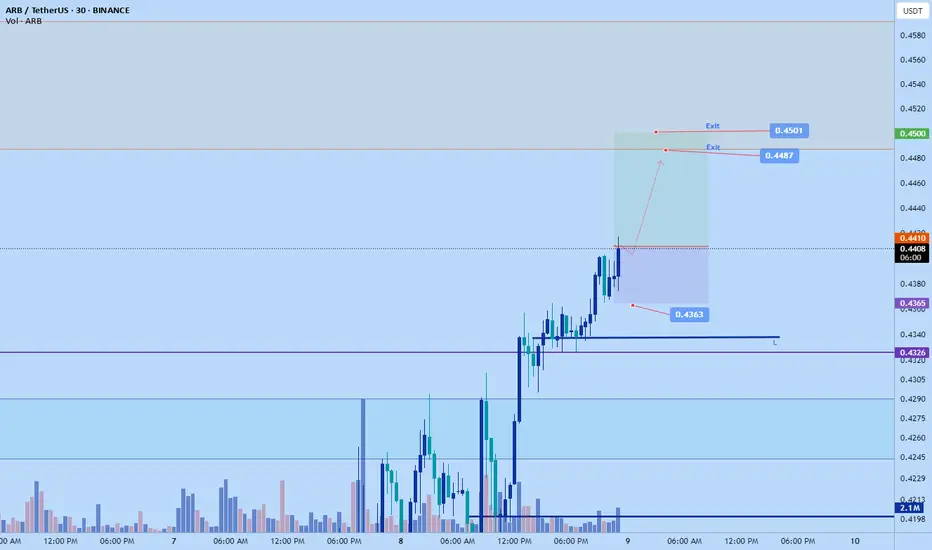
Arbitrum long to $0.45 tonightJust hopped into this. It's relatively high-could be buying the top but momentum seems to be holding up well.
Sl: 0.4363
Tp: 0.45 area
2RR
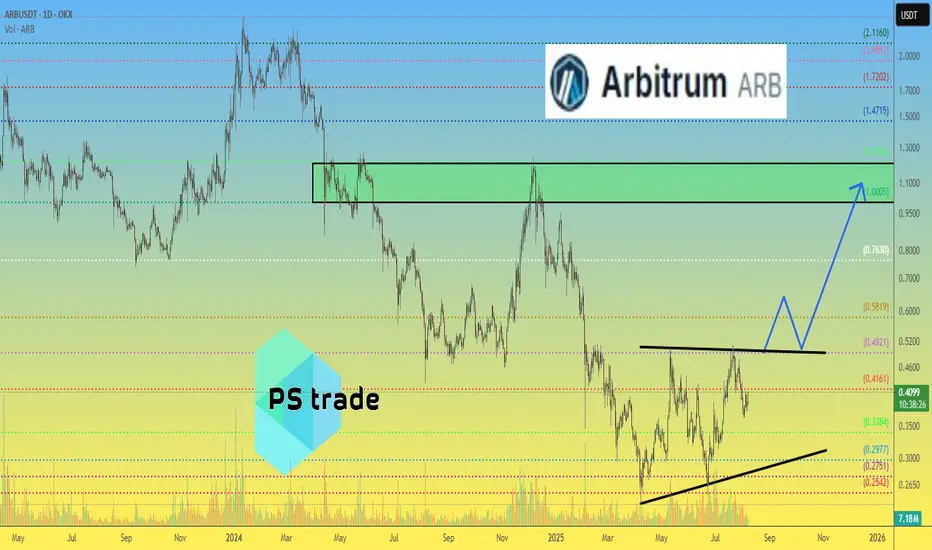
Arbitrum ARB price analysis — Can It Reclaim $1 ?Airdrop history 🪂 left a trail of regret — #ARB was widely distributed near $1, but most holders are still underwater 2 years later 💀
🔹 For recovery to start: break $0.50
🔻 Avoid the death zone: $0.30 must hold
🔄 If momentum returns and GameFi/DeFi reawakens — #ARB could lead.
🎯 If OKX:ARBUSDT price touches $1 again — don’t let greed win this time 😉
________________
📚 Follow us ❤️ for daily crypto insights & updates!
🚀 Don’t miss out on important market moves
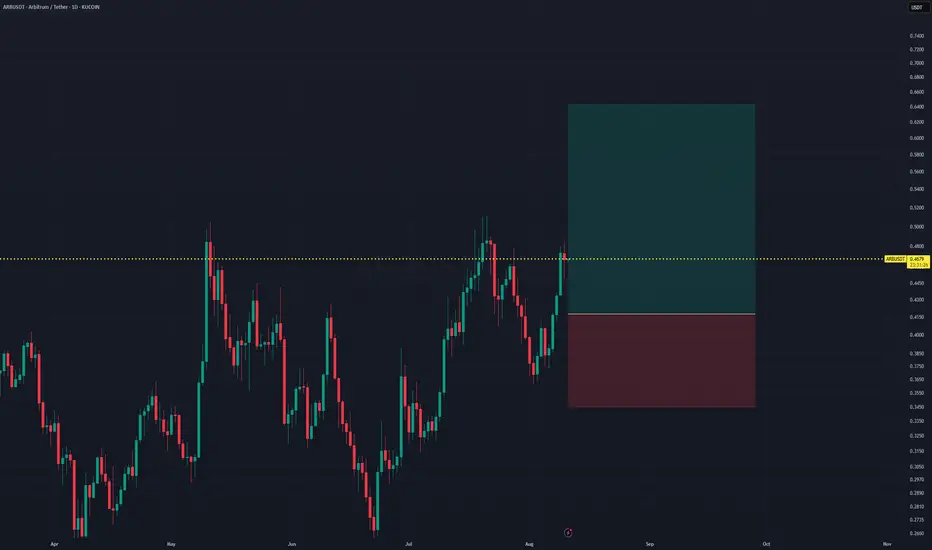
ARBUSDT Bullish Swing Setup Toward Major Resistance Breakout- Timeframe: Daily (D1)
- Position Type: Long (Buy)
Entry Point: 0.4117
The entry is positioned at a retest of a support-turned-pivot level, aiming to catch the upward momentum after recent bullish candles.
Stop Loss (SL): 0.3449
Placed below a strong support area and recent swing low, this stop limits the downside risk to around -17.43% from entry.
Take Profit (TP): 0.6427
Targeting the next major resistance zone, this level offers a potential gain of approximately +53.87% from entry.
Risk/Reward Ratio: 3.09
A well-balanced setup with more than 3 times the reward compared to the risk, making it attractive for swing trading.
Technical Outlook:
Price has recently rebounded from a local low and broken above short-term resistance, suggesting a possible bullish reversal. The entry at 0.4117 allows positioning before a potential rally toward the 0.6427 resistance zone.
Bullish Scenario: Sustained bullish momentum from 0.4117 could push price toward 0.6427, especially if daily closes remain above 0.4668 (yellow dotted line).
Bearish Scenario: A drop below 0.3449 would invalidate the setup and may signal a return to the broader downtrend.
Summary:
The trade is structured for a high R/R swing entry, buying near a strong technical level with a stop below recent support and a target aligned with previous resistance highs. Monitoring volume and overall market sentiment is crucial to validate the breakout strength.
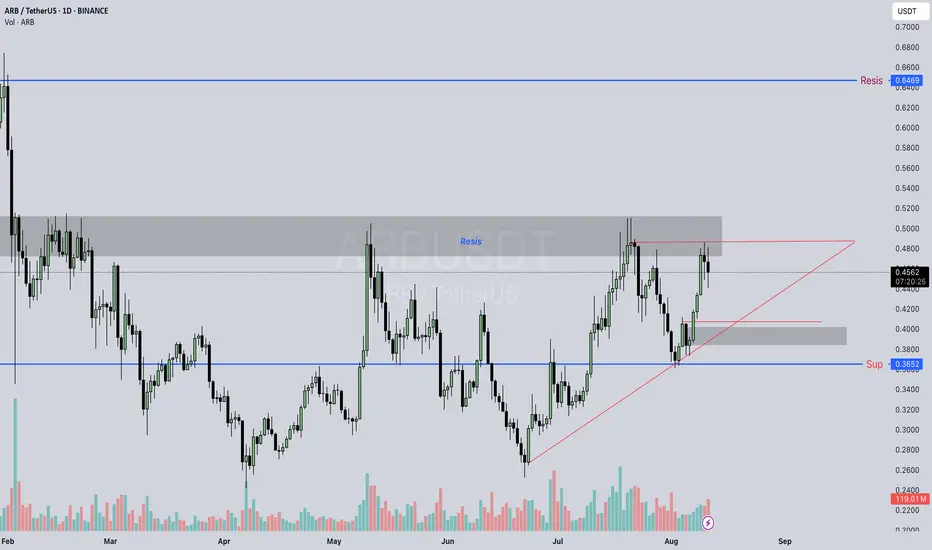
Arb / Usdt BINANCE:ARBUSDT
### 📊 **ARB/USDT (Daily Chart)**
* **💰 Current Price:** \~0.4580 USDT (+11.5% today)
* **🚧 Resistance Zones:**
* 🔹 **0.48–0.50** → key rejection area before.
* 🔹 **0.5697** & **0.6469** → major upside targets.
* **🛡 Support Levels:**
* 🔹 **0.42** → near rising trendline.
* 🔹 **0.3652** → strong historical support.
* **📈 Trend:** Riding an **ascending trendline** from July lows.
* **📊 Volume:** Strong buying spike → bullish momentum confirmed.
---
### 🔍 **What to Watch:**
✅ **Bullish:** Break & close above **0.50** → could aim for **0.57–0.64** fast.
⚠ **Bearish:** Rejection at 0.50 → possible pullback to **0.42** or **0.3652**.
---
⚠ **Disclaimer:**
*This is for educational purposes only, not financial advice. Always DYOR before trading.*

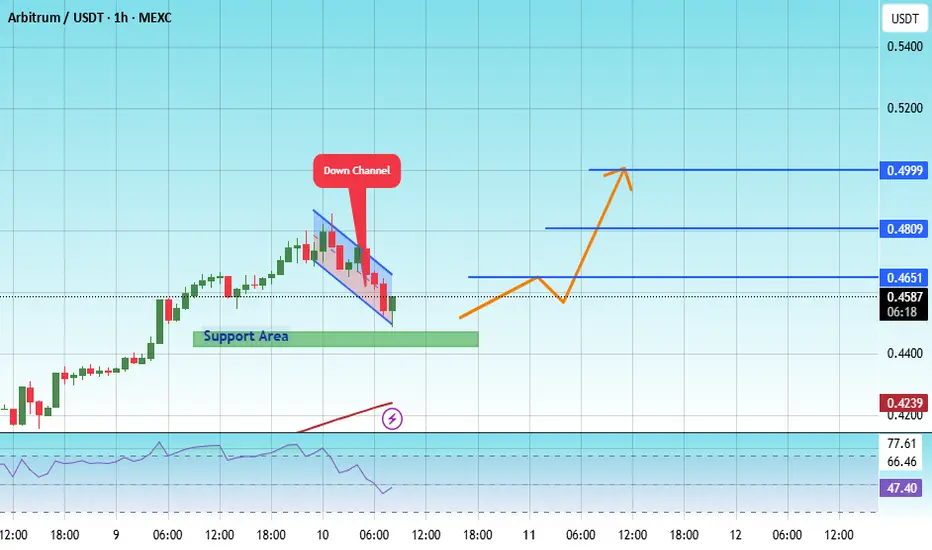
#ARB/USDT – Watching Key Support for Long Entry#ARB
The price is moving within an ascending channel on the 1-hour frame, adhering well to it, and is on track to break it strongly upwards and retest it.
We have support from the lower boundary of the ascending channel, at 0.4500.
We have a downtrend on the RSI indicator that is about to break and retest, supporting the upside.
There is a major support area in green at 0.4420, which represents a strong basis for the upside.
Don't forget a simple thing: ease and capital.
When you reach the first target, save some money and then change your stop-loss order to an entry order.
For inquiries, please leave a comment.
We have a trend to hold above the 100 Moving Average.
Entry price: 0.4580.
First target: 0.4650.
Second target: 0.4810.
Third target: 0.5000.
Don't forget a simple thing: ease and capital.
When you reach the first target, save some money and then change your stop-loss order to an entry order.
For inquiries, please leave a comment.
Thank you.
Ride the Wave: $ARB 4H Breakout Strategy with RSI AlertBINANCE:ARBUSDT
Ride the Wave: AMEX:ARB 4H Breakout Strategy with RSI Alert
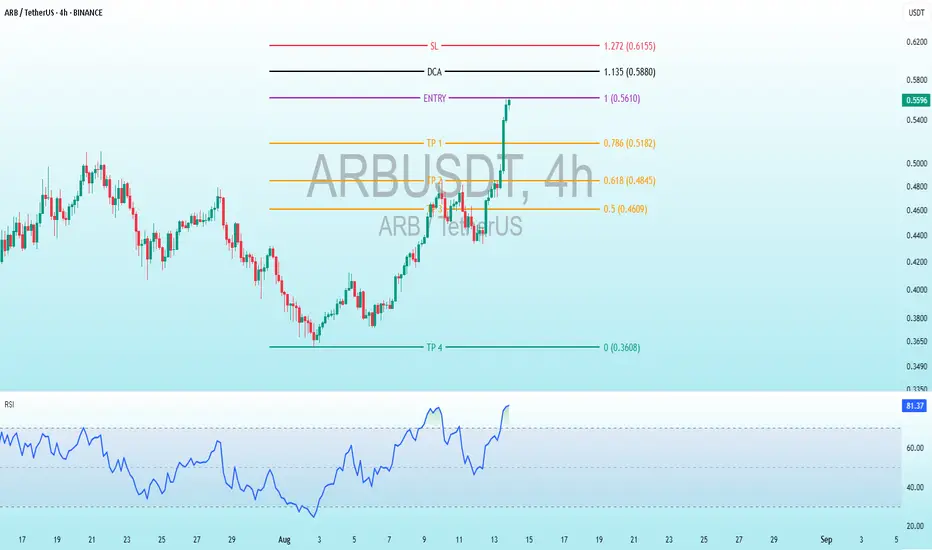
Trading Levels:
Entry: 1.00 (0.5610 USDT) - The level where the initial purchase is planned.
DCA (Dollar-Cost Averaging): 1.135 (0.5880 USDT) - An additional buying point if the price rises.
SL (Stop Loss): 1.272 (0.6155 USDT) - The level where the loss would be limited.
TP (Take Profit):TP1: 0.786 (0.5182 USDT)
TP2: 0.618 (0.4845 USDT)
TP3: 0.5 (0.4609 USDT)
TP4: 0.3608 (0.3608 USDT) - A lower target, possibly a long-term goal.
RSI (Relative Strength Index) Indicator:
The current RSI value is 81.36, which is in the overbought territory (above 70 and nearing 80). This suggests the price may be overextended, hinting at a potential reversal or consolidation soon.
Analysis and Interpretation:Strategy:
The chart uses Fibonacci levels to determine entry, exit, and loss points. The entry is set at 0.5610 USDT, with a DCA at 0.5880 USDT if the price continues to rise, and a stop loss at 0.6155 USDT to protect capital.
Profit Targets: TP1 to TP3 are based on Fibonacci retracement levels (0.786, 0.618, 0.5), indicating a technical approach to taking profits gradually. TP4 at 0.3608 USDT seems significantly lower and might represent a long-term target or an error.
RSI: The high RSI value (81.36) indicates an overbought condition. This could signal an impending pullback or correction, especially if the price fails to maintain its recent upward momentum.
Recommendation:
Watch the price closely around the entry level (0.5610 USDT) and DCA (0.5880 USDT). Given the overbought RSI, exercise caution with new entries or consider preparing for a potential sell-off.
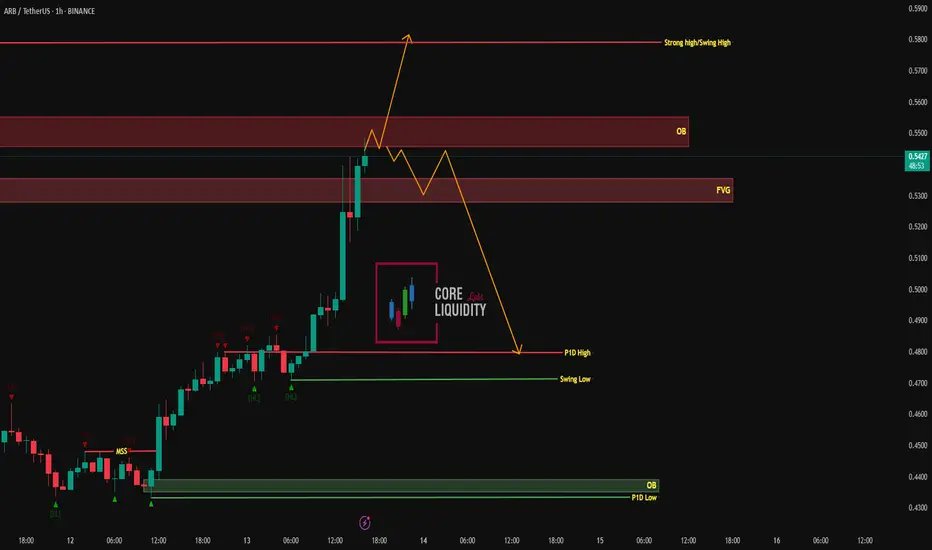
ARB/USDT – H1 Market Outlook Price is approaching a key OB supply zone after a strong bullish run.
From here, two scenarios could unfold:
1️⃣ Bullish Extension:
Break and hold above OB → target Strong High / Swing High near 0.5800.
2️⃣ Bearish Rejection:
Reject from OB → drop through FVG toward P1D High (0.5000) and possibly lower toward Swing Low.
Key Levels:
Resistance: OB (0.5450–0.5550), Strong High (0.5800)
Support: FVG (0.5300), P1D High (0.5000), Swing Low (0.4900), OB Demand (0.4400)
📌 Plan: Watch OB reaction — breakout means continuation, rejection means pullback to reclaim liquidity.
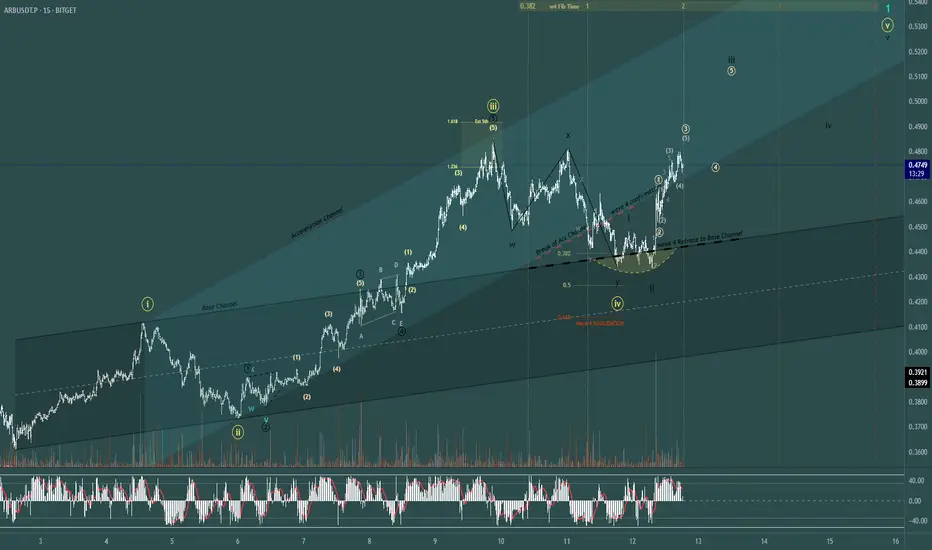
Wave 5 to the upside on Arbitrum!Wave 4 completed with double confluence using Jeff Kennedy's Channeling Technique. As shown on the chart wave 3 peaks after an extended 5th wave to finish wave 3. Wave 4 retracement lasted 2 days, finishing after the 1 Fib Time, it retraced at least 38.2% of wave 3 in a WXY Complex Correction falling below the bottom of the Acceleration Channel, confirmation we are in a wave 4. Wave 4 fell a bit below the top of the base channel, often if the top line fails, and the correction extends, I may look for a center line reversal inside the Base Channel. So, for these reasons I am looking up for wave 5 and calling wave 4 done. I may update with the wave 5 Termination Channel as it would have been to cluttered displaying 3 channels. Using these channels it is possible to be profitable trading Elliott Waves without knowing everything about the wave principle.
ARB — The Breakout Retest Nobody’s Watching (Yet)Smart money took their first bite on the breakout. We’re stalking the retest — where late shorts become early fuel.
Textbook pullback + BOS structure + fib pocket = prime execution zone.
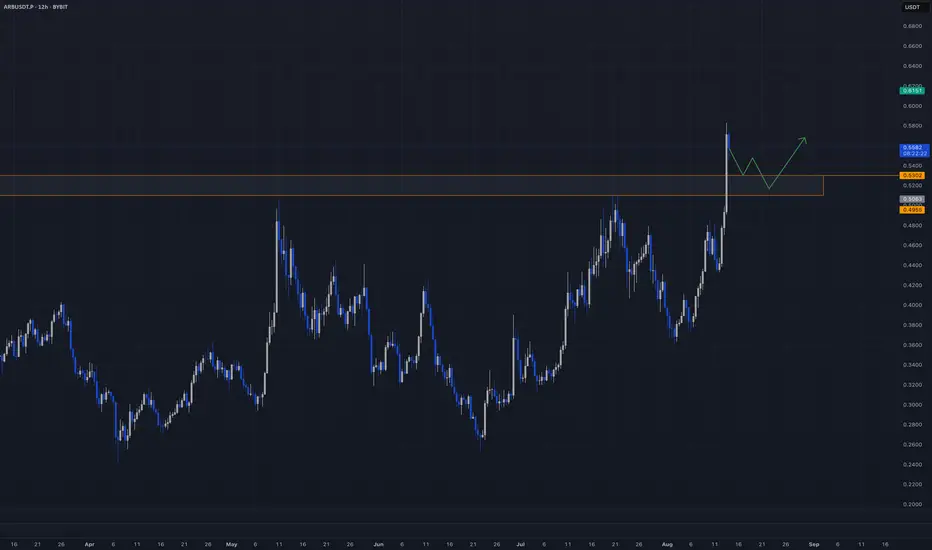
📊 BINANCE:ARBUSDT.P — Liquidity-Grab Pullback (12H)
🎯 Direction: Long
📍 Entry Zone: $0.510 – $0.530 (HTF breakout retest + 0.5 fib retrace)
🛑 Stop Loss: $0.490 (below breakout base/liquidity shelf)
💰 Targets:
• TP1 — $0.630 (prior supply)
• TP2 — $0.665 (range extension high)
• TP3 — $0.700 (psycho level + expansion)
📐 RR Ratio: ~3.5 : 1 (to TP2)
🧠 Trust Meter: █████████▒▒ — 90%
⸻
🔍 Why We Like It
• HTF Bias Bullish: Clean 12H breakout above April–July EQHs at $0.505.
• Post-Sweep Strength: Closed strong on volume, trapping late shorts & early longs.
• Breakout Fuel: 24h volume spike + OI expansion + short liquidations = momentum confirmation.
⸻
📏 Execution Checklist
• Wait for 5m/15m BOS up from retest box.
• No entry if price accepts below $0.505 before BOS.
• Favor displacement entries → limit in the 0.5 pocket.
⚙️ Management
• Move SL → BE at TP1, then trail under 5m HL ladder.
• Scale out only into weakness at supply.
❌ Invalidation
• Clean 12H close < $0.50.
• BTC breakdown under key intraday supports → stand aside.
🚀 Candle Craft | Signal. Structure. Execution.
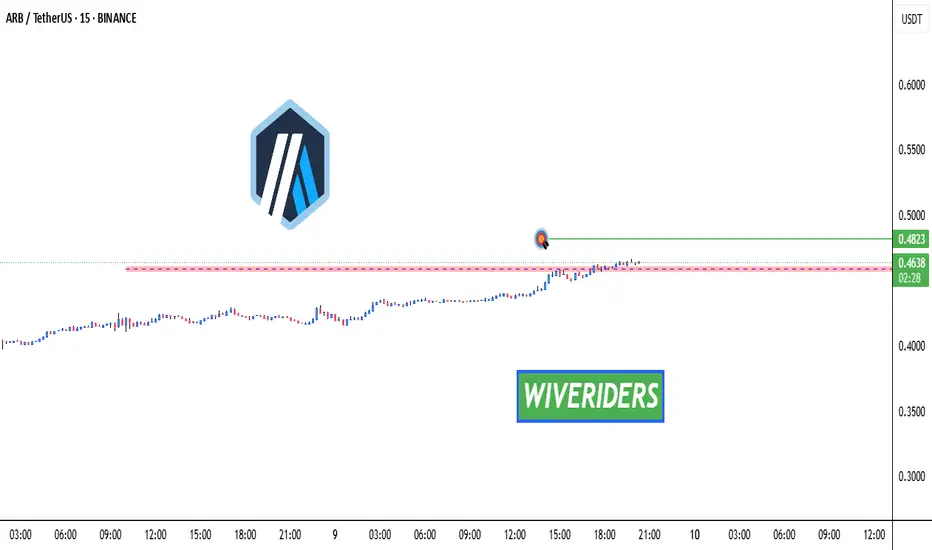
ARB Breakout Watch – Red Resistance Being Tested!🚨 AMEX:ARB Breakout Watch – Red Resistance Being Tested! 🔴⏳
AMEX:ARB is testing the red resistance zone.
📊 If breakout confirms, next move could target:
🎯 First Target → Green line level
A breakout could trigger bullish continuation and upside momentum.
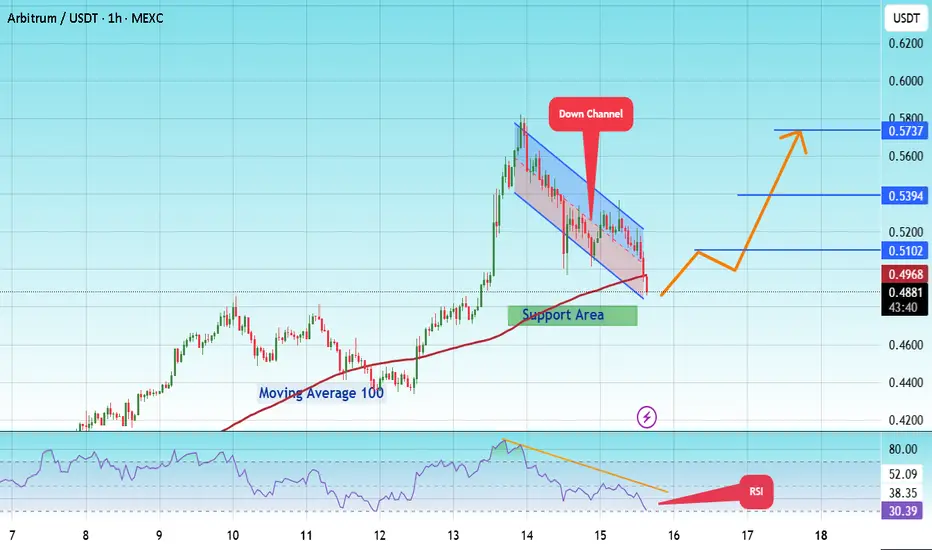
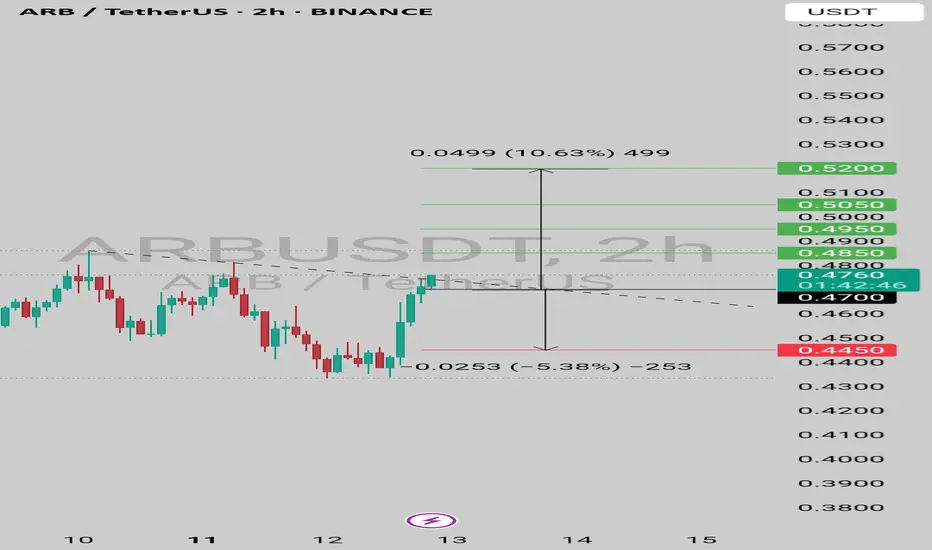
#ARB/USDT – Watching Key Support for Long Entry !#ARB
The price is moving within a descending channel on the 1-hour frame and is expected to break and continue upward.
We have a trend to stabilize above the 100 moving average once again.
We have a downtrend on the RSI indicator that supports the upward move with a breakout.
We have a support area at the lower boundary of the channel at 0.4850, acting as strong support from which the price can rebound.
We have a major support area in green that pushed the price upward at 0.4740.
Entry price: 0.4890.
First target: 0.5100.
Second target: 0.5394.
Third target: 0.5737.
To manage risk, don't forget stop loss and capital management.
When you reach the first target, save some profits and then change the stop order to an entry order.
For inquiries, please comment.
Thank you.