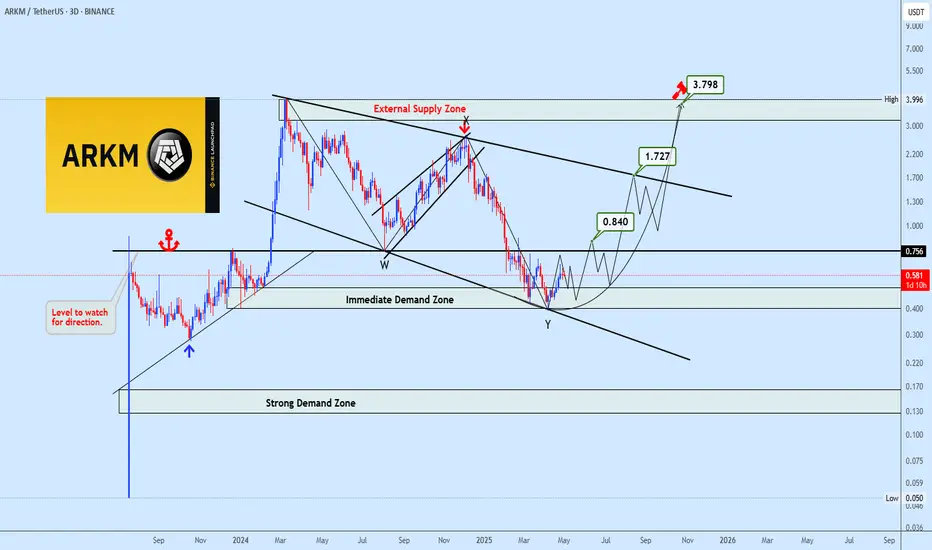
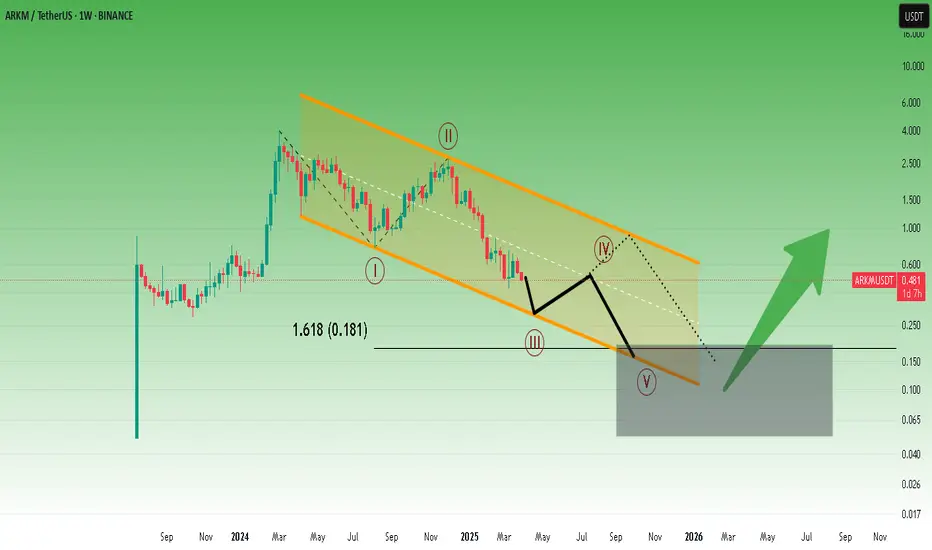
ARKMUSDT Correction Structuring MidTerm RecoveryARKMUSDT has completed a complex corrective structure, terminating near a well-defined immediate demand zone where price action has begun to exhibit basing characteristics. The final leg into this zone coincided with the lower boundary of a descending broadening wedge, further reinforcing this regio
ARKMUSDT 2D AnalysisARKM ~ 2D Analysis
#ARKM Buy gradually from this support block with a short term target of at least 20%+ from here.
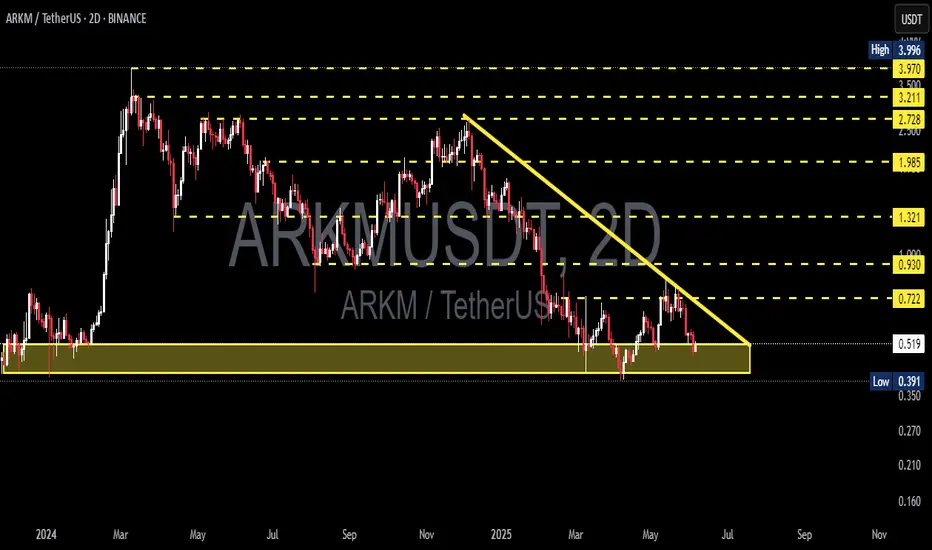
Arkm can be bearish in short term.It may want to go down to the range of 0.4 to 0.37.
* The purpose of my graphic drawings is purely educational.
* What i write here is not an investment advice. Please do your own research before investing in any asset.
* Never take my personal opinions as investment advice, you may lose your mone
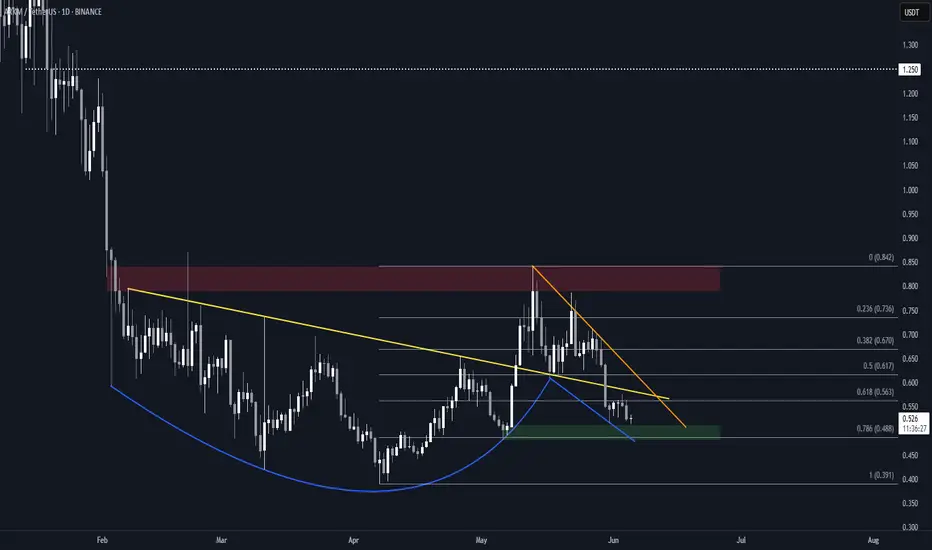
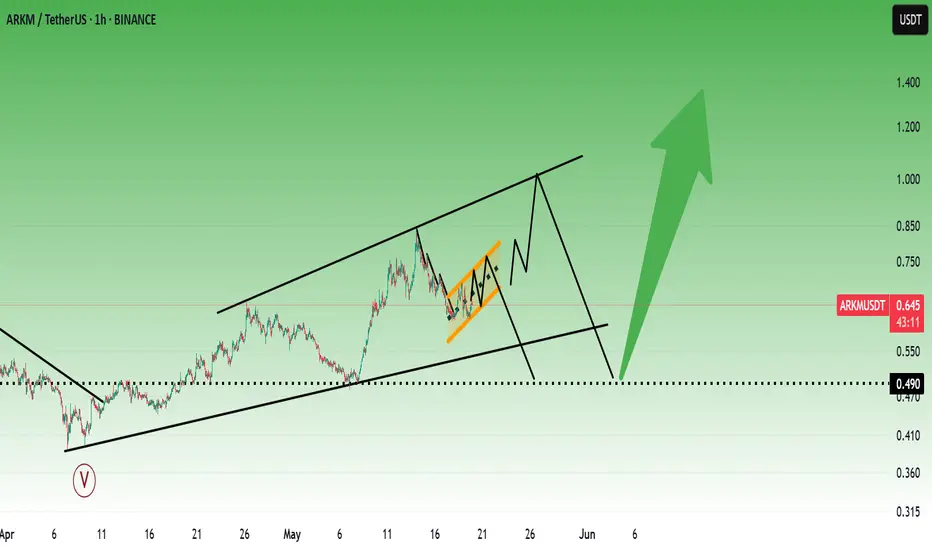
Arkham (ARKM) Structure Analysis (1D)Interesting chart for BINANCE:ARKMUSDT
Apologies for the trendlines mess, but they're all potentially relevant.
Watch for
• Bounce at ~$0.49 (0.786 Fib)
• Break above the yellow and orange resistance trendlines (~$0.57)
These conditions could form a Cup & Handle pattern and lead to a retest of
Arkm's price may drop more and more.Arkm may provide a good opportunity for long-term buying in the coming months. Most likely in the autumn months.
* The purpose of my graphic drawings is purely educational.
* What i write here is not an investment advice. Please do your own research before investing in any asset.
* Never take my
ARKM BIAS consistently strong bullish market structure,
high-probability bullish bias. Expect continued upward movement, with any retracements into unmitigated bullish institutional zones potentially offering favorable long entry opportunities.
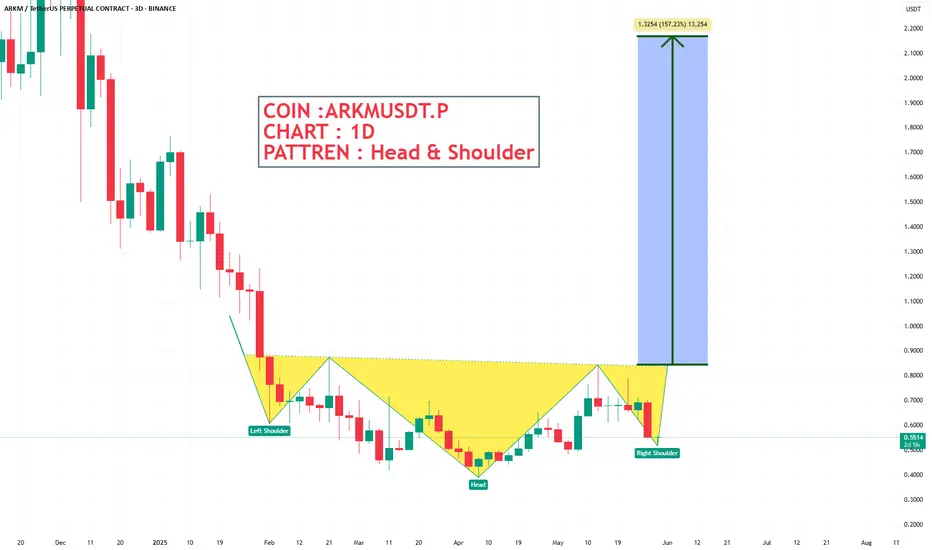
ARKMUSDT.P Make a Head & Shoulder pattren in 3 D chart🛫 COIN : ARKMUSDT.P
🕯 CHART : 3D
📊 PATTREN : Head & Shoulder
🔼 POSITION : BULLISH📈
💵1 Target - $ 0.9050
💵2 Target - $ 1.2669
💵3 Target - $ 1.1550
💵4 Target - $ 1.7910
💵5 Target - $ 2.1685
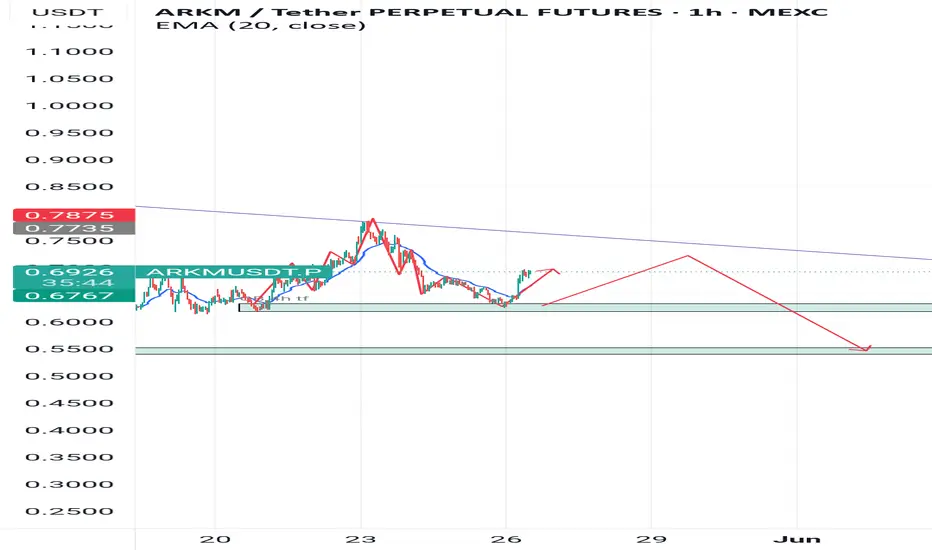
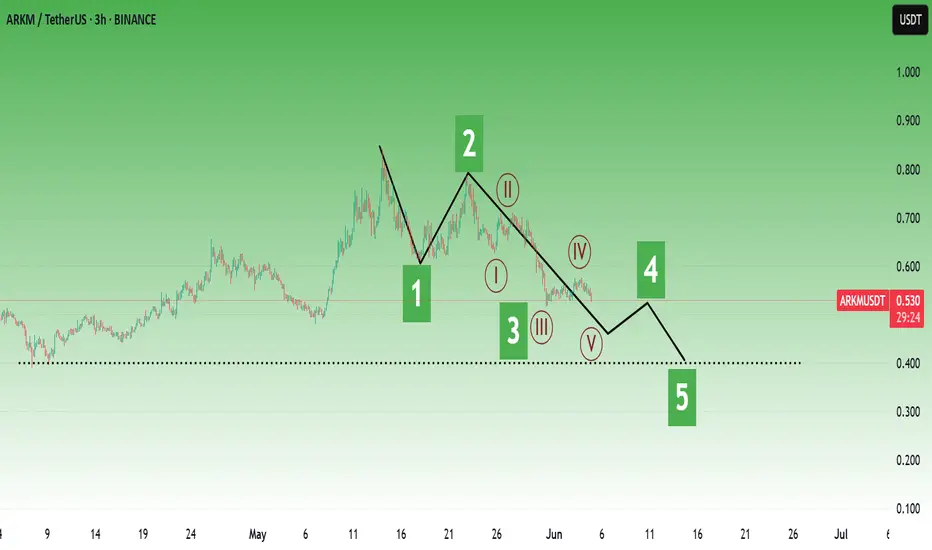
Arkm near term.Possible near term scenarios.
* The purpose of my graphic drawings is purely educational.
* What i write here is not an investment advice. Please do your own research before investing in any asset.
* Never take my personal opinions as investment advice, you may lose your money.
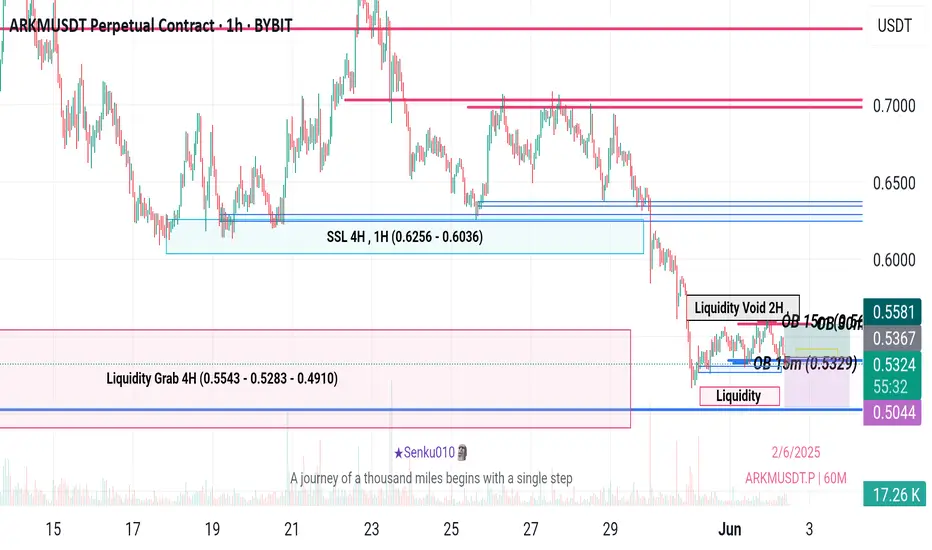
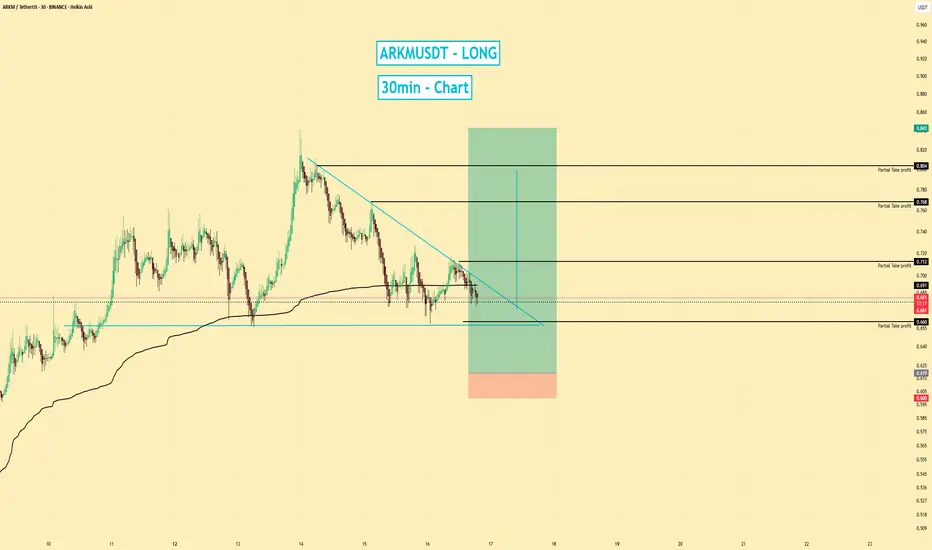
ARKMUSDT | Long Setup | Potential Squeeze | (May 2025)ARKMUSDT | Long Setup | Potential Squeeze on High OI | (May 2025)
1️⃣ Insight Summary:
ARKM is showing signs of potential overleveraged positions building up. While this isn't a high-conviction trade, it could turn into a short squeeze play if key levels hold and open interest continues to rise.
2
See all ideas
Summarizing what the indicators are suggesting.
Oscillators
Neutral
SellBuy
Strong sellStrong buy
Strong sellSellNeutralBuyStrong buy
Oscillators
Neutral
SellBuy
Strong sellStrong buy
Strong sellSellNeutralBuyStrong buy
Summary
Neutral
SellBuy
Strong sellStrong buy
Strong sellSellNeutralBuyStrong buy
Summary
Neutral
SellBuy
Strong sellStrong buy
Strong sellSellNeutralBuyStrong buy
Summary
Neutral
SellBuy
Strong sellStrong buy
Strong sellSellNeutralBuyStrong buy
Moving Averages
Neutral
SellBuy
Strong sellStrong buy
Strong sellSellNeutralBuyStrong buy
Moving Averages
Neutral
SellBuy
Strong sellStrong buy
Strong sellSellNeutralBuyStrong buy
Displays a symbol's price movements over previous years to identify recurring trends.