ARKM/USDT – Bullish Continuation Pattern with Upside Potential
Date: July 18, 2025
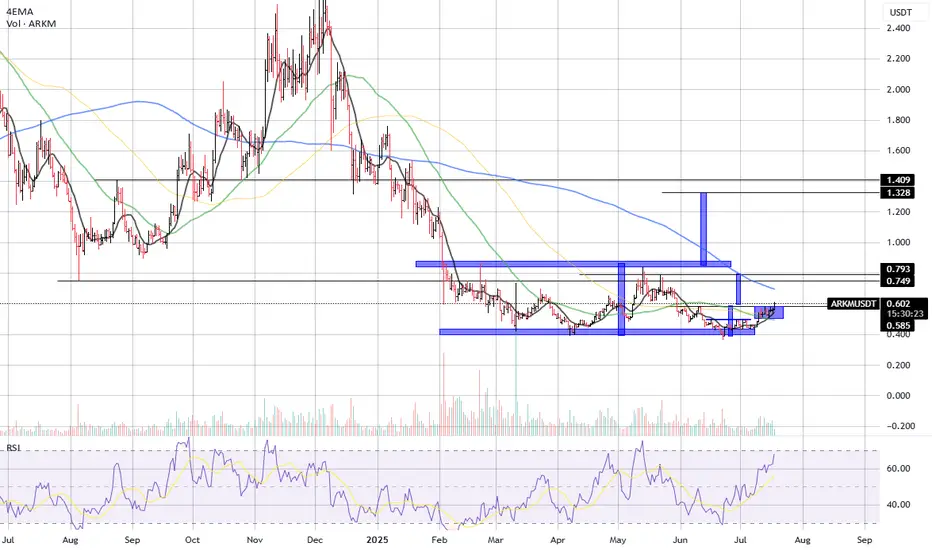
ARKM/USDT is showing renewed bullish momentum after a prolonged accumulation phase. The price has broken out of a tight range and is now pushing above key moving averages with volume support, indicating a potential trend reversal and upside continuation.
📊 Technical Overview:
Related pairs
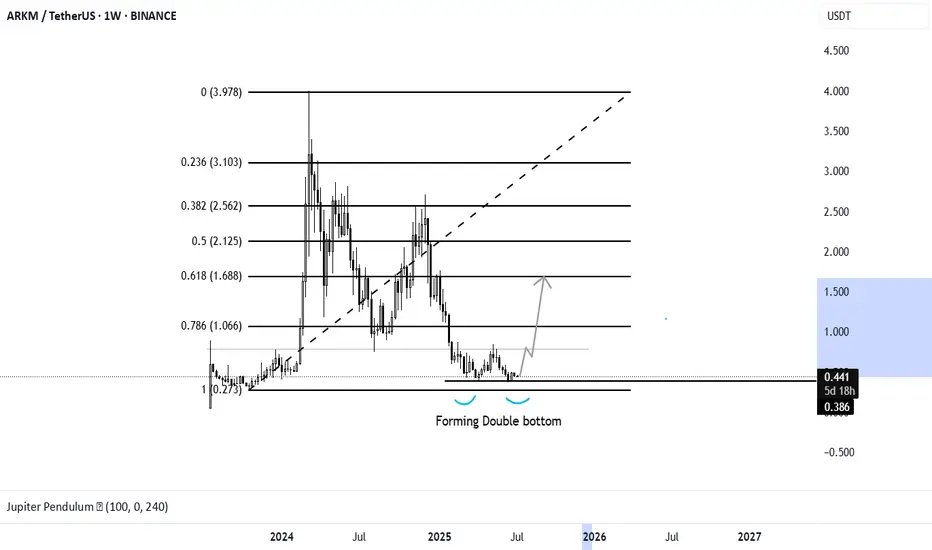
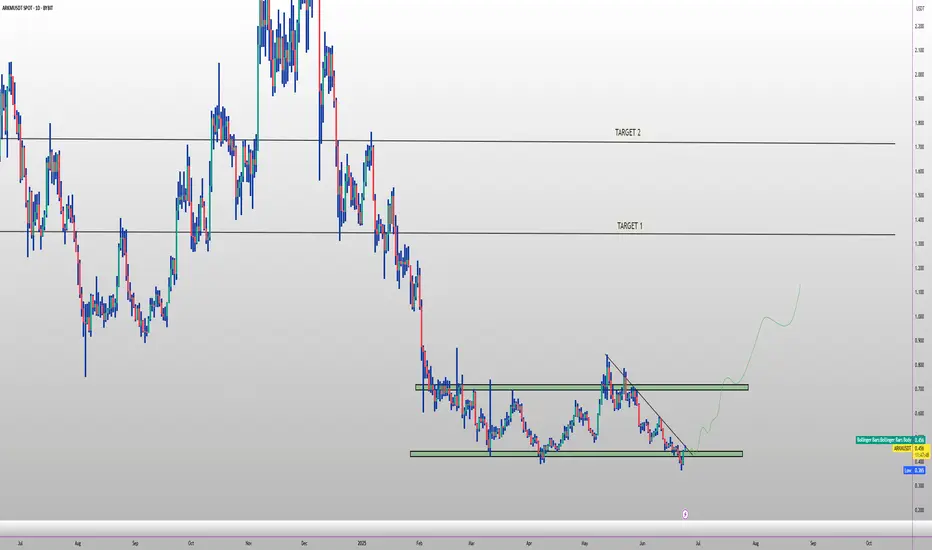
ARKM forming double bottom. Good news for the ARKM long term holders is that ARKM is forming a double bottom where i am expecting it would grow more than 250% till OCT 2025. Its not so complicated when you keep things simple and for long term.
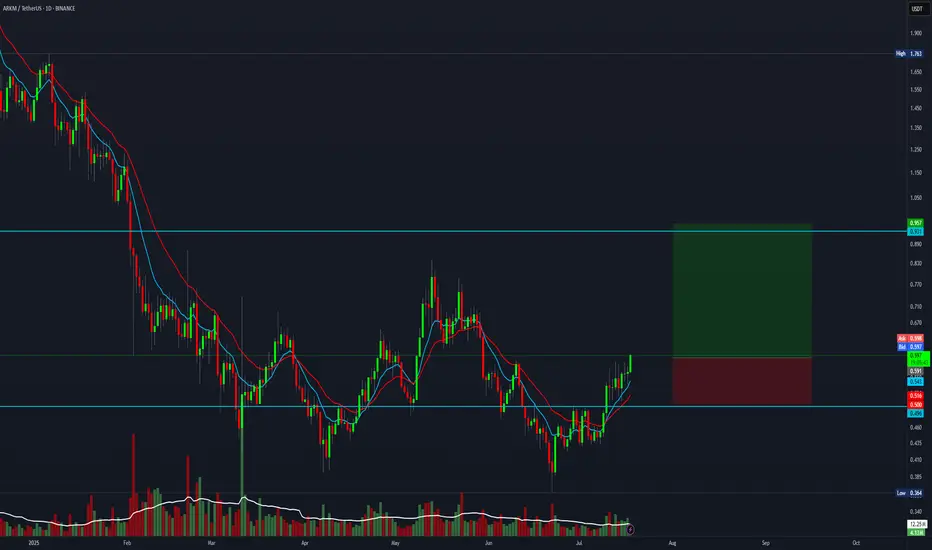
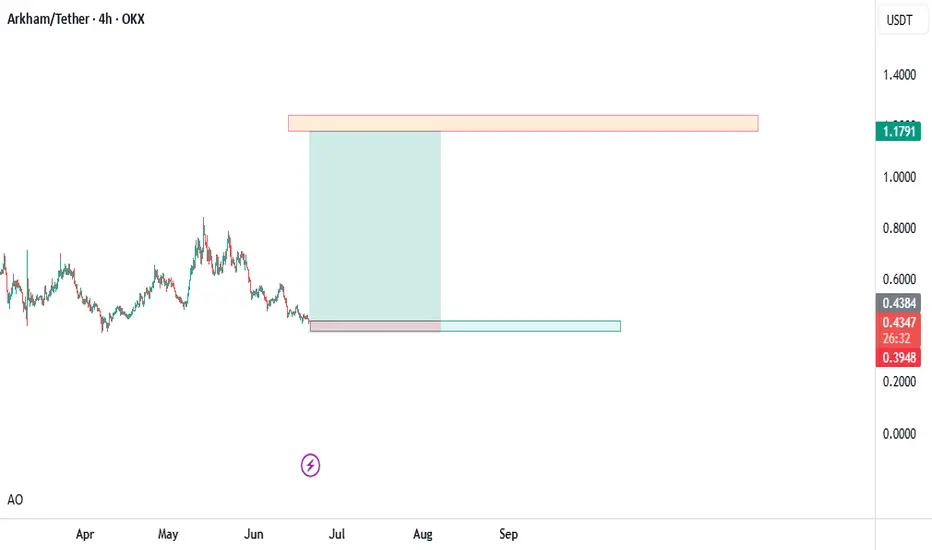
4:1 R:R trade setup for ARKMEverything is pumping right now, and this one also offers a 4:1 R:R setup.
Entry: 0.596
Stop Loss: 0.500
Target: 0.950
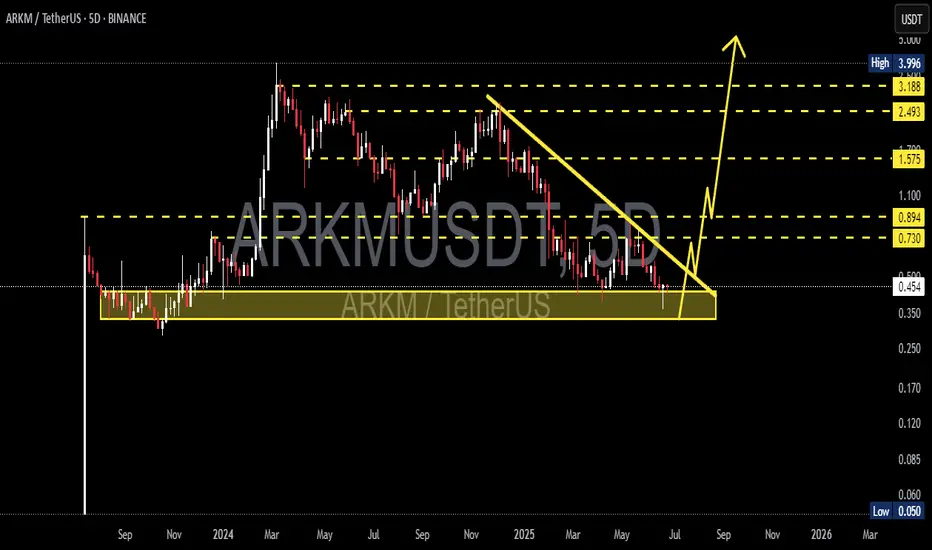
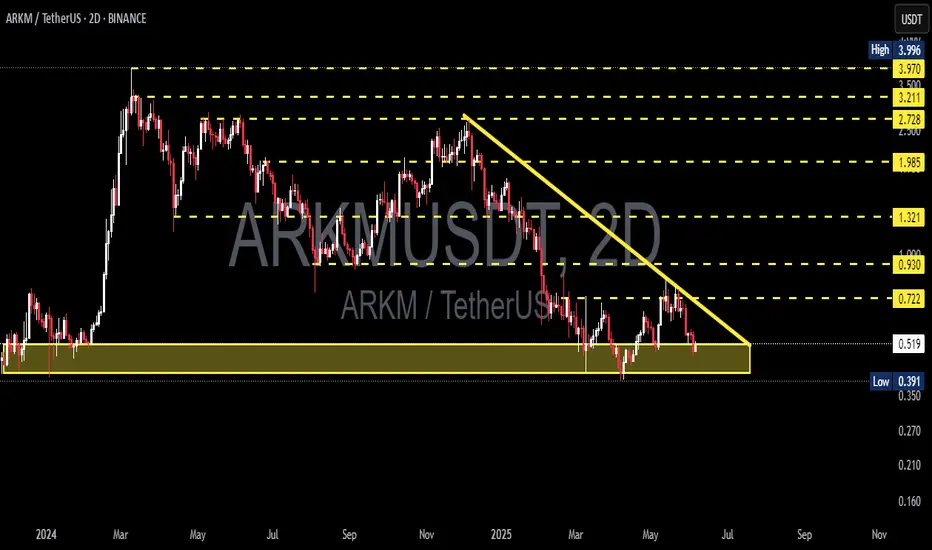
ARKM/USDT – Major Breakout Signal from Multi-Month Accumulation Detailed Analysis:
ARKM/USDT is currently showing a strong technical signal for a potential bullish reversal after a prolonged downtrend from its peak near $3.996. Here are the key insights from the chart:
1. Long-Term Accumulation Zone:
Price has formed a strong horizontal support zone between $
#ARKM is ready for an upside move of more than 150%#ARKM is ready for an upside move of more than 150%, and the remaining altcoins are set for a 100% move.
This will be the final upside move—after this, a severe crash will follow, one beyond imagination.
For example, SOL could fall below even $50.
ARKM BREAKOUT WATCH🔥 $ARKM long setup (1 D) 🚀
✅ Entry Zone: $0.44 – $0.41 (triple-tested demand)
🎯 Targets
• TP-1: $0.75 (Jan-25 supply flip)
• TP-2: $1.30 (post-IPO breakdown block)
⛔ Stop-Loss
Daily close < $0.37
📊 Thesis
• Arkham Intel Exchange = world’s first on-chain intel marketplace; >1,300 bounties posted
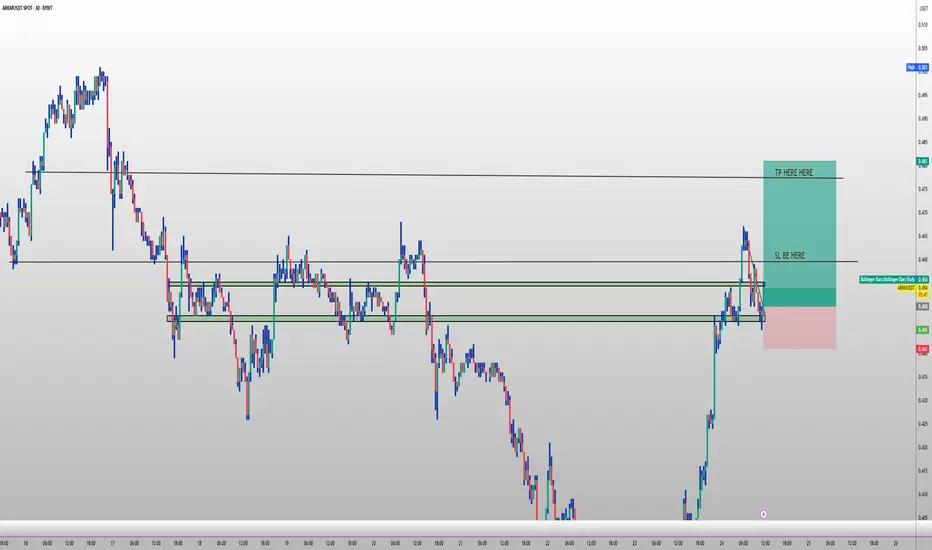
ARKM SCALP 🔥 ARKM Long Setup (30m) 🚀
✅ Entry Zone: $0.4524 – $0.449
🎯 Targets
• TP-1: $0.481
• TP-2: $0.501
⛔ Stop-Loss: $0.441
ARKMUSDT 2D AnalysisARKM ~ 2D Analysis
#ARKM Buy gradually from this support block with a short term target of at least 20%+ from here.
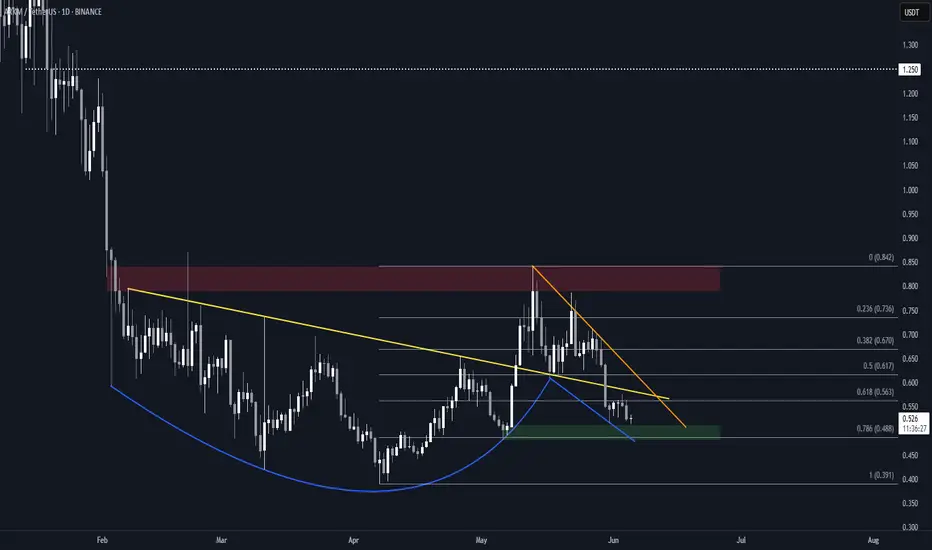
Arkham (ARKM) Structure Analysis (1D)Interesting chart for BINANCE:ARKMUSDT
Apologies for the trendlines mess, but they're all potentially relevant.
Watch for
• Bounce at ~$0.49 (0.786 Fib)
• Break above the yellow and orange resistance trendlines (~$0.57)
These conditions could form a Cup & Handle pattern and lead to a retest of
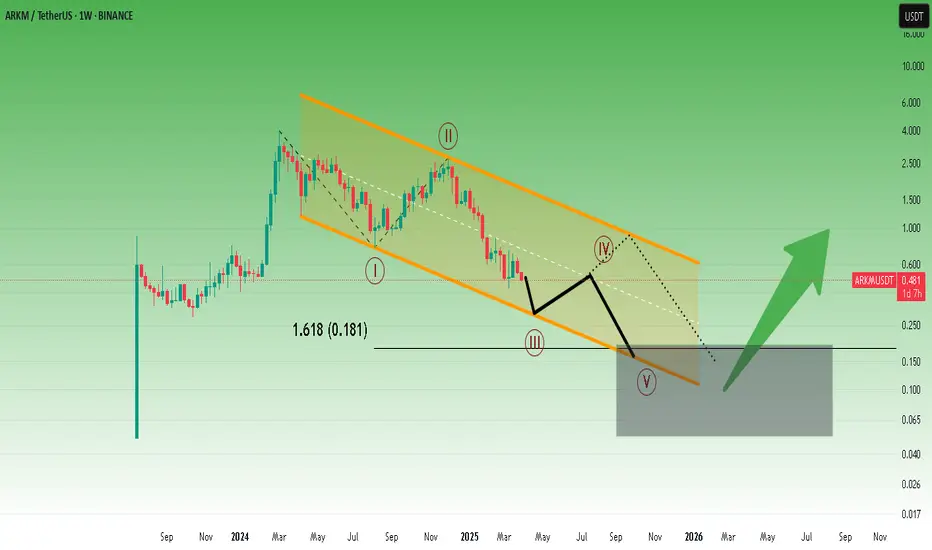
Arkm's price may drop more and more.Arkm may provide a good opportunity for long-term buying in the coming months. Most likely in the autumn months.
* The purpose of my graphic drawings is purely educational.
* What i write here is not an investment advice. Please do your own research before investing in any asset.
* Never take my
See all ideas
Summarizing what the indicators are suggesting.
Oscillators
Neutral
SellBuy
Strong sellStrong buy
Strong sellSellNeutralBuyStrong buy
Oscillators
Neutral
SellBuy
Strong sellStrong buy
Strong sellSellNeutralBuyStrong buy
Summary
Neutral
SellBuy
Strong sellStrong buy
Strong sellSellNeutralBuyStrong buy
Summary
Neutral
SellBuy
Strong sellStrong buy
Strong sellSellNeutralBuyStrong buy
Summary
Neutral
SellBuy
Strong sellStrong buy
Strong sellSellNeutralBuyStrong buy
Moving Averages
Neutral
SellBuy
Strong sellStrong buy
Strong sellSellNeutralBuyStrong buy
Moving Averages
Neutral
SellBuy
Strong sellStrong buy
Strong sellSellNeutralBuyStrong buy
Displays a symbol's price movements over previous years to identify recurring trends.
Frequently Asked Questions
The current price of ARKHAM / USDT (ARKM) is 0.573 USDT — it has risen 3.73% in the past 24 hours. Try placing this info into the context by checking out what coins are also gaining and losing at the moment and seeing ARKM price chart.
ARKHAM / USDT price has risen by 9.16% over the last week, its month performance shows a 29.49% increase, and as for the last year, ARKHAM / USDT has decreased by −65.83%. See more dynamics on ARKM price chart.
Keep track of coins' changes with our Crypto Coins Heatmap.
Keep track of coins' changes with our Crypto Coins Heatmap.
ARKHAM / USDT (ARKM) reached its highest price on Jun 7, 2024 — it amounted to 2.739 USDT. Find more insights on the ARKM price chart.
See the list of crypto gainers and choose what best fits your strategy.
See the list of crypto gainers and choose what best fits your strategy.
ARKHAM / USDT (ARKM) reached the lowest price of 0.365 USDT on Jun 22, 2025. View more ARKHAM / USDT dynamics on the price chart.
See the list of crypto losers to find unexpected opportunities.
See the list of crypto losers to find unexpected opportunities.
The safest choice when buying ARKM is to go to a well-known crypto exchange. Some of the popular names are Binance, Coinbase, Kraken. But you'll have to find a reliable broker and create an account first. You can trade ARKM right from TradingView charts — just choose a broker and connect to your account.
Crypto markets are famous for their volatility, so one should study all the available stats before adding crypto assets to their portfolio. Very often it's technical analysis that comes in handy. We prepared technical ratings for ARKHAM / USDT (ARKM): today its technical analysis shows the buy signal, and according to the 1 week rating ARKM shows the neutral signal. And you'd better dig deeper and study 1 month rating too — it's sell. Find inspiration in ARKHAM / USDT trading ideas and keep track of what's moving crypto markets with our crypto news feed.
ARKHAM / USDT (ARKM) is just as reliable as any other crypto asset — this corner of the world market is highly volatile. Today, for instance, ARKHAM / USDT is estimated as 9.87% volatile. The only thing it means is that you must prepare and examine all available information before making a decision. And if you're not sure about ARKHAM / USDT, you can find more inspiration in our curated watchlists.
You can discuss ARKHAM / USDT (ARKM) with other users in our public chats, Minds or in the comments to Ideas.