ARK - a POIHere a POI (yellow mark) for possible Short.
There are good confluences there. 2X Fib and loc-D.
Previously those levels ( loc D and POC) gave us nice Long and Short opportunities.
Here a higher TF :
Follow for more ideas/Signals.💲
Check out my previous TA/Signals which played out nicely. :)
Just

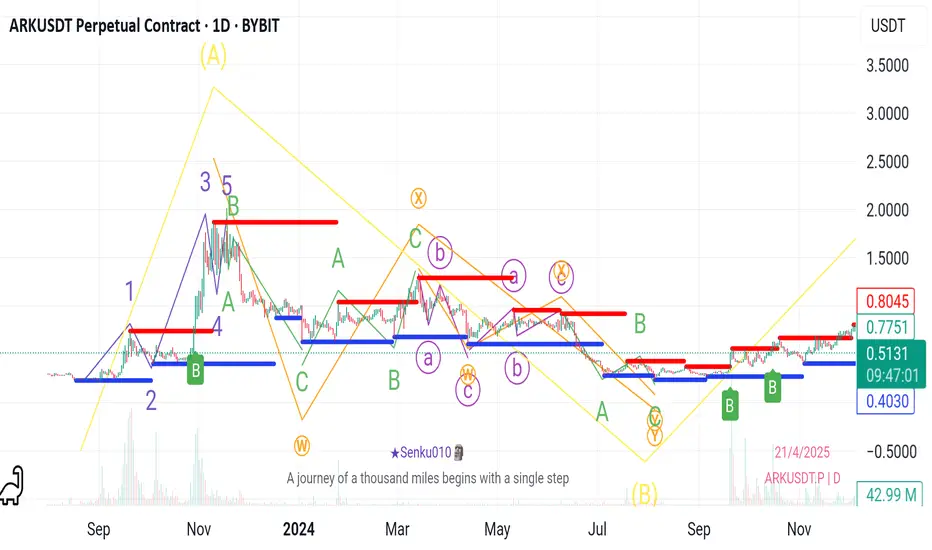
ARKUSDT - Daily Chart - Elliott Wave AnalysisHere's my refined Elliott Wave count for ARKUSDT, offering a potential roadmap for future price action.
Big Wave A: Completed Bullish Impulse
I've identified a clear five-wave impulse (1-2-3-4-5) that appears to have concluded a significant upward move. The sub-wave analysis shows:
Wave 2: A heal
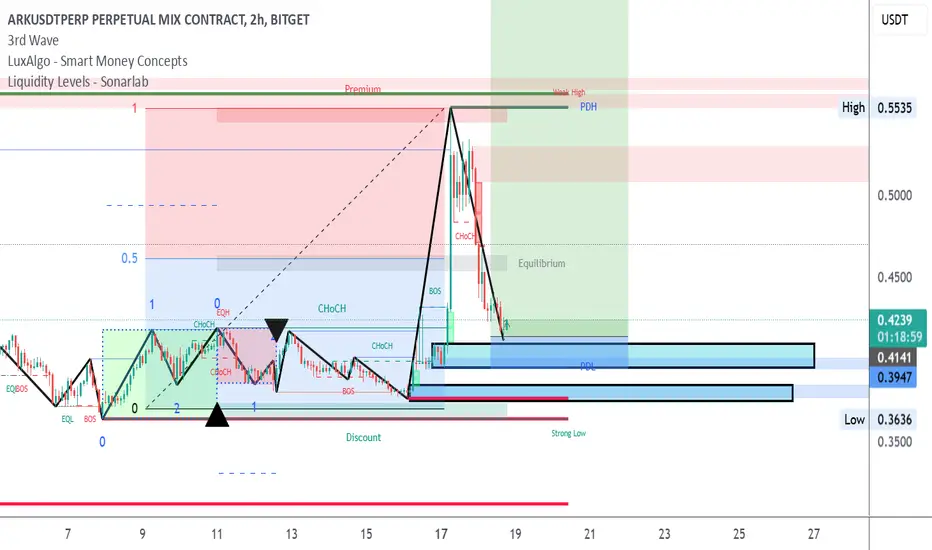
Trade Setup: ARK/USDT SHORT🟡 Market Outlook:
Expecting a rejection from the current buy zone due to strong support in that area.
⸻⸻⸻⸻⸻⸻⸻
🔹 Trade Details
• 🔽 Position: Short
• 📍 Entry: 0.5391
• 🎯 Targets:
• TP1: 0.5162
• TP2: 0.4747
• TP3: 0.4246
• 🛑 Stop Loss: 0.5592
⸻⸻⸻⸻⸻⸻⸻
🔁 Risk management is key – adjust pos

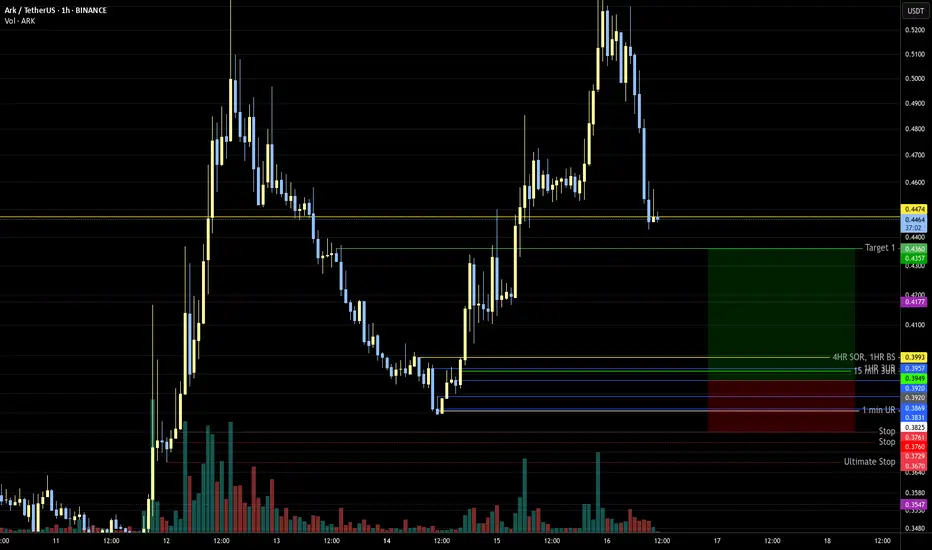
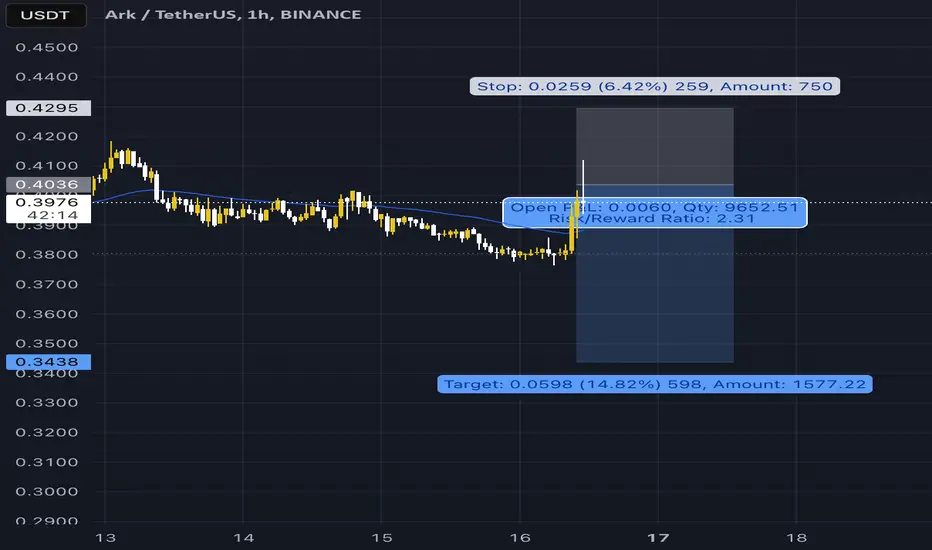
2.7 RR tradeLooks like has strong support at the indicated range. Target will change based on price action which has elapsed by the time the entry is hit.
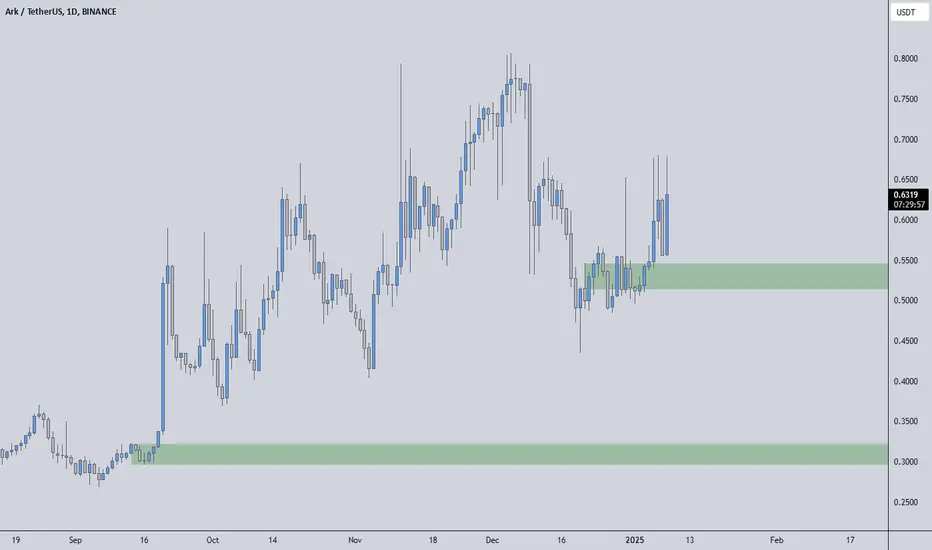
ARKUSDT(Ark) Updated till 17-02-25ARKUSDT(Ark) Daily timeframe range. for low volume and retail interest from this kind of alt very easy to find good R:R setups for day traders. failed to close above 0.5587 will push the price down to 0.3636. it will retrace back if stays above 0.5587.

ARKUSDT: A Green Beacon in a Red Sea? ARKUSDT: A Green Beacon in a Red Sea? 💹
While everything else seems to be sinking, ARKUSDT stands a chance to stay green. However, let’s not get overly optimistic just yet. The green box below is a potentially safer entry zone , depending on market conditions.
Here’s the game plan:
Green
ARKUSDT CHART ANALYSİS - EDUCATİONAL POSTMachine Learning for Algorithmic Trading: Predictive models to extract signals from market and alternative data for systematic trading strategies with Python by Stefan Jansen (Packt Publishing)
Although the book's title might be a mouthful, which is fairly common for books on algorithmic trading (

ARKUSDT SHORT !!!!!#ARK/USDT
Entry zone : 0.413751 - 0.4033068
Targets : 0.3996714 - 0.3915972 - 0.3835230 - 0.3754489 - 0.3673747 - 0.3593005 - 0.3512263 - 0.3431522
Stop loss :0.429819
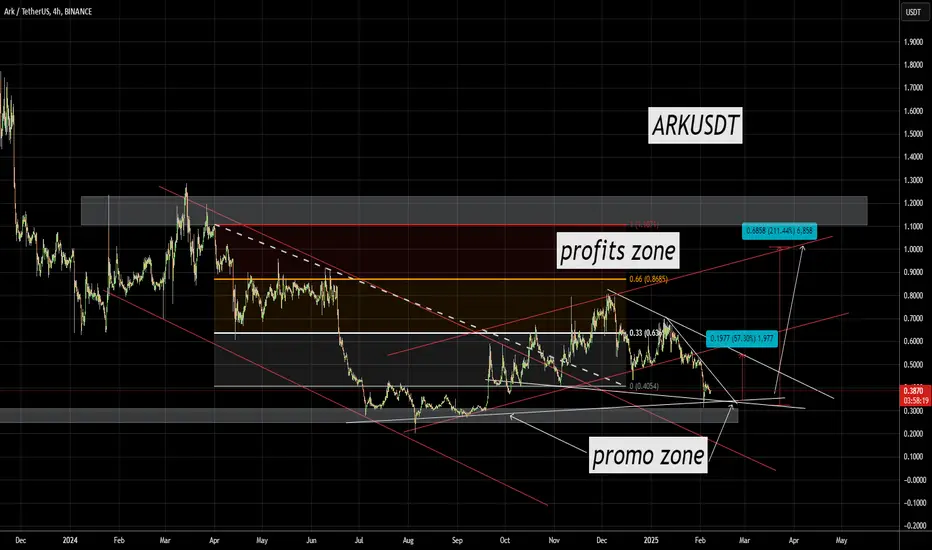
TRADE PLAN FOR ARK FOR PROFITSHello guys, Another trade plan setup for ARK for profits , long term hold.
All setups are shown on the chart for easy understanding.
Tradehubng
See all ideas
Summarizing what the indicators are suggesting.
Oscillators
Neutral
SellBuy
Strong sellStrong buy
Strong sellSellNeutralBuyStrong buy
Oscillators
Neutral
SellBuy
Strong sellStrong buy
Strong sellSellNeutralBuyStrong buy
Summary
Neutral
SellBuy
Strong sellStrong buy
Strong sellSellNeutralBuyStrong buy
Summary
Neutral
SellBuy
Strong sellStrong buy
Strong sellSellNeutralBuyStrong buy
Summary
Neutral
SellBuy
Strong sellStrong buy
Strong sellSellNeutralBuyStrong buy
Moving Averages
Neutral
SellBuy
Strong sellStrong buy
Strong sellSellNeutralBuyStrong buy
Moving Averages
Neutral
SellBuy
Strong sellStrong buy
Strong sellSellNeutralBuyStrong buy
Displays a symbol's price movements over previous years to identify recurring trends.