ARPAUSDT.P LONGLet it break out from the channel and the retest with bullish candlesticks we can enter long the setup has been marked
DYOR

ARPAUSDT: A Resilient Asset Amidst Market UncertaintyAmidst the current market's discernible weakness, where many altcoins experience a decline, a close examination of ARPAUSDT reveals characteristics that suggest it is not merely another asset in freefall. Indeed, it presents as a potentially more resilient area within this volatile landscape.
While
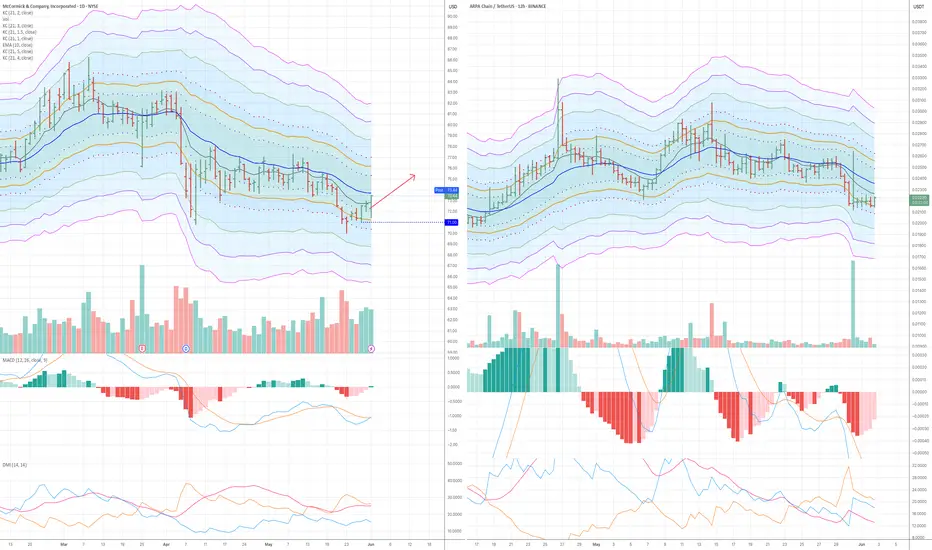
Bullish divergence on MKC Daily
Bullish div on ME, mLines, ATR channels and slightly on sRSI
Impuls on factor 5 TF is red, but EFI is turning from an extreme level and factor 3 is blue impulse
E: 72,73
TP: 75,43
SL: 70,86
RR: 1:1.44
Trade #00012
Note:
I posted this when price was 72.45, at market open, but I could not
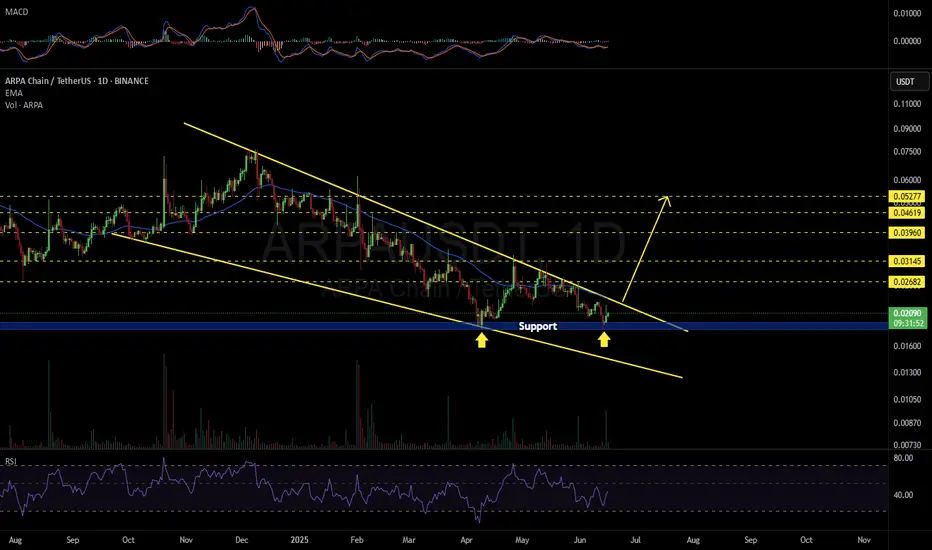
ARPAUSDT 1D#ARPA is moving inside a Falling Wedge pattern on the daily chart — a classic bullish reversal signal.
If the price breaks above the wedge resistance and the daily EMA50, the following targets come into play:
🎯 $0.02682
🎯 $0.03145
🎯 $0.03960
🎯 $0.04619
🎯 $0.05277
⚠️ Always use a tight stop-loss t
ARPAUSDT Forming Falling WedgeARPAUSDT is currently presenting a classic falling wedge pattern, which is widely recognized as a bullish reversal formation in technical analysis. This setup suggests that the recent downtrend may be losing momentum, with lower highs and lower lows converging toward a breakout point. The narrowing

ARPA ARPA has been consolidating now for 4 years. Bullish divergence on the HTF chart so yes it may come down a bit but am very bullish long term ...heres why

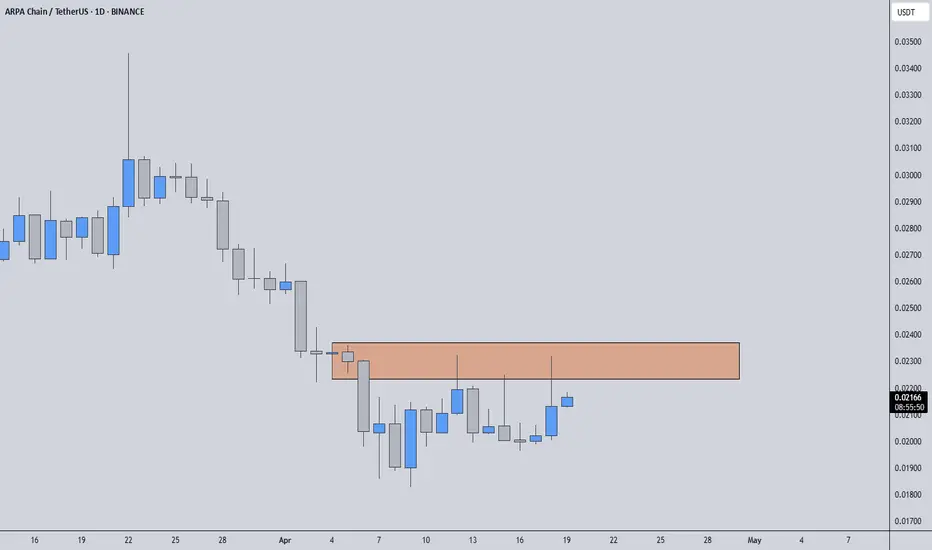
ARPAUSDT | The Whales Are Quiet, But I'm Watching Them CloselyARPAUSDT has been on my radar for a long time. What makes this coin special isn’t just the price movement, it’s who’s behind it. Every dip so far has been met with strategic buying.
🟧 Orange Box: Key Opportunity Zone
This orange box could act as a launchpad. If we break above it and receive a clea
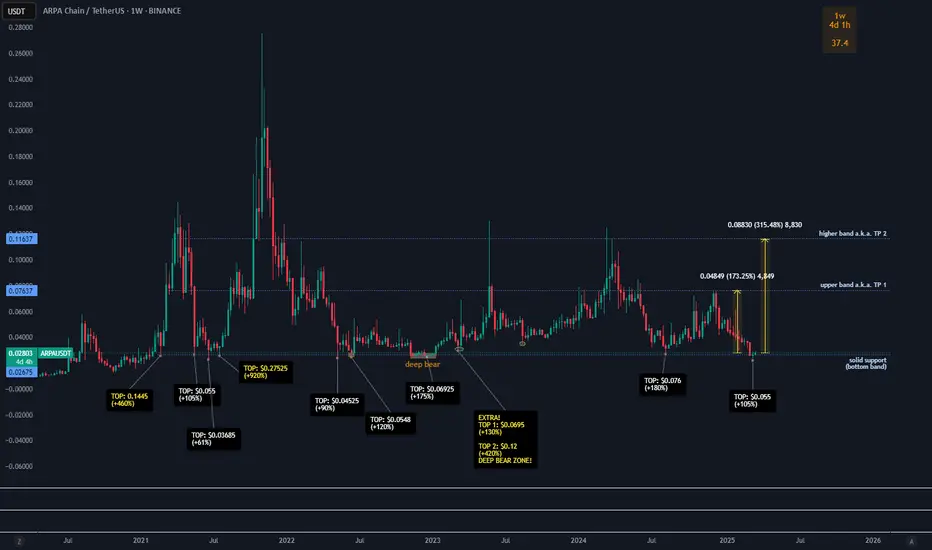
ARPAUSDT 1WARPA ~ 1W Analysis
#ARPA High risk trade. Buy gradually from here if you still have a Conviction on this coin with a short -term target of at least 15%+.
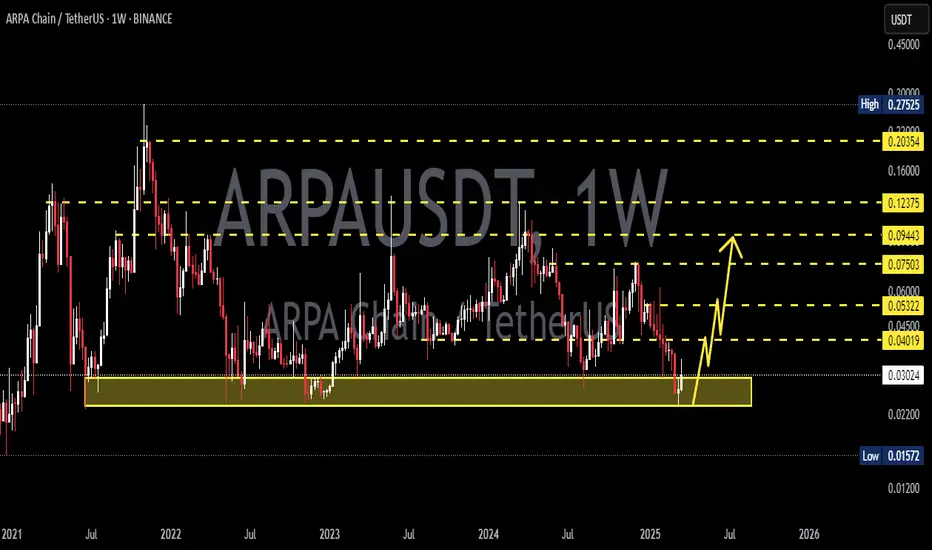
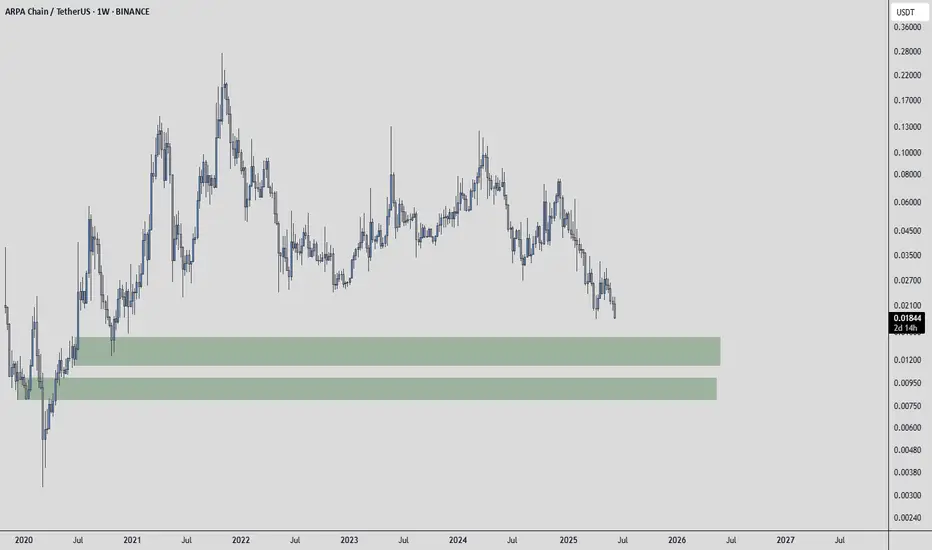
ARPA PRICE RANGESince 2021 ARPA's chart moves within very clear range.
Current price allows to set two mid-term targets.
We are at the lower band of the channel, which historically, gave a few reasons to consider recent prices.
Plan couldn't be easier, with clear invalidation.
No reason not to range at this level
ARPAUSDT 1WARPA ~ 1W Analysis
#ARPA So far it still maintains this block of support. Buy gradually from here with a minimum target of 20%+

See all ideas
Summarizing what the indicators are suggesting.
Oscillators
Neutral
SellBuy
Strong sellStrong buy
Strong sellSellNeutralBuyStrong buy
Oscillators
Neutral
SellBuy
Strong sellStrong buy
Strong sellSellNeutralBuyStrong buy
Summary
Neutral
SellBuy
Strong sellStrong buy
Strong sellSellNeutralBuyStrong buy
Summary
Neutral
SellBuy
Strong sellStrong buy
Strong sellSellNeutralBuyStrong buy
Summary
Neutral
SellBuy
Strong sellStrong buy
Strong sellSellNeutralBuyStrong buy
Moving Averages
Neutral
SellBuy
Strong sellStrong buy
Strong sellSellNeutralBuyStrong buy
Moving Averages
Neutral
SellBuy
Strong sellStrong buy
Strong sellSellNeutralBuyStrong buy
Displays a symbol's price movements over previous years to identify recurring trends.