AR 1H. $5.90 Is the Last Line of Defense. 06/15/25BINANCE:ARUSDT If we fail to hold the $5.90 level, this asset could crash hard — potentially entering a deeper downtrend.
DYOR.
ARUSDT.P trade ideas

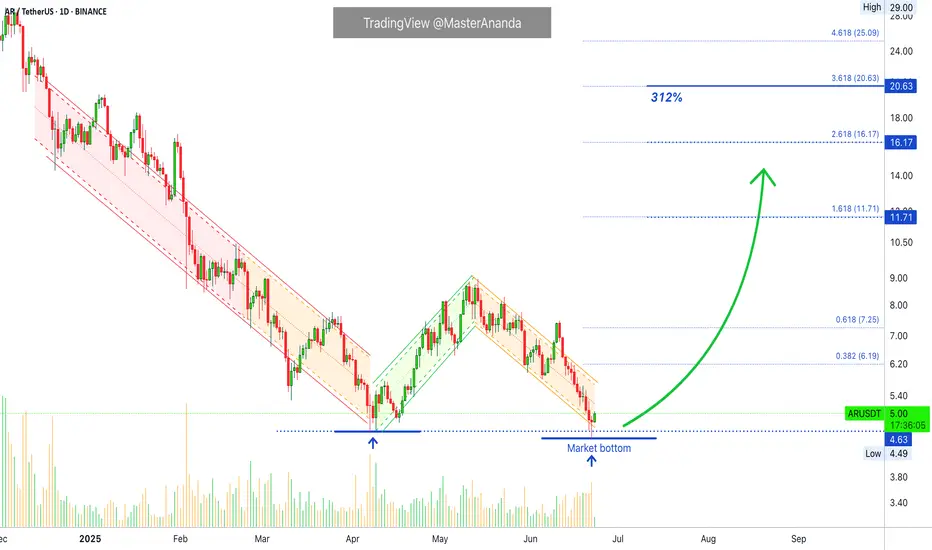
Arweave—Bullish Bias Confirmed (Altcoins Bull Market As Promise)Three weeks ago I told you a very strong bullish wave was approaching the altcoins market. It is here, confirmed. The rest is just too easy...
Tell me... Can you see this?
Tell me you can see this. I know you can.
Tell me you can see the end of a correction, the bearish wave.
On the 5th of June the market was supposed to move up. It started up and went up for five days. 11-June produced a major crash rather than a bullish continuation... Surprise! but the market never moves straight down, this was the final leg down; the bottom is in, we can change trend now.
Technically speaking, the 7-April bottom-low holds. We have a double-bottom situation.
The low in April led to growth. This time around we have a slightly lower low with a bullish signal coming from the last candle that closed, a reversal candle. We also have a bullish chart pattern and marketwide action; it is very early of course. I am always early because I look 24-7 at the charts.
We have first a bottom and then a double-bottom after a little more than two months. This is it. Bear volume continues to drop and has been dropping since late 2024. This means that the bearish force has been exhausted, fully exhausted. Even the latest low yesterday has lower volume than the previous lows.
This is it. The bullish bias is now fully confirmed.
We won't have to wait long. It will be clear based on price action.
Thanks a lot for your continued support.
Namaste.
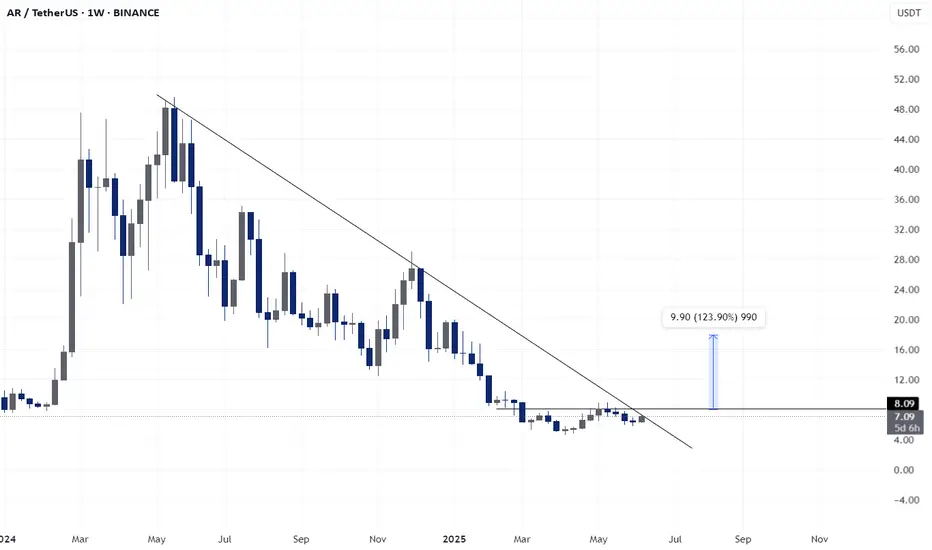
AR - Super Bullish LONG SET-UPBINANCE:ARUSDT
2️⃣ 𝐀𝐑/𝐔𝐒𝐃𝐓
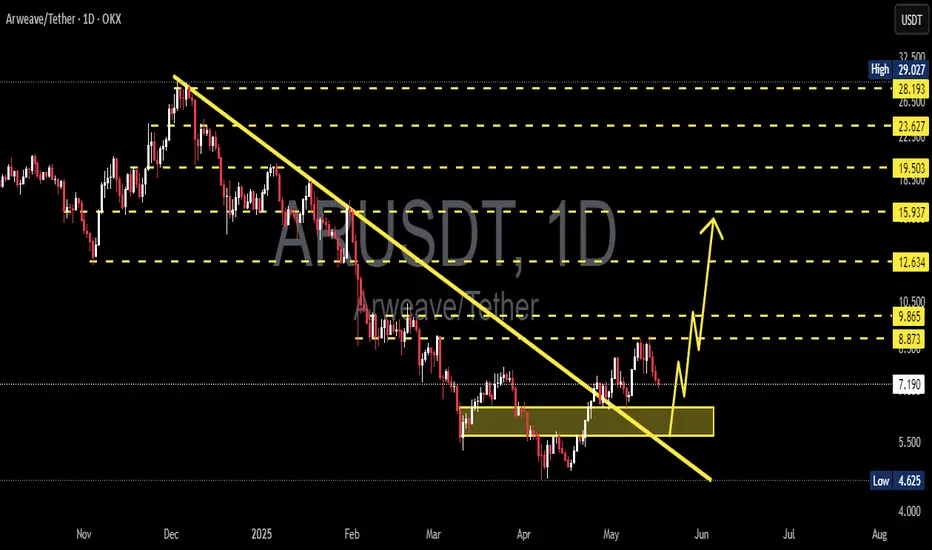
AR is flirting with a trendline breakout after a long downtrend. A clean move above could ignite a rally toward $16, eyeing a sharp 123% upside. Setup looks primed
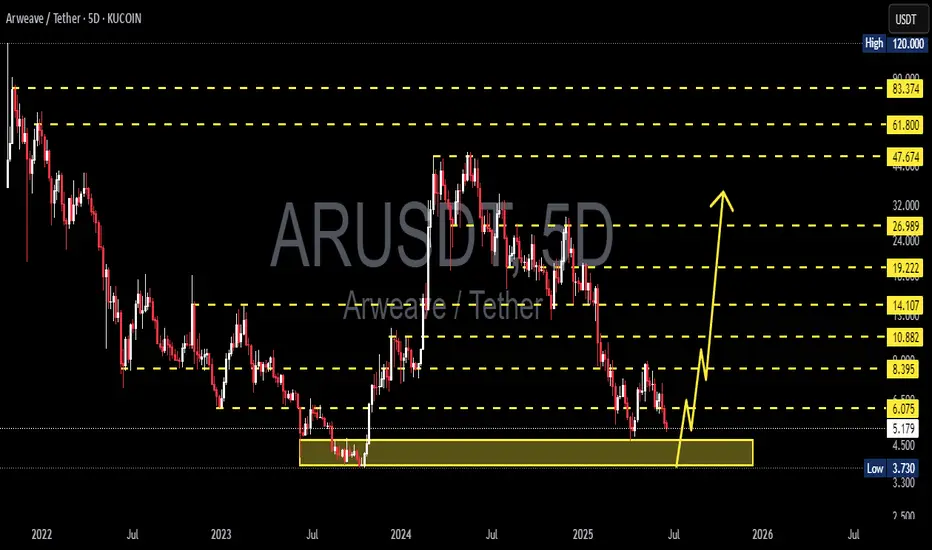
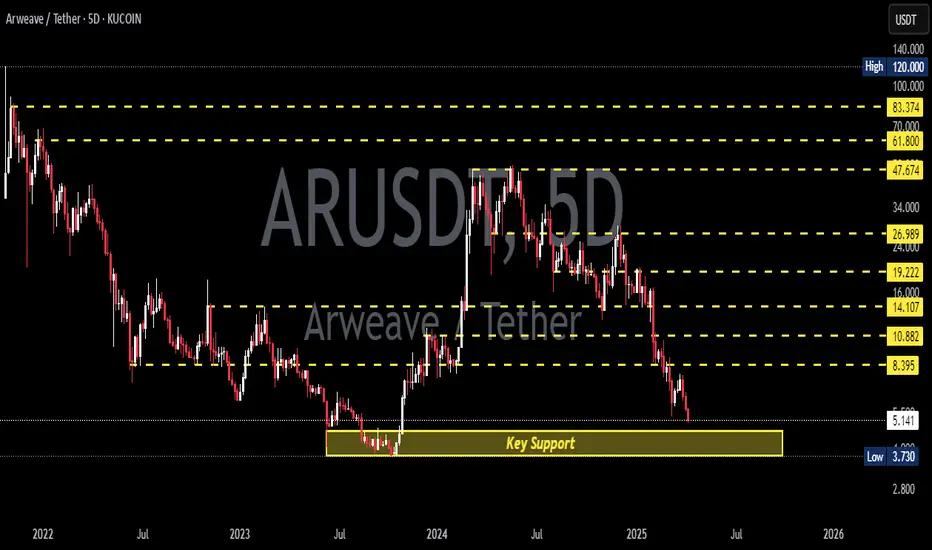
ARUSDT 5D AnalysisAR ~ 5D Analysis
#AR This is the lowest support for now. Buy back from here with a short term target of at least 15%++ from this support.
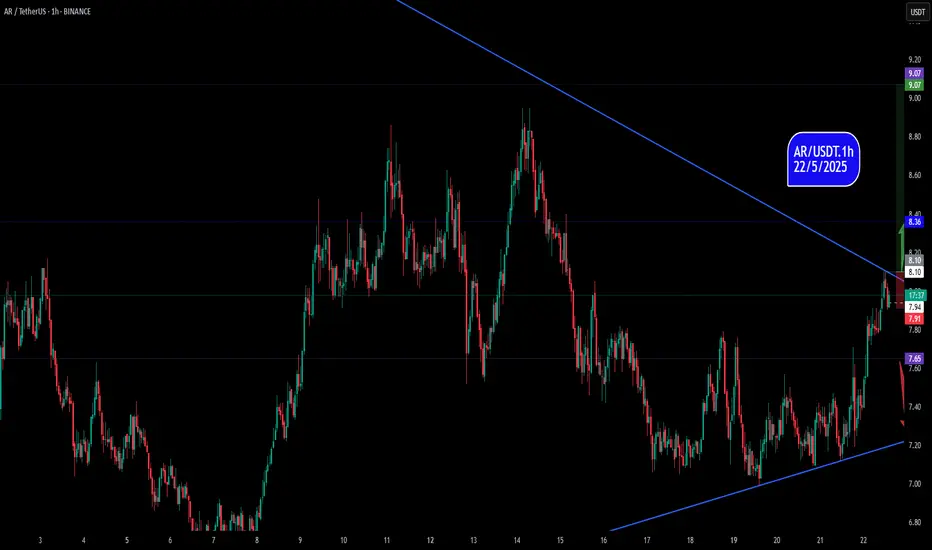
AR/USDTAR/USDT analysis on the hourly time frame. The analysis is based on trend analysis, support and resistance. The expected outcome is an upward trend.
ARUSDT 1D AnalysisAR ~ 1D Analysis
#AR Buy on retest of this support block with short term target of at least 10%+ from here.
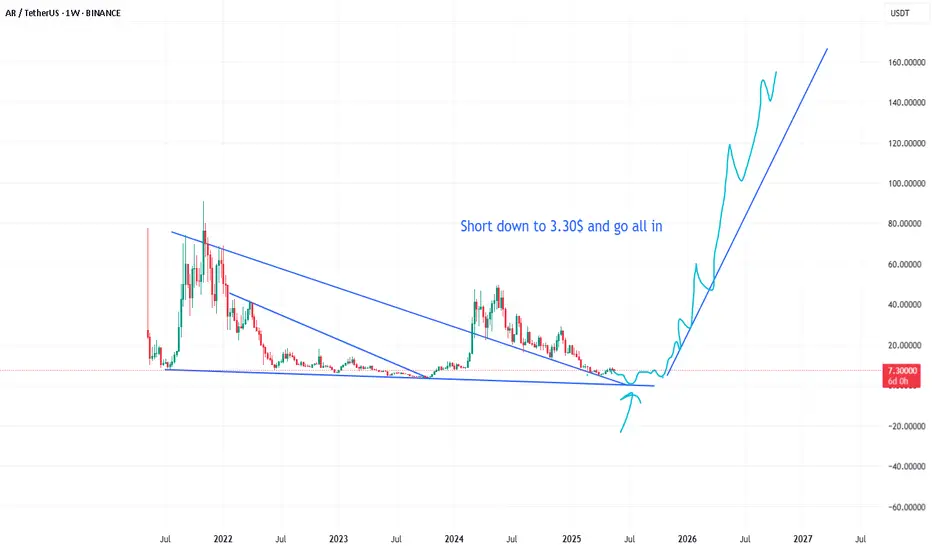
But that is exactly what you need to start long of your life. Entry:
Futures:
2.90$ Long 50x
3.60$ Long 5x
4$ Long 2x
Spot entry:
3$
4$
5$
Target 80$,100$,300$,600$
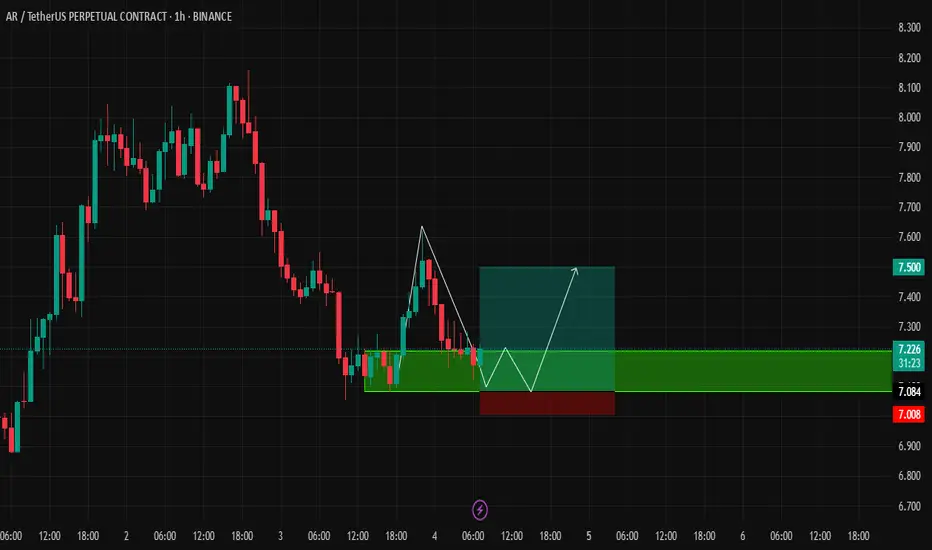
AR USDT Looking Bullish
Possible Entrr IN GREEN ORDER BLOCK
USE PLEASE MAXIMUM 10% FROM YOUR CAPITALS
LEVERAGE 20X
MUST USE TP AND SL !
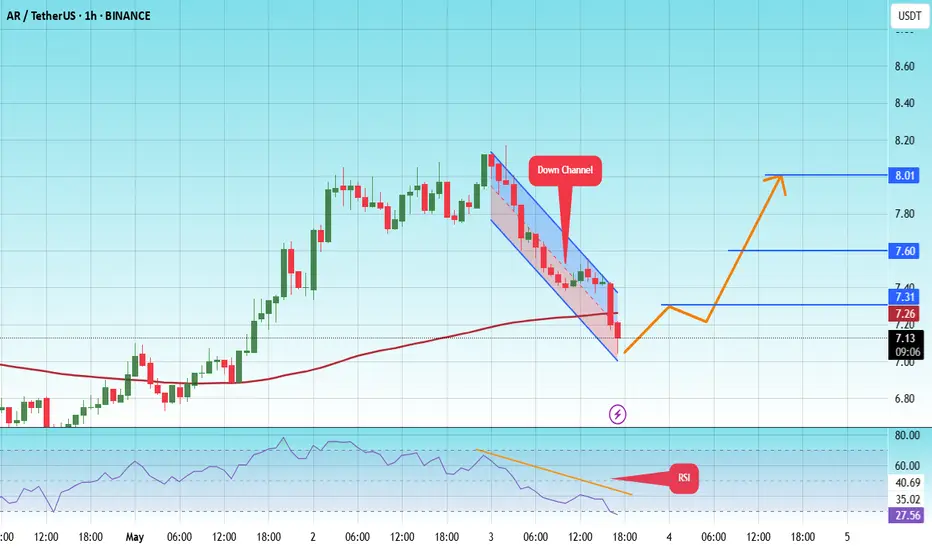
#AR/USDT#AR
The price is moving within a descending channel on the 1-hour frame and is expected to break and continue upward.
We have a trend to stabilize above the 100 moving average once again.
We have a downtrend on the RSI indicator that supports the upward move with a breakout.
We have a support area at the lower boundary of the channel at 7.00, which acts as strong support from which the price can rebound.
Entry price: 7.14
First target: 7.30
Second target: 7.60
Third target: 8.00
Arweave ready for take-off?AR has yet to leave the station. With a nice volume gap above, it is possible to get some follow-through to the upside. Momentum is almost overbought, and the trend is in the bullish control zone.
Full TA: Link in the Bio
AR/USDT : FREE SIGNALHello friends✌
You see that after the price growth we had, we entered a correction, which provided us with a good opportunity to buy📈
We have identified the buying levels and targets for you to buy...
Don't forget capital management, friends.
*Trade safely with us*
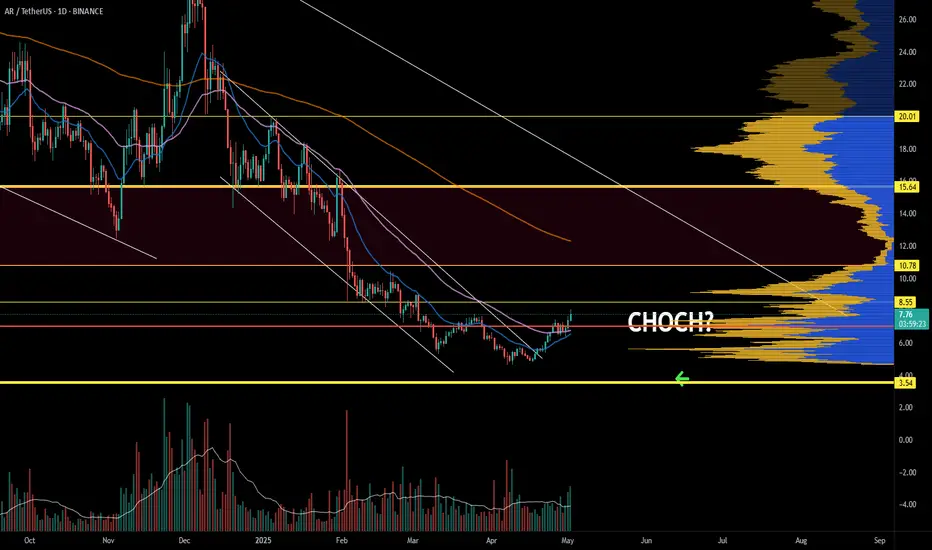
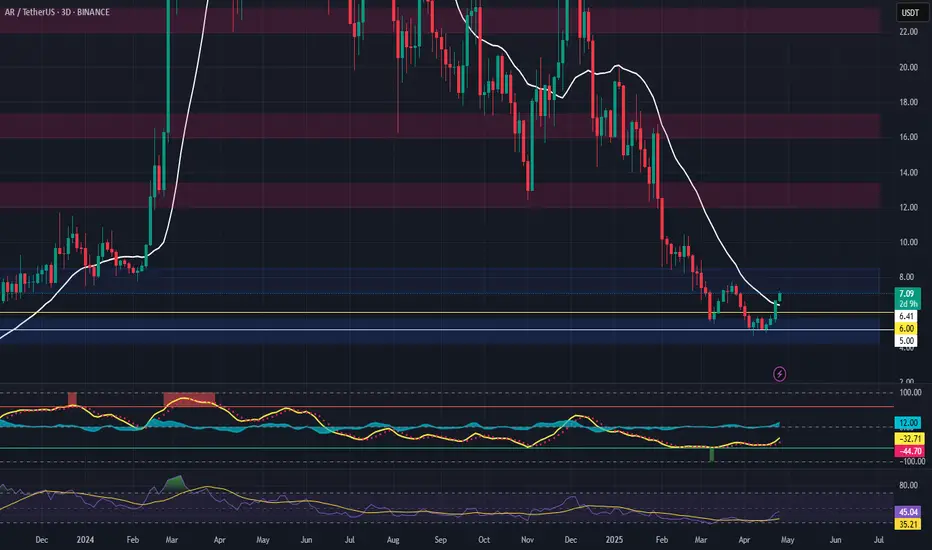
AR Trade Setup – Watching for Market Structure ShiftAR is showing early signs of strength after defending the $5 key level a crucial support that bulls needed to hold. Now, the focus is on a potential shift in market structure around $6, which could lead to a strong upside move.
📍 Entry Zone:
Enter around $6 after confirmation (e.g., reclaim with strong volume or bullish candle close)
🎯 Take Profit Targets:
🥇 $12
🥈 $16
🥉 $22
🛑 Stop Loss:
Below $5
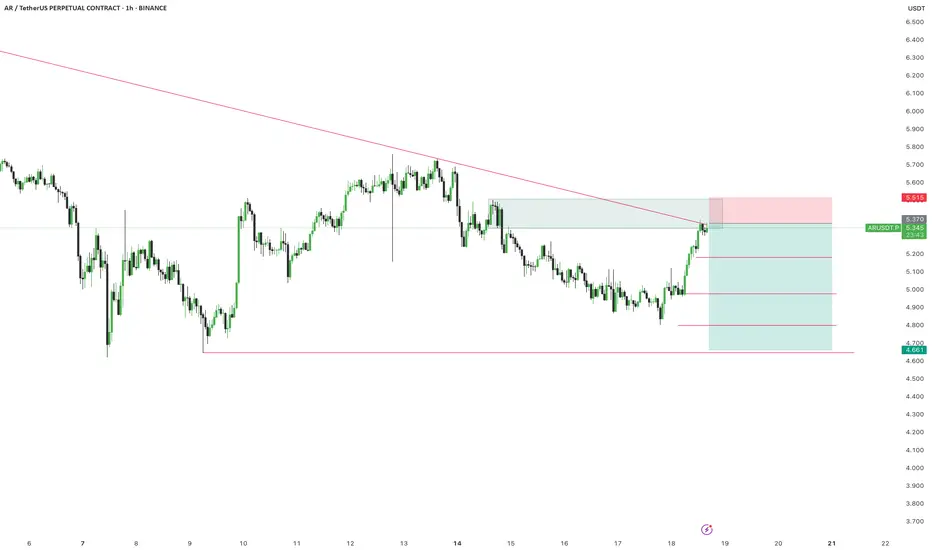
AR SHORT🟡 Market Outlook:
Expecting a rejection from the current buy zone due to strong resistance in that area.
🔹 Trade Details
• 🔽 Position: Short
• 📍 Entry: 5.370
• 🎯 Targets:
• TP1: 5.181
• TP2: 4.98
• TP3: 4.81
• 🛑 Stop Loss: 4.66
⸻
🔁 Risk management is key – adjust position size accordingly.
💬 Feel free to share your thoughts or ask questions.
⸻
🧠 Enhance. Trade. Grow.
📢 Like & follow CIDA Signals for more premium trade ideas and market insights.
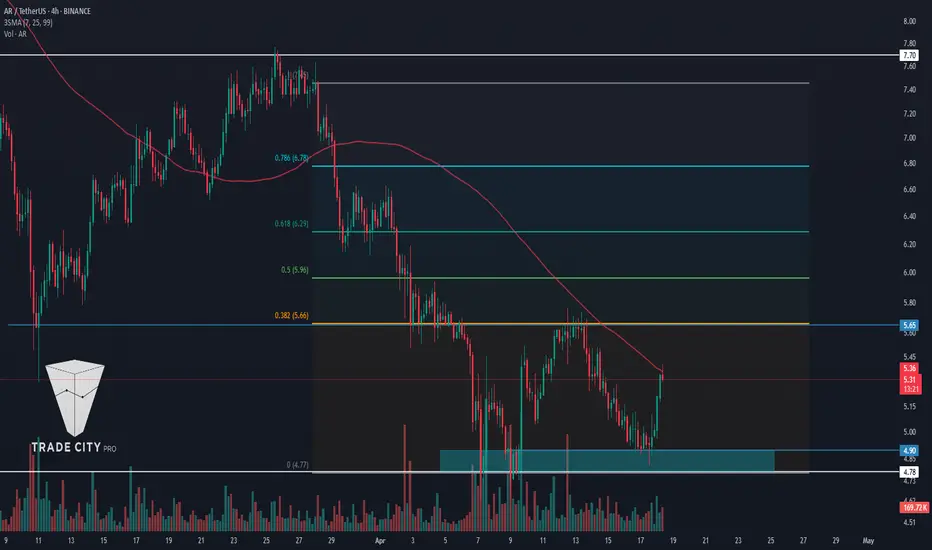
TradeCityPro | AR: Key Triggers in Web3 Storage Coin’s Downtrend👋 Welcome to TradeCity Pro!
In this analysis, I want to review the AR coin for you. This project is one of the Storage and Web3 platforms, and the coin of this project, with a market cap of $352 million, is ranked 124th on CoinMarketCap.
⏳ 4-Hour Time Frame
In the 4-hour time frame, as you can see, this coin is in a downtrend, and in its latest leg, after being rejected from the 7.70 top, it started to drop, and this decline continued down to the 4.78 zone.
✔️ Currently, the price has retraced to the 0.382 Fibonacci level and has created a range box between 4.78 and 5.65. A break of this box can determine the trend of this coin for the coming days or even weeks.
✨ The SMA99 indicator has so far acted well as a dynamic resistance, and within the current box, the price has already reacted to it once and is now again pulling back to this moving average.
💥 If the price is rejected from this indicator and forms a lower high than 5.65, the probability of breaking the 4.78 bottom increases significantly, and the price could move toward lower lows.
⚡️ The 4.78 support is actually a support range between 4.78 and 4.92, and to confirm a bearish move, the risky trigger is 4.92, and the main trigger is 4.78.
🔼 For a long position or spot buy, we should first wait for the SMA99 to break and for the 5.65 zone to activate. The break of this zone would be the first confirmation of a trend reversal, and the main confirmation would come after the price makes a higher low and higher high above the 5.65 zone.
🎲 The main resistance levels above this area are the 0.5, 0.618, and 0.786 Fibonacci levels. Another key resistance is the 7.70 zone.
📝 Final Thoughts
This analysis reflects our opinions and is not financial advice.
Share your thoughts in the comments, and don’t forget to share this analysis with your friends! ❤️
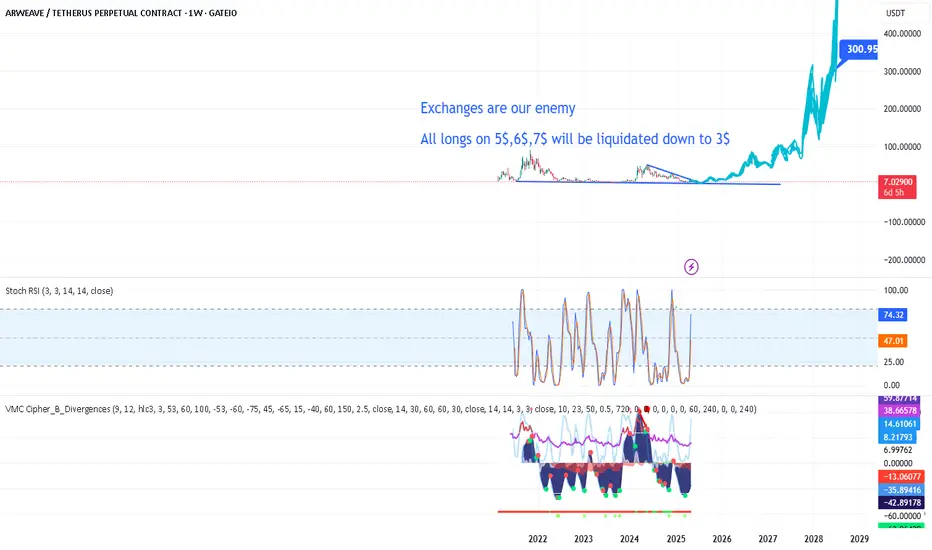
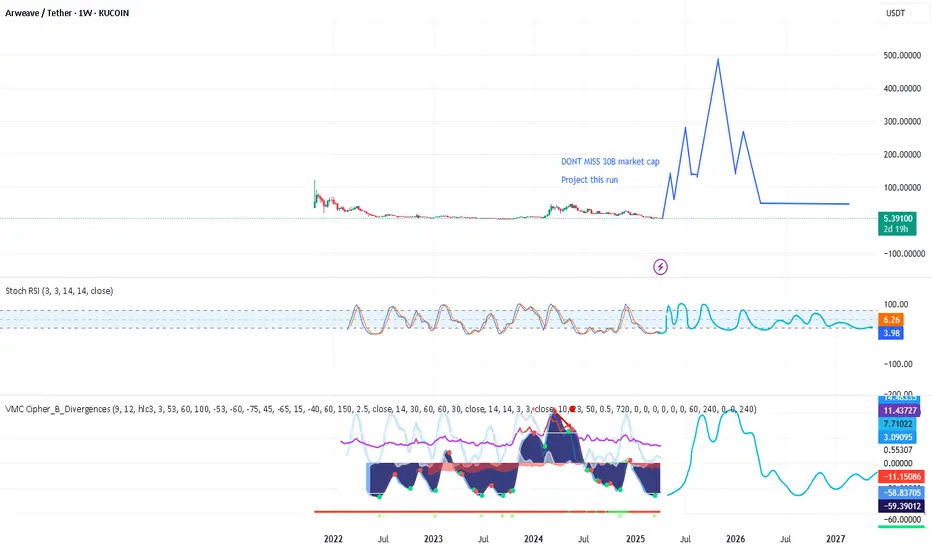
M2 Supply is going up - that means only one thing INSANE RUNS!Does this coin belongs to be among top 10-40 Altcoins - DEFINITELY YES!
Last supply take over is happening next 7-15 days.
SPOT AR LONG 12.04.2025Pinning after exhaustion of sales.
💰I enter at the market price.
I'll let you know when I record it manually.
‼️Risk per trade: 0.5% of the allocated funds for spot trading.
Thank you!

No brainer - best project out First target - 150$
Second target - 300$
Third target - 500$
Wild target - 658$
ARUSDT 5DAR ~ 5D Analysis
#AR Buy back while visiting this support with a short -term target of at least 15%+.
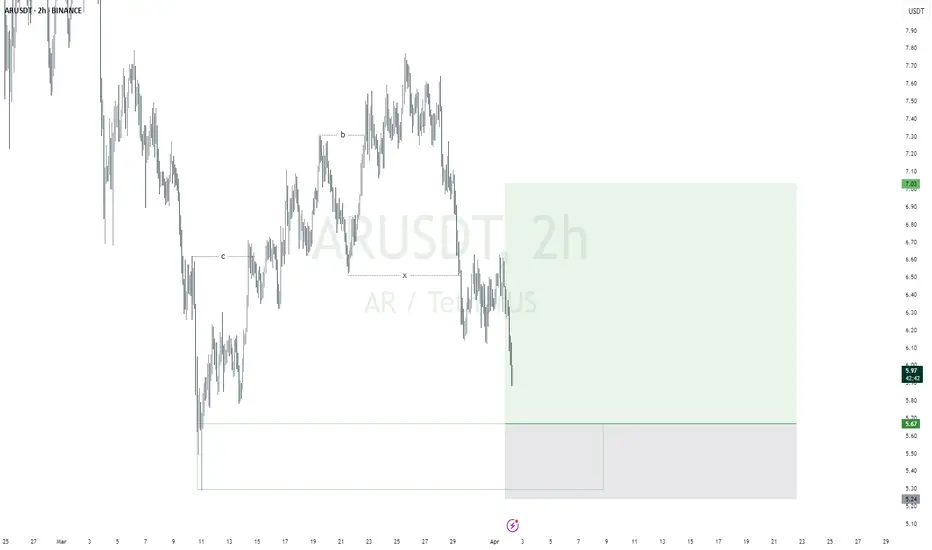
ARUSDTmy entry on this trade idea is taken from a point of interest below an inducement (X).. I extended my stoploss area to cover for the whole swing as price can target the liquidity there before going as I anticipate.. just a trade idea, not financial advise
Entry; $5.67
Take Profit; $7.03
Stop Loss; $5.24
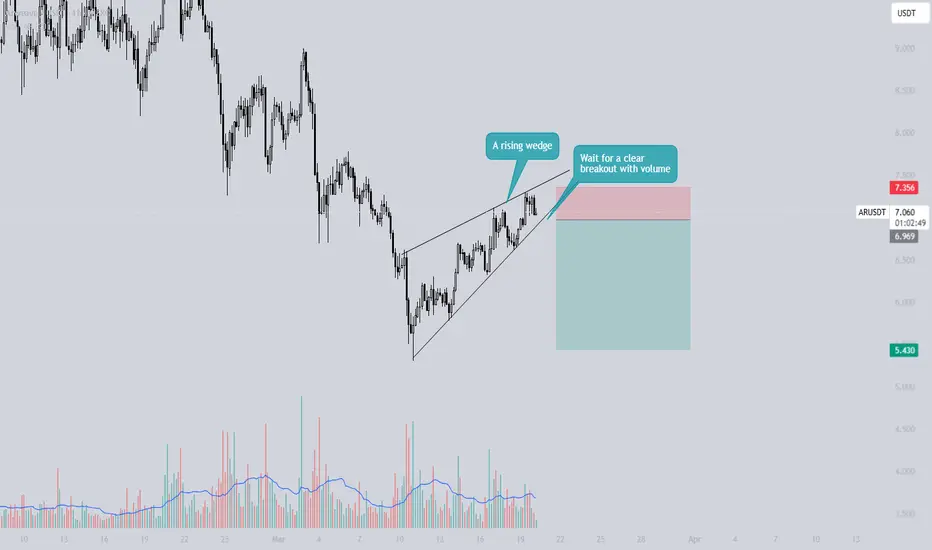
What is a Rising Wedge? - Opportunities on GALA and ARWEAVE!What is a rising wedge?
A rising wedge pattern is a bearish chart formation that signals either a potential trend reversal or the continuation of a downtrend. It occurs when the price consolidates within two upward-sloping, converging trendlines, indicating weakening momentum.
Key Characteristics of a Rising Wedge:
1. Higher Highs and Higher Lows – The price moves upward, but the momentum gradually weakens.
2. Converging Trendlines – Both the upper and lower trendlines slope upward while moving closer together, suggesting a loss of strength in the trend.
3. Breakout Direction – The pattern typically breaks below the lower trendline, confirming a bearish reversal.
How to Trade a Rising Wedge:
• Wait for Confirmation – A breakdown below the lower trendline with increased volume confirms the pattern.
• Set a Target – Measure the height of the wedge and project it downward, often aiming for the starting point of the wedge.
• Use a Stop-Loss – Place a stop-loss just above the recent swing high to manage risk.
Rising wedge on GALA and ARWEAVE
There will be some opportunities with the rising wedge pattern on GALA Games and ARWEAVE. With the projected downside move in BTC and ETH, these falling wedges could play out perfectly. The stop-losses are around 5%, so make sure to manage your risk accordingly.
Keep an eye on both setups for possible trade opportunities in the coming hours/days!
Thanks for your support.
- Make sure to follow me so you don't miss out on the next analysis!
- Drop a like and leave a comment!
Lets chat in the comment section. See you there :)
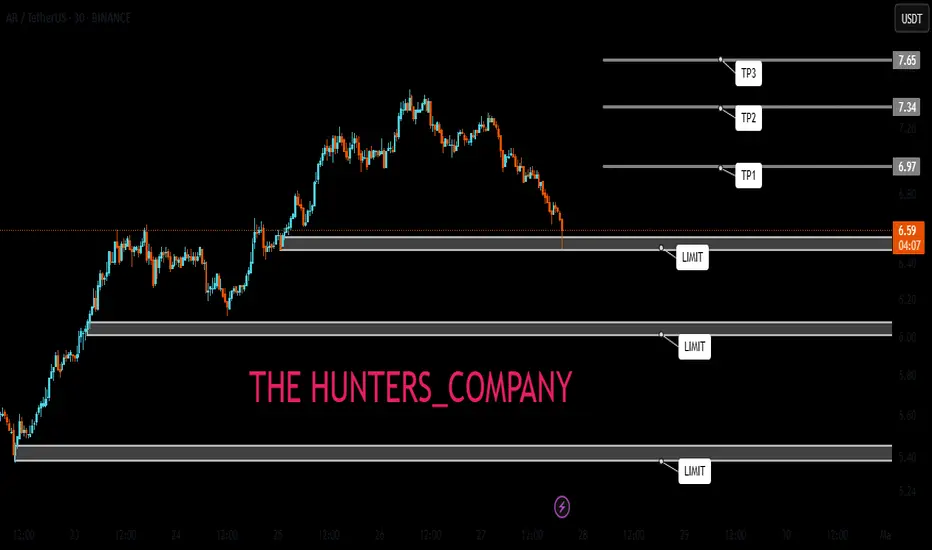
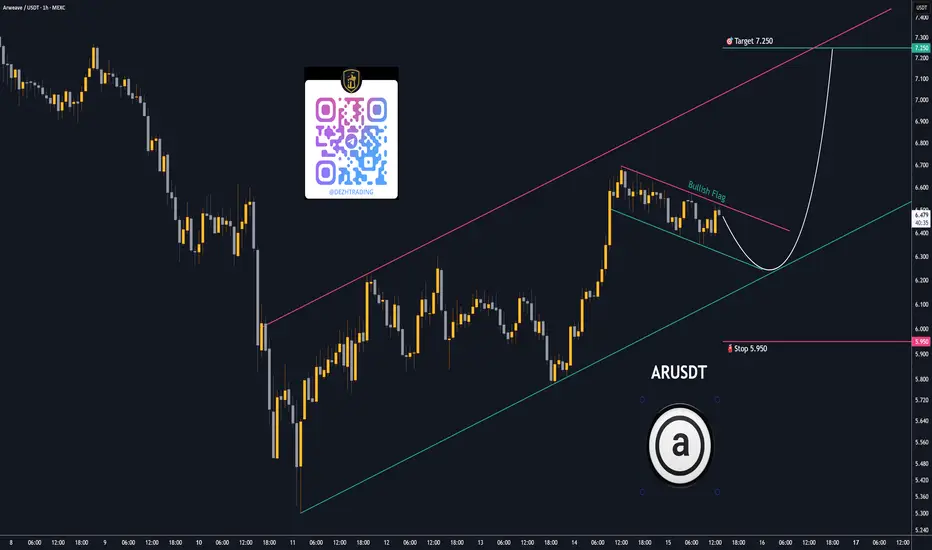
Trading opportunity for ARUSDTBased on technical factors there is a Buy position in :
📊 ARUSDT
🔵 Buy Now
🪫Stop loss 5.950
🔋Target 7.250
📏 R/R 1,5
💸RISK : 1%
We hope it is profitable for you ❤️
Please support our activity with your likes👍 and comments📝
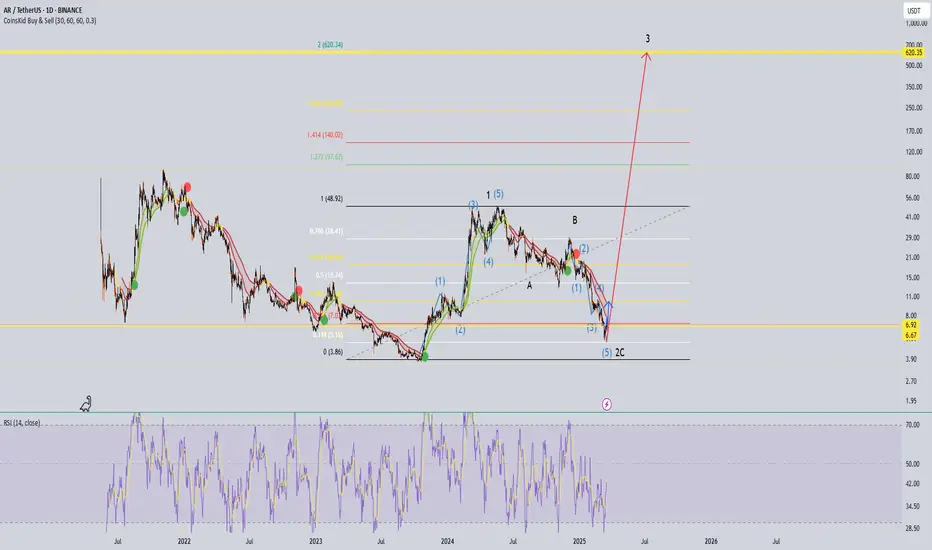
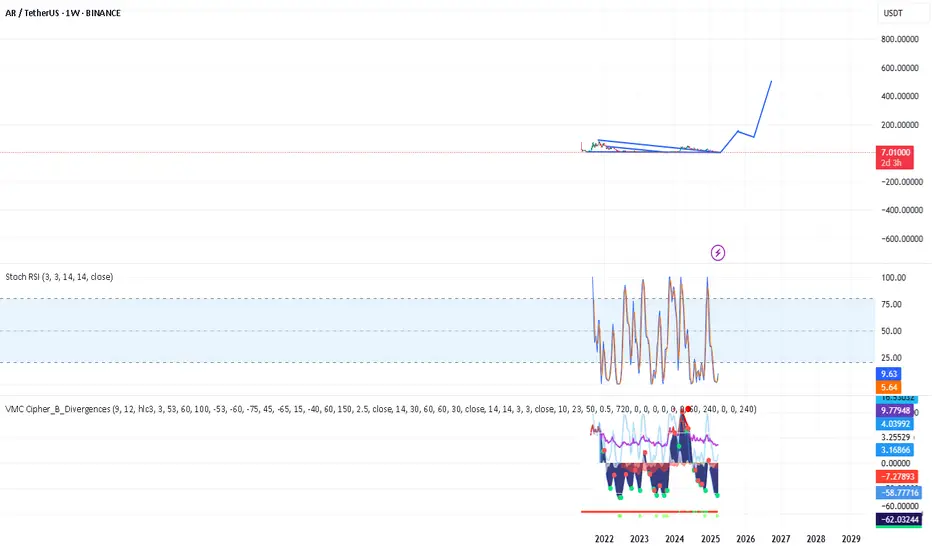
ARUSDT looks goodI was just scrolling true the charts and found this one. For the wave 1 we have a beautifull 5 waves up. Then a abc correction C might be finished becouse 5 waves down. Crazy target for the wave 3 to 620.