ARUSDT
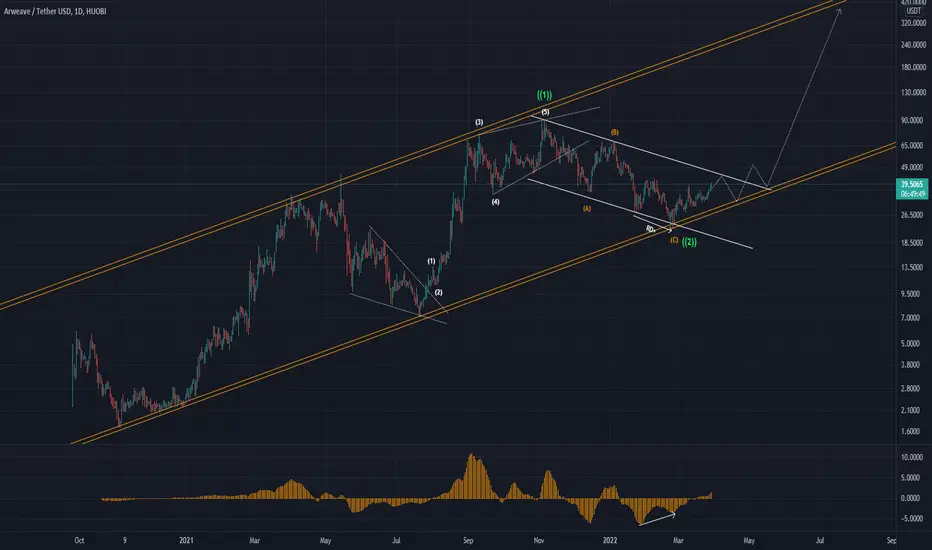
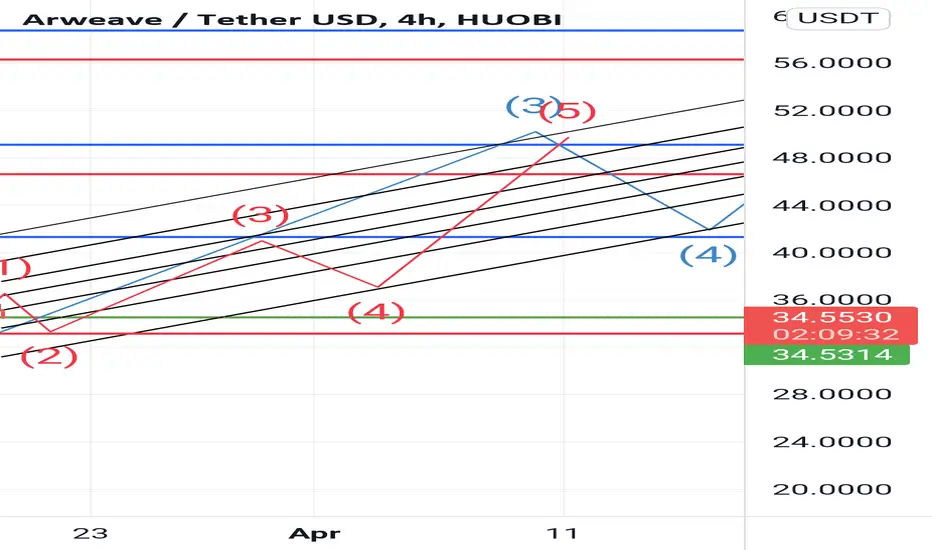
After completing 5 waves of its own (completing the main wave 1), it entered wave 2 (correcting three waves as a channel)
After the failure of the channel, wave 2 is confirmed and enters the main wave 3, which increases the price and only the previous ceiling.
We have the end of wave 2 positive divergence.
ARUSDT trade ideas

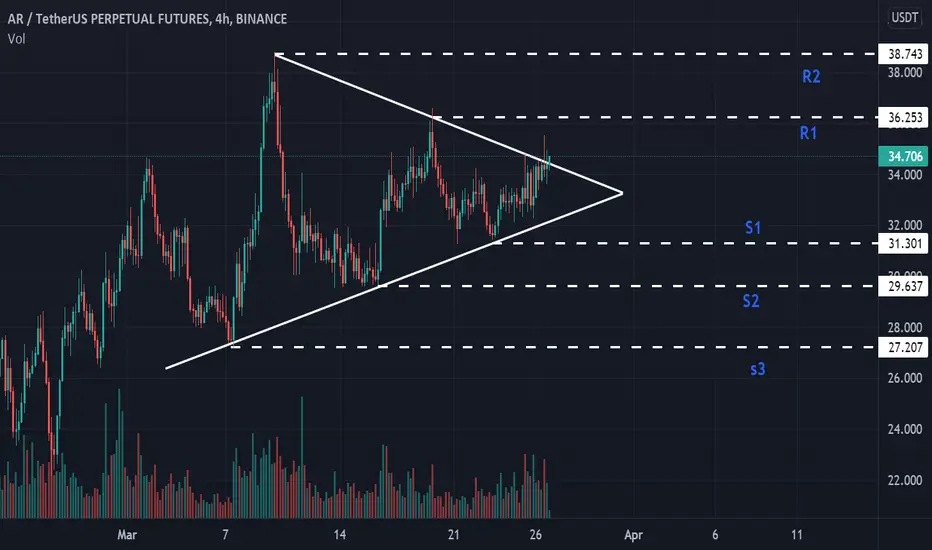
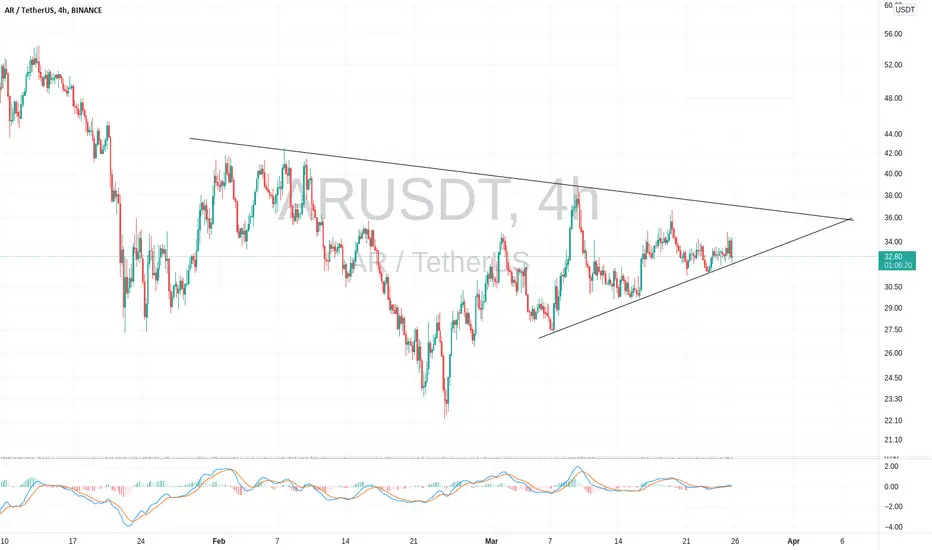
AR/USDT 4HAR/USDT 4hrs Don't have clear Breakouts and it forming Symmetric Triangle. When its Breakout with strong Candles and with Strong volume do Long or Short after breakout UP or DOWN with Given Targets.
Arweave ready for full send- absolutely crazy volatility squeeze; expansion around the corner
- with BTC confirming a bullish breakout above 45k it is likely most of the crypto market experiences short - mid term bullish behaviour

AR long term bullish Ar potential 53 rise great opportunity
.........................................................................
...................................................
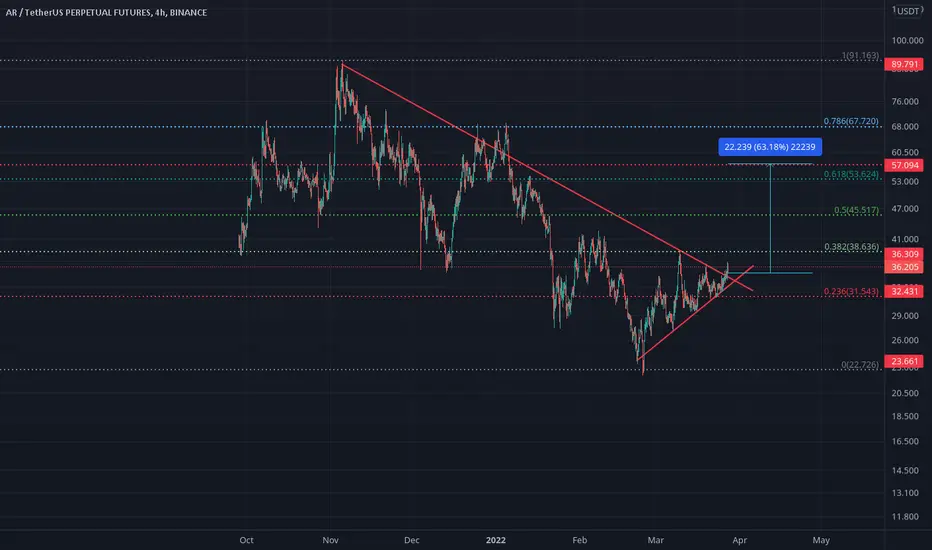

#ARA triangle has formed on the 4h timeframe. It can be taken with a small stop from the upper boundary.
Targets: 38 - 42 - 52.
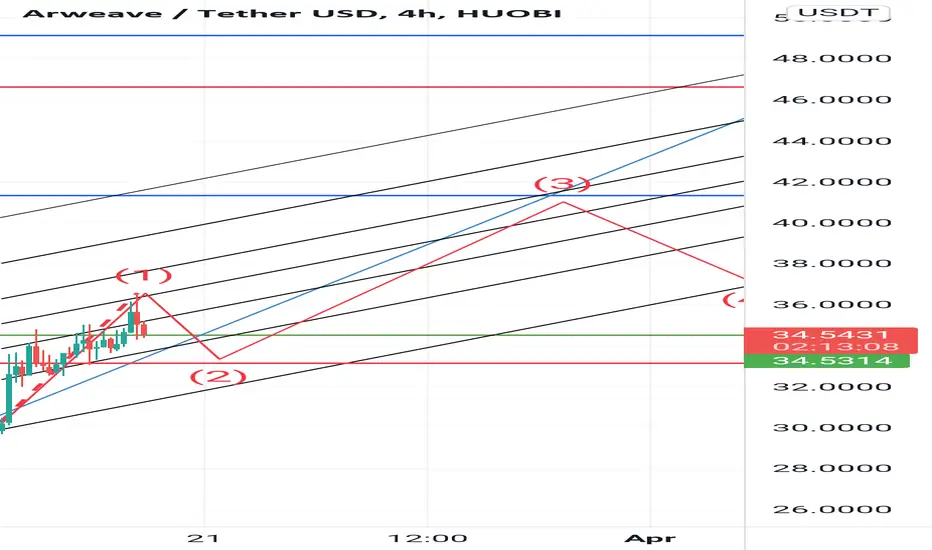
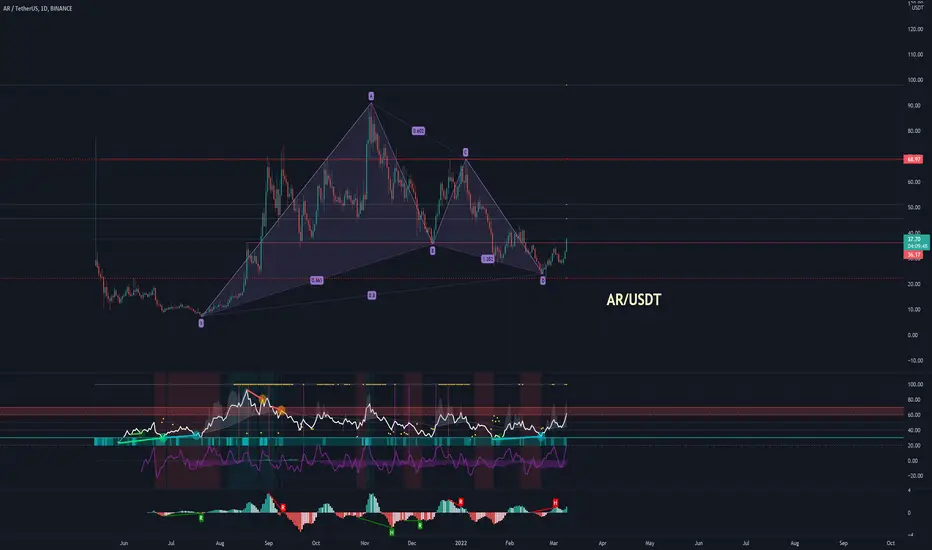
Elliott wave of ARUSDTwe start a new waves nad now we are at wave 2 and ready for 3rd waver for target 56 and 86 for 5 wave

Inverse H/S pattern A inverse H/S pattern forming?
What y’all think?…
Invalid if it makes a lower low. But price is still in range

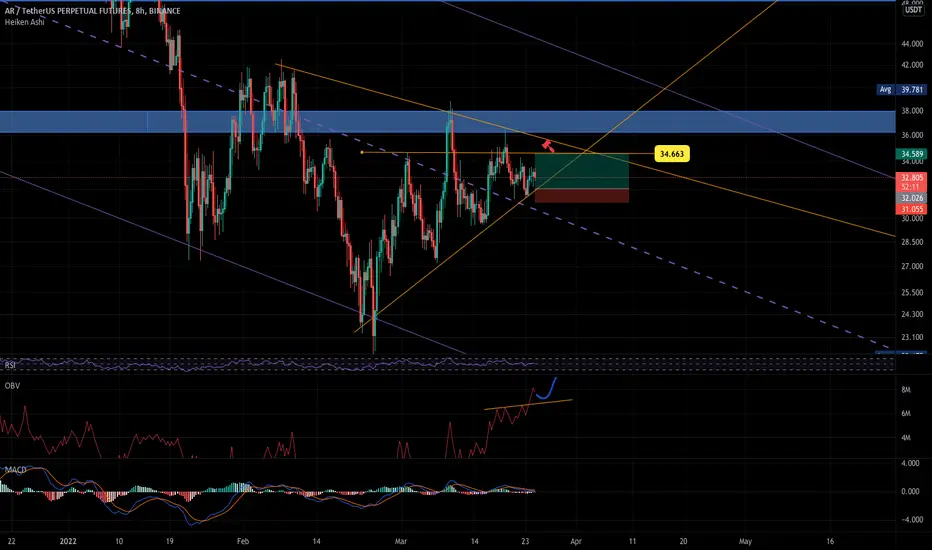
Elliot wave of ARUSDT After the completion of the 5 main waves and the completion of the ABC pattern, a new wave has started and we are in wave 3.
After correcting Wave 2 from the original 3 to the $ 33 range, we enter Wave 3 from the original 3 and move to $ 41, and then enter a triangular time correction to get ready for Wave 5 of the original Wave 3.
Elliot wave of ARUSDTAfter the completion of the 5 main waves and the completion of the ABC pattern, a new wave has started and we are in wave 3.
After correcting Wave 2 from the original 3 to the $ 33 range, we enter Wave 3 from the original 3 and move to $ 41, and then enter a triangular time correction to get ready for Wave 5 of the original Wave 3.
AR/USDT 1HrWAITING FOR BREAKOUT TO ENTRY AR/USDT 1HR. IT FORMED SYMMETRIC TRIANGLE. IF it Breaks up or down with good volume we can short or long the position with targets.

Arweave elliot wave analysisArweave looks like this for me. Let me know if there is anything you see wrong.

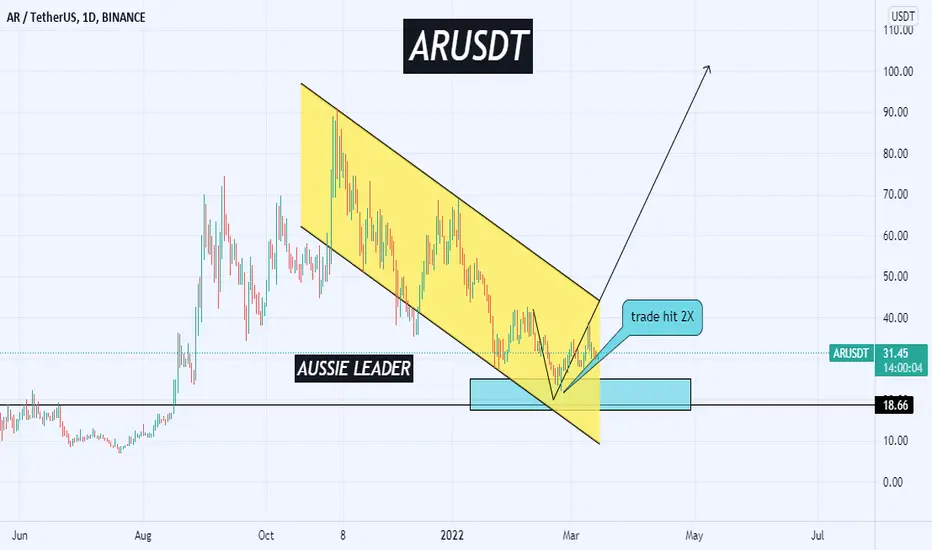
ARUSDt trade hit 2X ARUSDt trade is potential trade to go up. It already moved 2X according to previous forecast. Next step will be a bit of consolidation then hit final target.
AR/USDT ON BINANCEPlan For Exit From This Market.
Its Very Tricky, Because The Bitcoin Can Doing Bearish Retest And Deadcat Bounce, This Impact Maybe Can Make Arweave To Correction

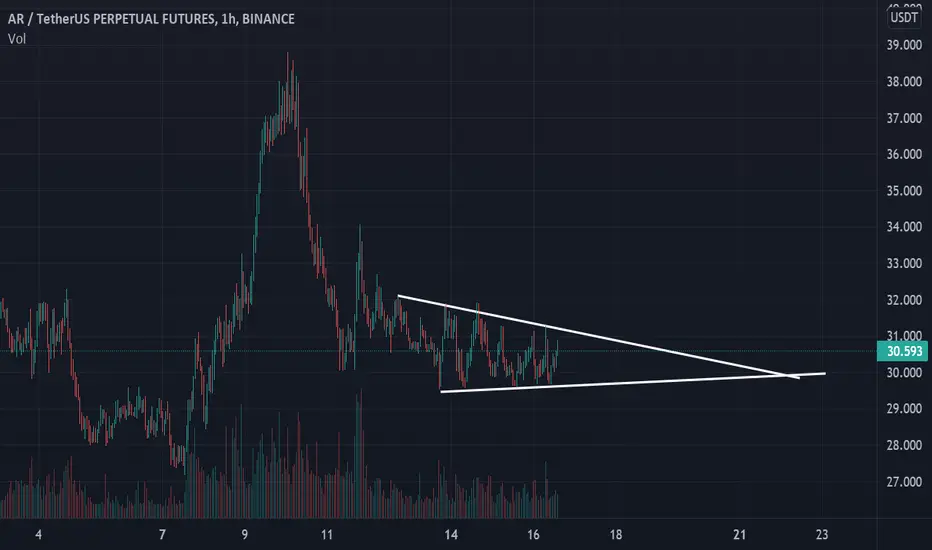
AR/Bounce on Support/Buy Long~ AR formed a cup and handle pattern then a pullback happend on 30.5 price level
~ RSI is already at oversold area (1hr tf)
~ MACD bullish cross on 1hr tf
~ Hopefully since AR has a big bullish convergence on a daily tf this may continue it's uptrend and breakout on major resistance

AR/Breakdown/Sell Short~ AR breakdown on it's trendline support
~ Bearish divergence also seen in 1hr tf and did not hold on it's $34.39 support
~ Buying volume weaken in 4hrs tf and a strong selling volume seen it 1hr tf
~ Bollinger bands was also broken signaling a bearish bias

Buying AR/USDT Here 50-80% profitsAR Valid retest after can't break to make new momentum accumulation for breakout
Whale accumulation $BTC down $AR can sustain on support zone
MACD showing bullish crossover
Faliing Wedge pattern on Daily chart
Expecting big upward move after breakout🚀
Target mentioned in the chart
Green target for Long term
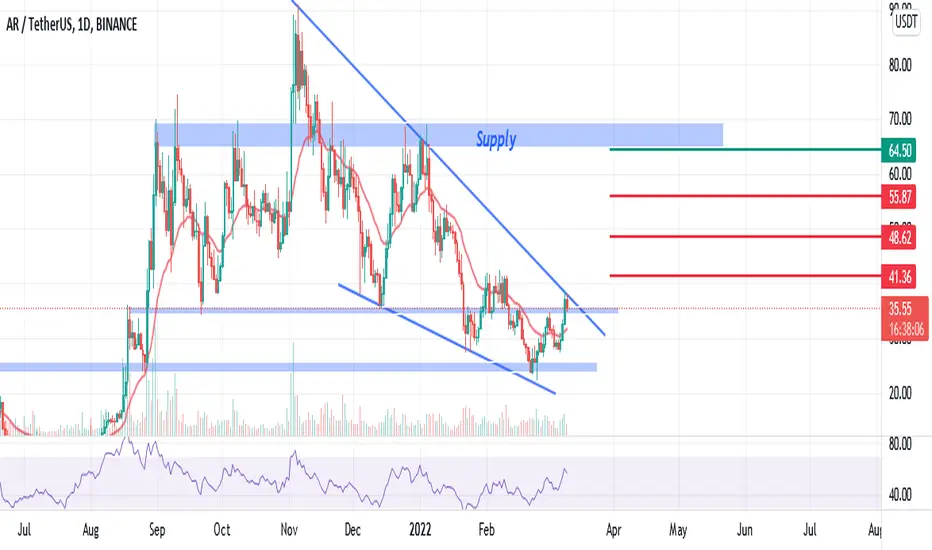
$ARUSDT Key levels, Analysis & Targets AR/USDT Key levels, Analysis & Targets
Time frame D1 Bullish Divergences in MACD Indicator

$AR Bullish GartleyReal nice Bullish Gartley here on $AR. Divergence on the RSI and MACD both. Coming off critical support and breaking local resistance.
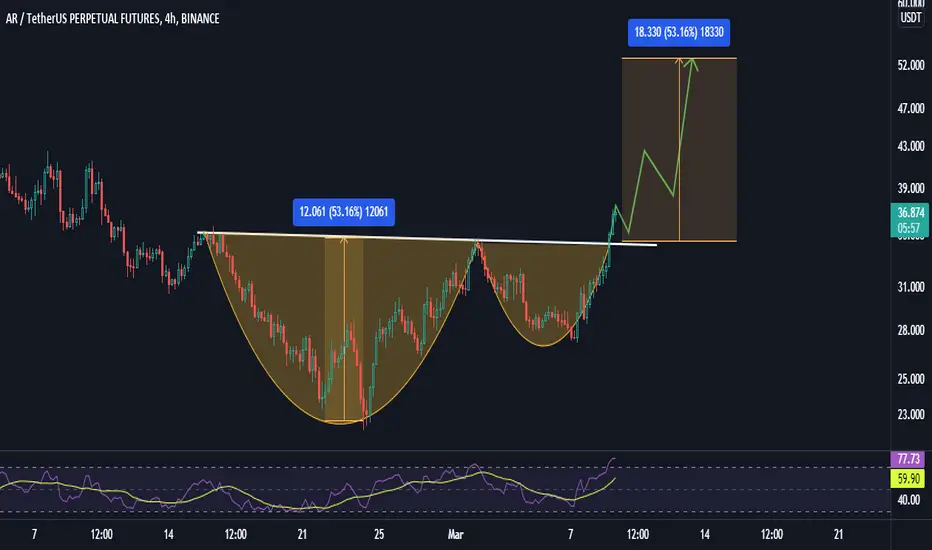
AR/USDT TRADE SETUP! 50% PROFIT EXPECTED FROM HERE!!Hello everyone, if you like the idea, do not forget to support with a like and follow.
Welcome to this AR/USDT trade setup. AR looks promising here.
It is breaking out from a cup and handle pattern in 4hr time frame. However, it might come for a retest or sometimes not. So you can start accumulating here and add more if it comes for a retest.
Entry range:- $34-$37
Target1:- $40
Target2:-$44
Target3:- $48
Target4:- $52
SL:- $32
If you like this idea then do support it with like and follow.
Also, share your views in the comment section.
Thank You!