ARUSDT trade ideas
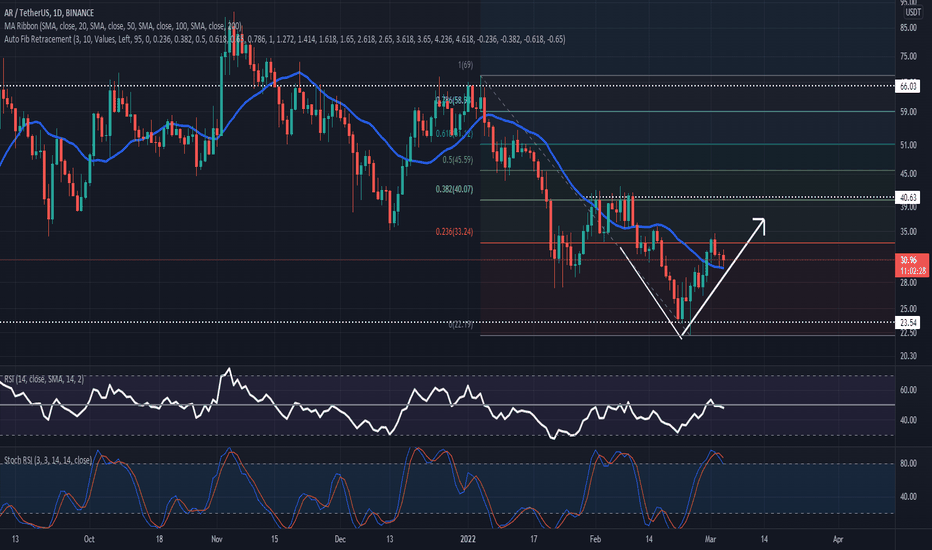
AR investors barely attempt to hold above $30 after the Dump The price of the Arweave coin is rising after having formed a low in the past six months and suggests a V-shaped recovery.
The AR investors are trying to hold the current price above the half-line of the Bollinger Bands indicators over the daily price chart.
The Arweave coin price demonstrates the fast rebound from the previous low, which might work as critical support, and the $40-mark is the ideal level for the bulls' short-term resistance. As per Fib retracement, the currency's current price is barely above the 0.236-level; bulls should wait for the daily price candle to close above it.
The daily RSI is approaching the half-line (50-Mark) over the daily price chart, reflecting the sideways momentum. Meanwhile, the Stoch RSI is into the overbought territory (K is at 79-mark and D is at 87-mark).
Conclusion
For the bullish momentum, bulls have to push the price higher above 0.236-level of Fib retracement. Then $40 only remains the vital bullish hurdle of the short-covering.
Resistance level- $40 and $50
Support level- $23 and 20
AR/USD - Arweave on the Move! 🚀🚀🚀Arweae seems keen to test the resistance. Bias is quite bullish on lower timeframes like daily.
This chart is a weekly one, but still looks bullish in the near term.
A test of the $36 level is likely before any possible fall.
Bias is bullish right now.
Like and follow if you liked my idea!
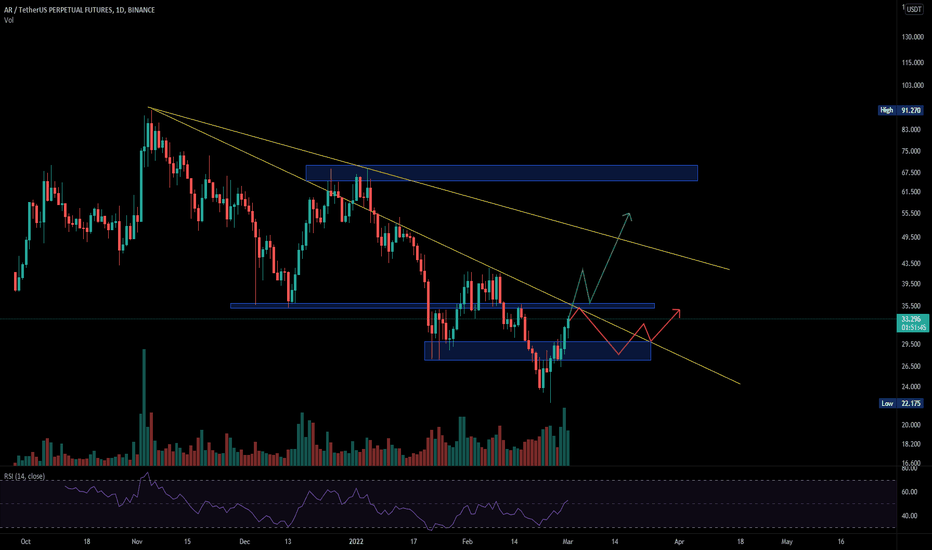
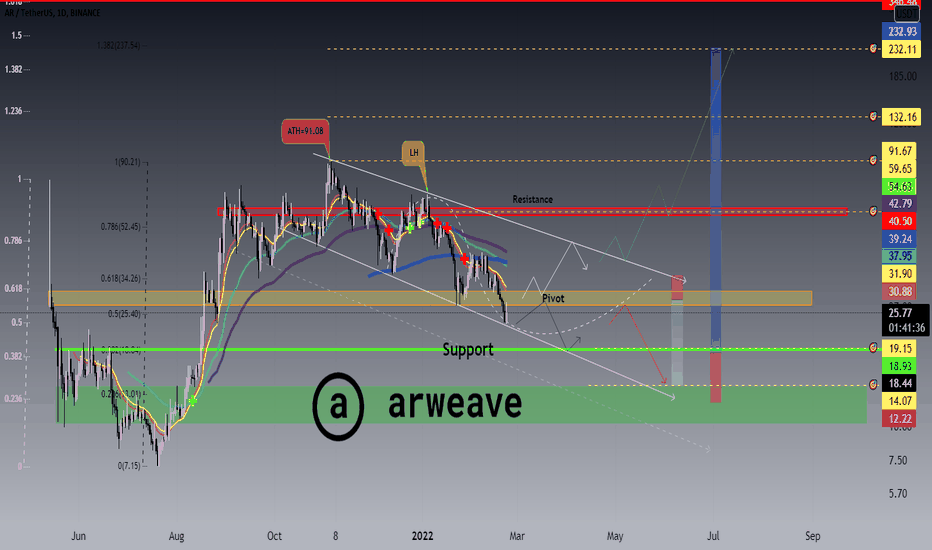
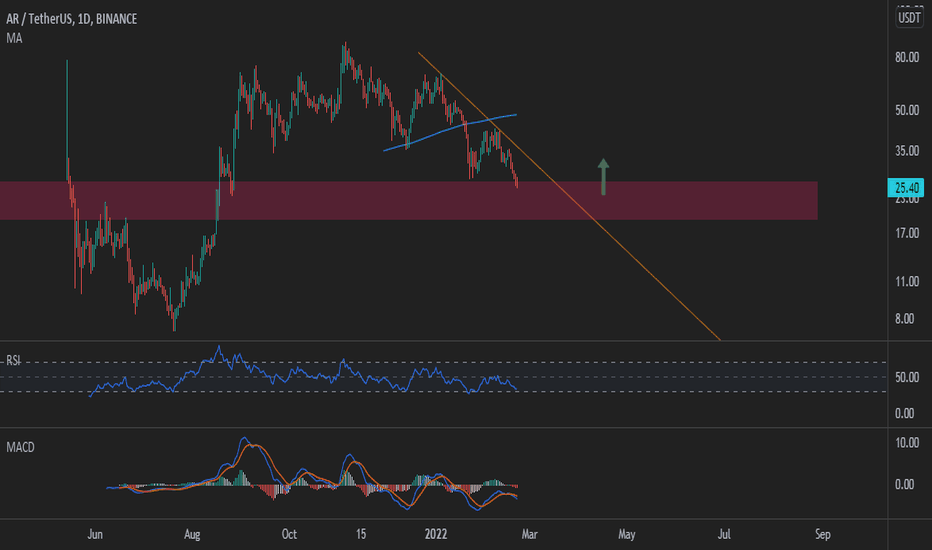
Update For AR/USDT Analysis 📈📉What's up Guys , in this analysis I gonna talk about arweave!
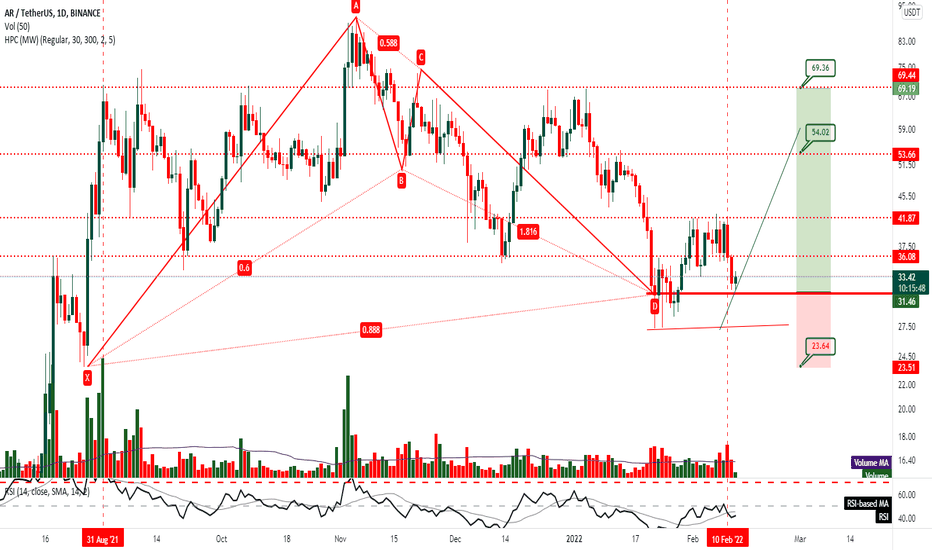
As you can see in the daily time frame for pair of AR/USDT ,since 5 NOV it has been declining after recording a new ATH about 91 $ ,
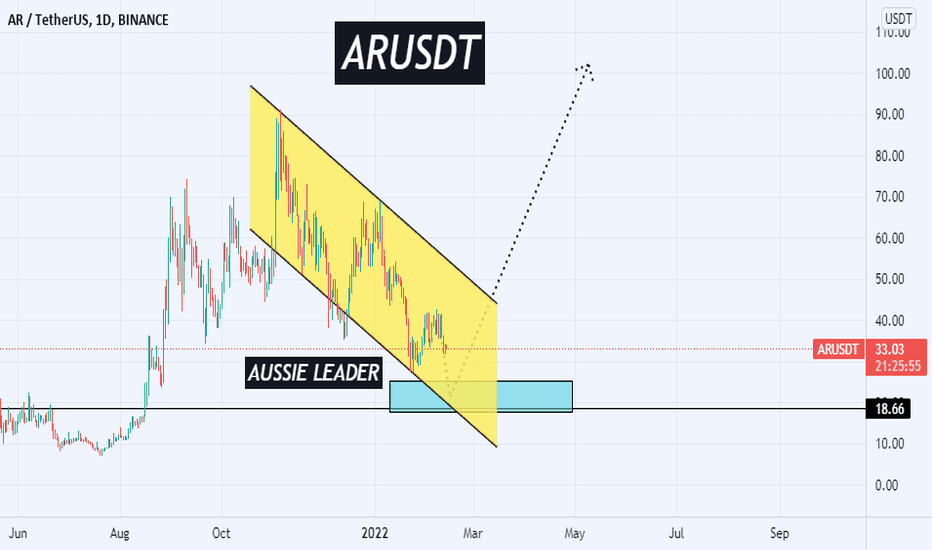
and now we can see that ar has been fluctuating between 2 decending trendlines,
also bcs of crossing under of emas , it went down under pivot zone and now there is a possibility of further fall to lower support line .
meanwhile it has reached the lower trendline again and it can have a jump , and if be able to reach above pivot area again it can rise to upper trendline ,
by breakout of descending trend line , there is a high possibility to reach the targets respectively and seeing new ATH in the long-term .
so in this case it can continue its rally by closing above trendline or resistance range and have a pulback and continue .
🛑resistances: $58-$62///descending trendline
🆚pivot zone: $27.63-30.62$
❇️supports: $18.93///$10.33-$14 ////ascending trendline
--------------------------------------------------------------------------------------------------------------------
👉This analysis is my personal opinion ,not a financial advice ,so do your own research.
💜 if you're a fan of my analyses PLZ follow me and give a big thumbs 👍 OR drop comment 🗯💭
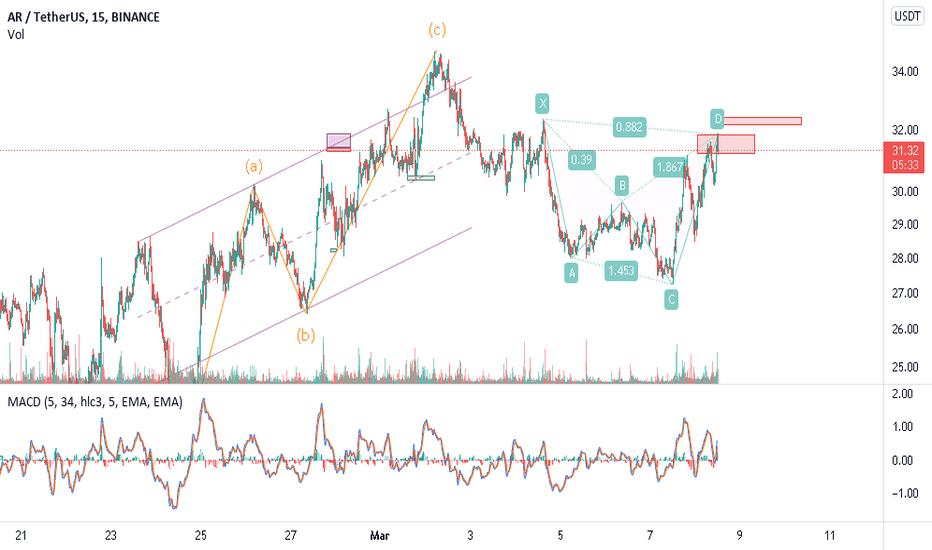
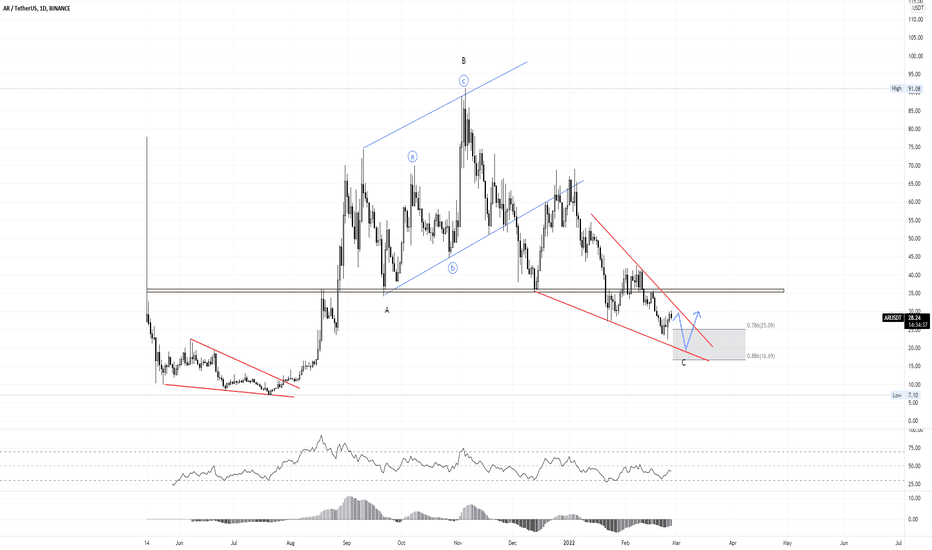
AR about to begin new bullish cycleI am tracking A-B-C correction for AR, whereas the last corrective wave C is unfolding 5 wave ending diagonal pattern, and once the pattern is complete and breaks out to the upside we can assume a start of new bullish cycle for this coin.
Pay attention to the strong resistance zone.
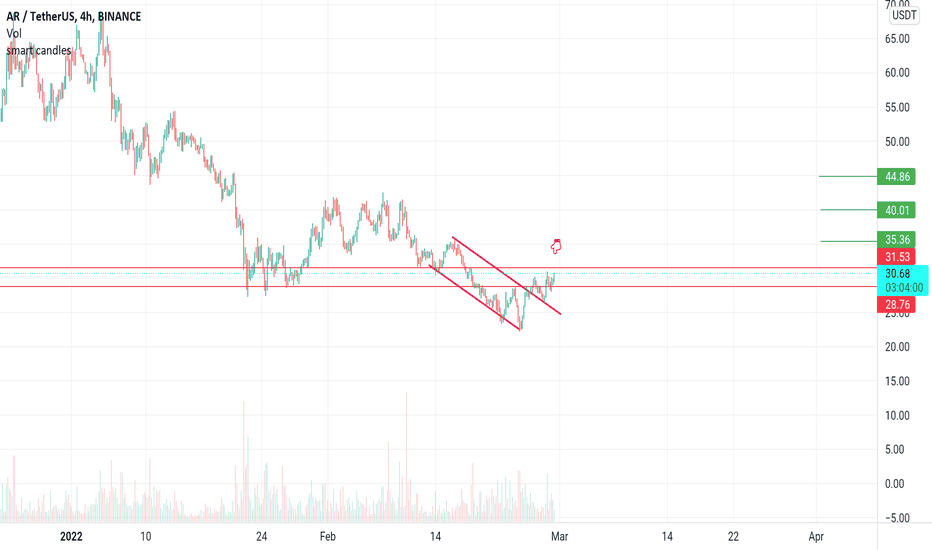
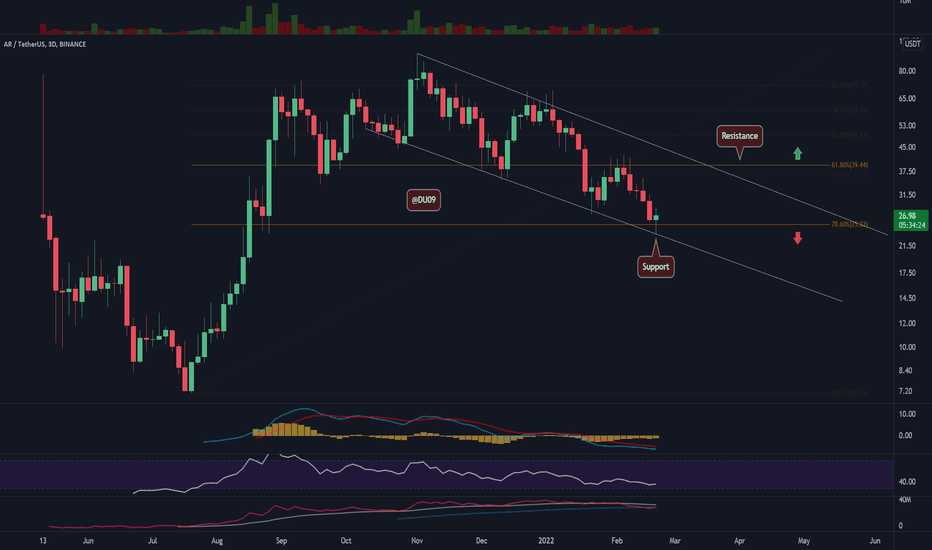
AR/USD - Descending Channel. Price at Support! 🤔Arweave dropped to a key support level at $25 dollars. Normally we should expect a bounce from this level at least until the top of our downtrend or resistance level.
However, the market remains quite bearish and a bounce may be weak. If this key support is lost then Arweave will go under $20.
I am totally interested to buy at around $10, particularly if the market remains bearish and we get a nice discount.
High timeframes like weekly are bearish but in the short term, we could get a nice relief rally. :)
Let's see, bias is neutral as long as this support holds. If it breaks, bias turns BEARISH.
Like and follow if you liked this idea!
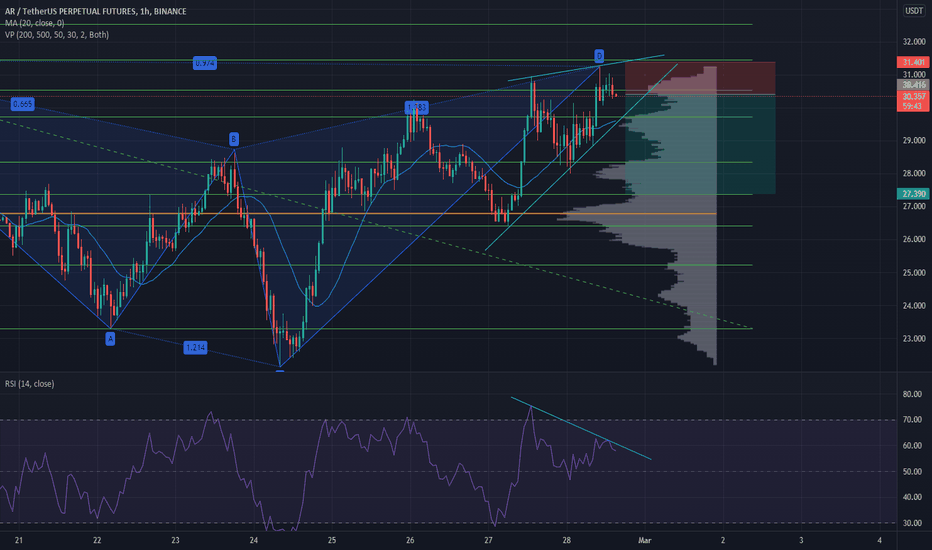
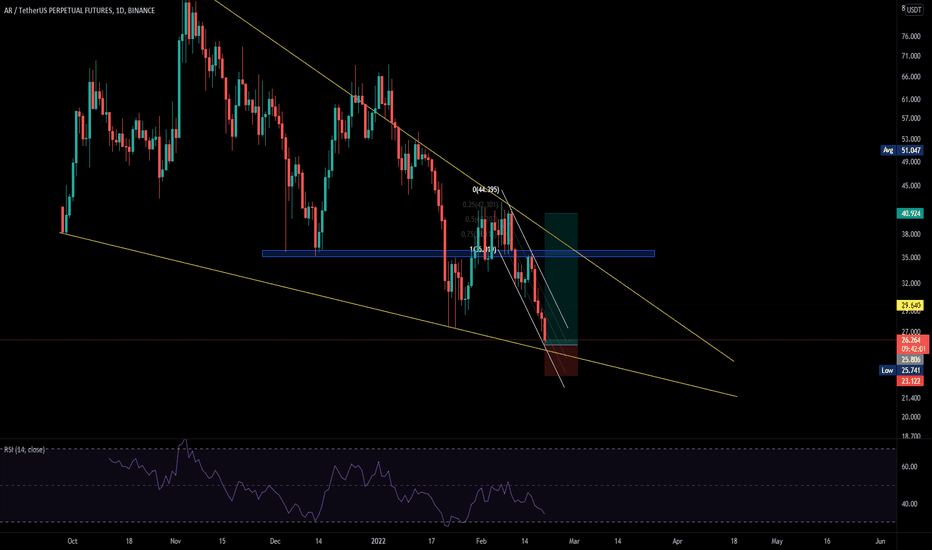
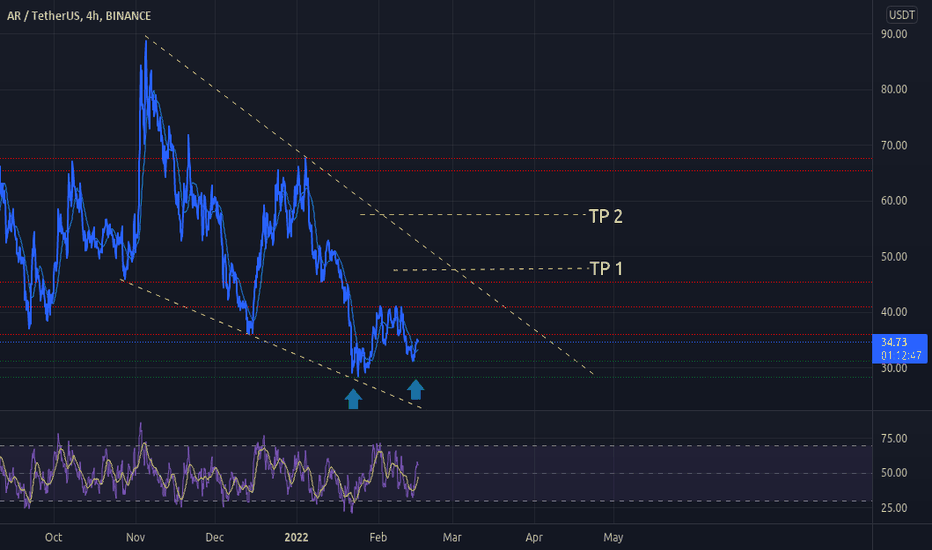
The pattern of the descending wedge in ARusdtperpGiven the downward wedge pattern formed in the daily timeframe, as well as the current price position, which is based on its dynamic support, as well as the divergence created in the RSI, it seems that the correction in the ARusdtperp has been completed and is ready for a The climb becomes powerful.
