ARUSDTARUSDT
Timeframe 4H
Logarithmic
❗️ This article is not a suggestion for buying, selling or maintaining
ARUSDT trade ideas
ARusdt buy TradeHello traders!
The overall market is strongly bullish and this is the final bull run we will see this month after that we will only look for the sell.
Buy Entry @ 36.60.
Stoploss @ 35.30(-2.65%).
Target @40.1(+10%).
Don't forget to hit the like button and follow to stay connected.

$AR about to dump!!!$AR entering demand zone and a bearish orderblock, also forming a Head and shoulders on the H4 chart. Target at $27.8 or below. Also an imminent $BTC dump further strengthens the case for Bearish momentum
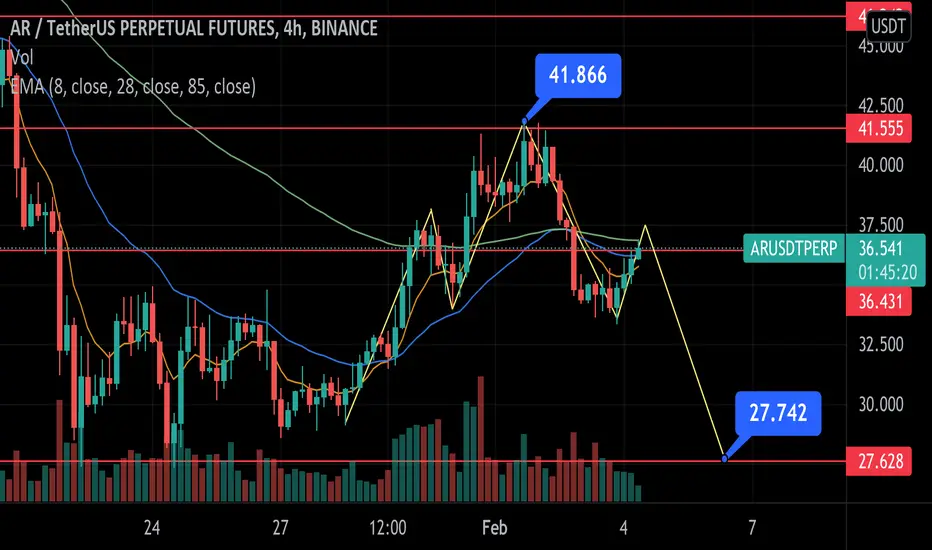
AR/USDT about to dump!! $AR entering demand zone and a bearish orderblock, also forming a Head and Shoulders on the H4 chart.
Target at $27.8 or below. An imminent BTC dump further strengthens the case for a Bearish momentum


ar please save me mushalla polar bearar please save me mushalla polar bear frxsty if ur reading this u have small balls

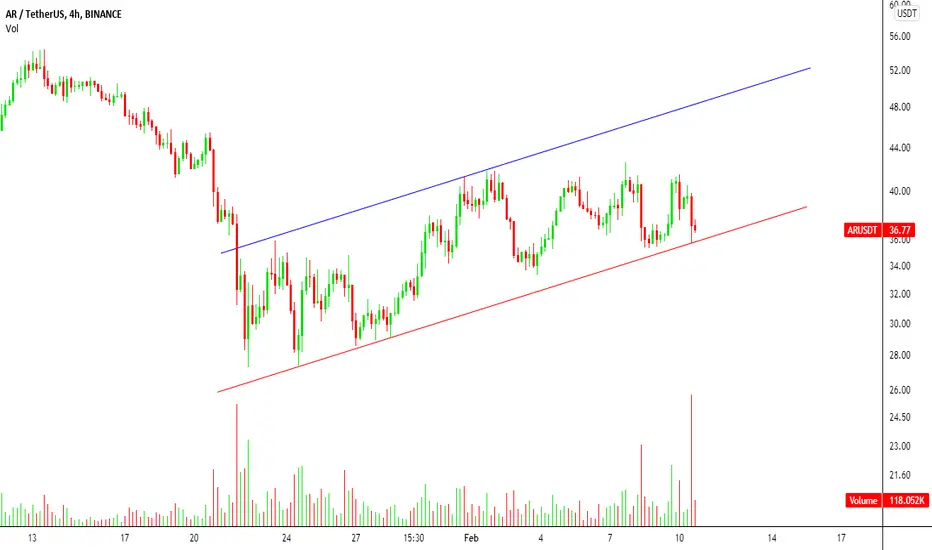
ARSuitable conditions for AR to climb, AR currency has good conditions for moving upwards after breaking the channel. Monitor AR.
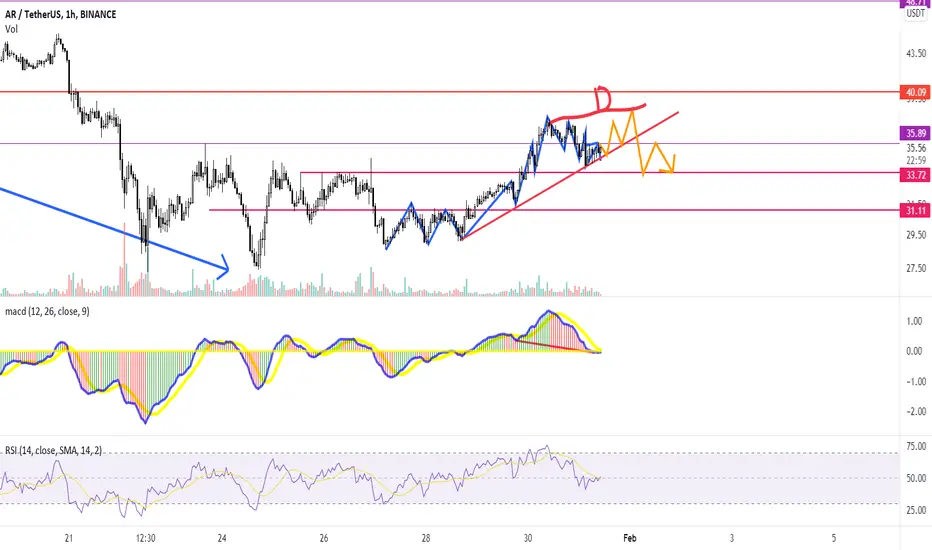
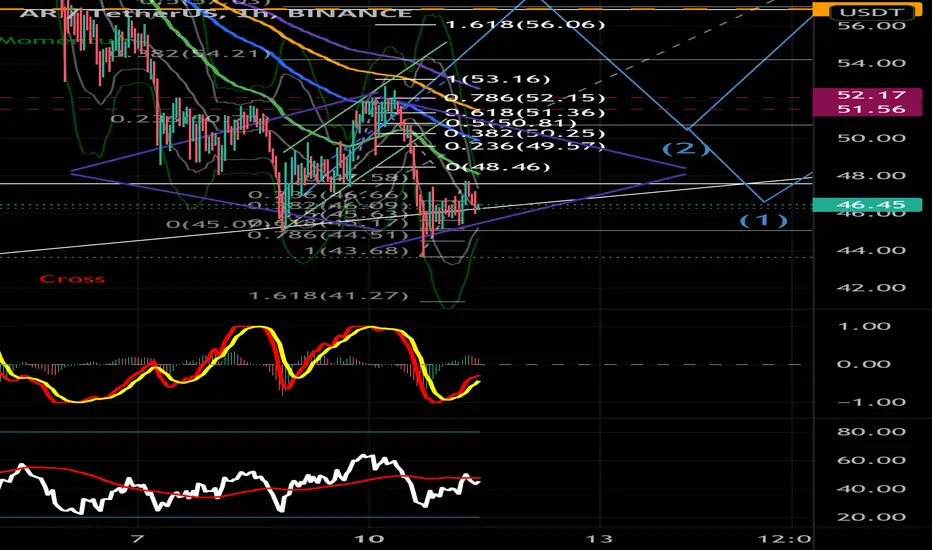
some use of divergence and some prediction on ARUSDTi see a up trend in 1h starting with a squeeze in sideway pattern . after trending higher market reached its resistance area . you can see that the correction is taking more time that it should to trend higher with power. so this up trend is weak . after understanding this weakness , i myself, used macd to see that the last 2 lows of uptread wave is showing us hidden divergence .in my opinion now is the best time to see a divergence in tops to go short!
ARUSDTPERP Long ScalpARUSDTPERP Long Scalp. Pullback entry. TPs on the chart. SL is liquidation. 10X backtested trade. I am not happy with where BTC is right now. Tumultuous times we're in right now. So this trade is higher risk than normal IMO.
The pullback entry is the the red line.


AR Arweave: 1D Chart ReviewHello friends, today you can review the technical analysis idea on a 1D linear scale chart for Arweave (ARUSDT).
The chart is self-explanatory. The current price is in a bearish pennant with the RSI in the oversold region. The price may have the ability to go up with a potential for a fake out. The measured move of the bearish pennant is almost at the Danger Zone (multi-month) support line. If price moves up, keep an eye on the resistance areas as well as the Ichimoku Cloud resistance.
Included in the chart: Trend line, Support and Resistance Lines, RSI , Bearish Pennant, Ichimoku Cloud, Volume.
If you enjoy my ideas, feel free to like it and drop in a comment. I love reading your comments below.
I have a bunch of additional recent charts below on cryptocurrencies to review. Check them out!
Disclosure: This is just my opinion and not any type of financial advice. I enjoy charting and discussing technical analysis. Don't trade based on my advice. Do your own research! #cryptopickk

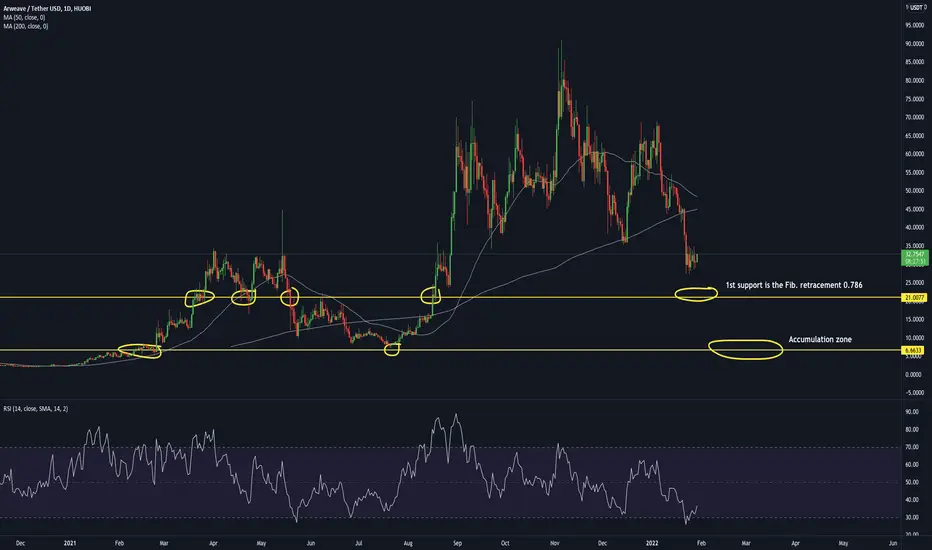
Arweave (AR) down to 6 USD?Currently I will not take big investments into altcoins and have money aside! 1st support for Arweave (AR) is the Fib. retracement 0.786 by $21 which could be a good area for a pull-back trade. Personally I will accumulate by around $6! Not financial advice!
AR has a good range to buy On 4F TF
BINANCE:ARUSDT is in the zigzag wave. This correction wave is nearly done with target around 28.
Wave C is still happening, wait for 5th wave.
Range 30 - 25 is a good buying zone.
DOYR be4 you trade

Entering a Long Inverse Head and ShouldersLooking to enter at the current price, to go long target close to $40+ depending on how the neck breaks out and what the Fed says this afternoon.
Stop loss.. Um IDK maybe like 30 or something lol
AR, head and shoulders pattern.The following are machine translations:
A head-and-shoulders top pattern is formed.
It fell below the neckline, and the rebound was blocked at the neckline.
Bearish.

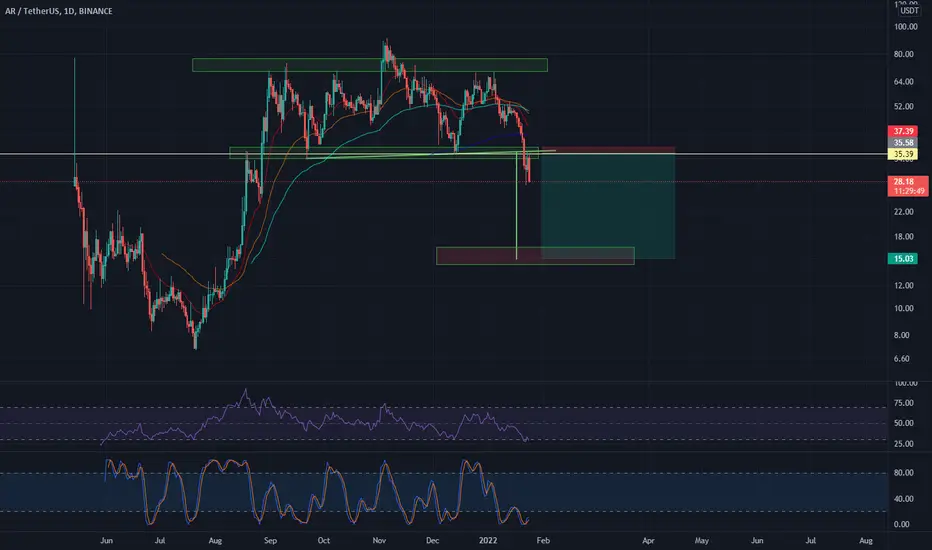
ARWeave Analysis: Still on CorrectionAR just painted a head and shoulders pattern and recently broke out of the neckline of this pattern. Since the whole market is bearish and on correction right now, AR will also see more dips. I think we are on the "A" wave of Elliott Wave counting. I expect the A wave to end at $18 and then bounce back up to the bottom line of the main head and shoulders which will complete the pullback as well as the B wave on %38.2 of "V" to "A" impulse. The last correcting wave (C) will bounce at $7.5 which is the golden zone to buy back AR

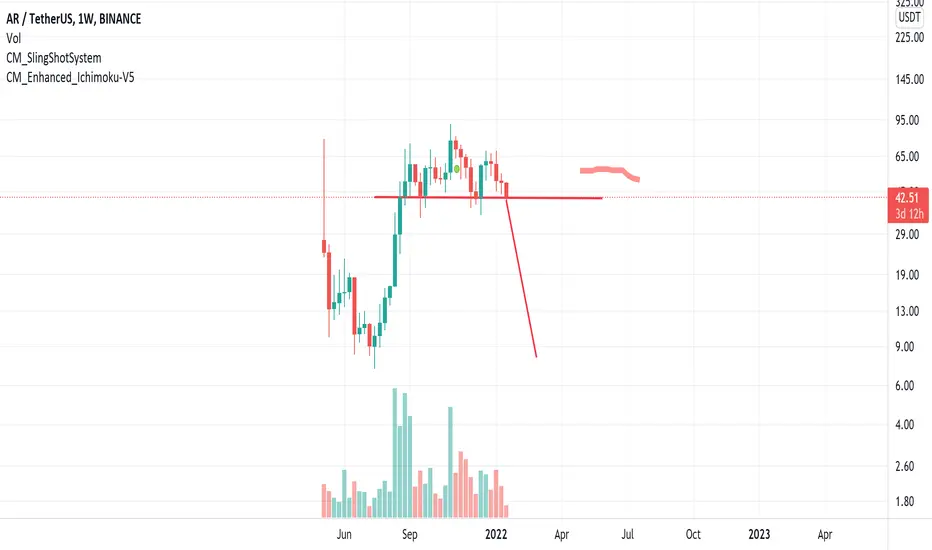
Trade with cautionHead and shoulders spotted. This would crush arweave to 8 dollars.
This is entirely possible as btc is showing increasingly stronger signs of bear market along with many major alts.
Don't expect another link for this bear market and especially not AR.

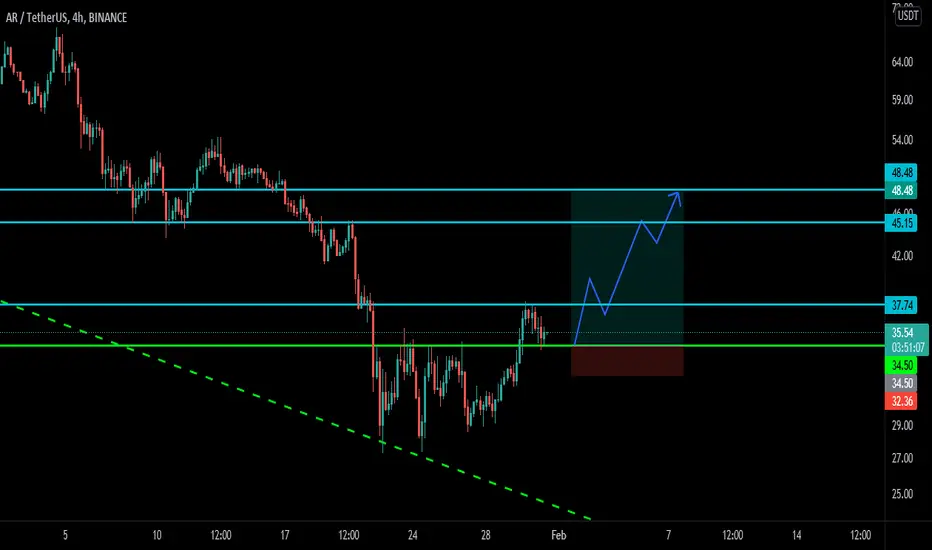
$AR two variants of price movementWe are outside of the uptrend channel, we need to close this week above the trend line to continue the growth.
I see two variants of price movement:
1) We can't consolidate above the trend line and continue falling (in this case the nearest support is the bottom bolinger band)
2) We will close this week or next week above the trend line, after which we will go up to the resistance area of 60-63
Always consider the state of the market.

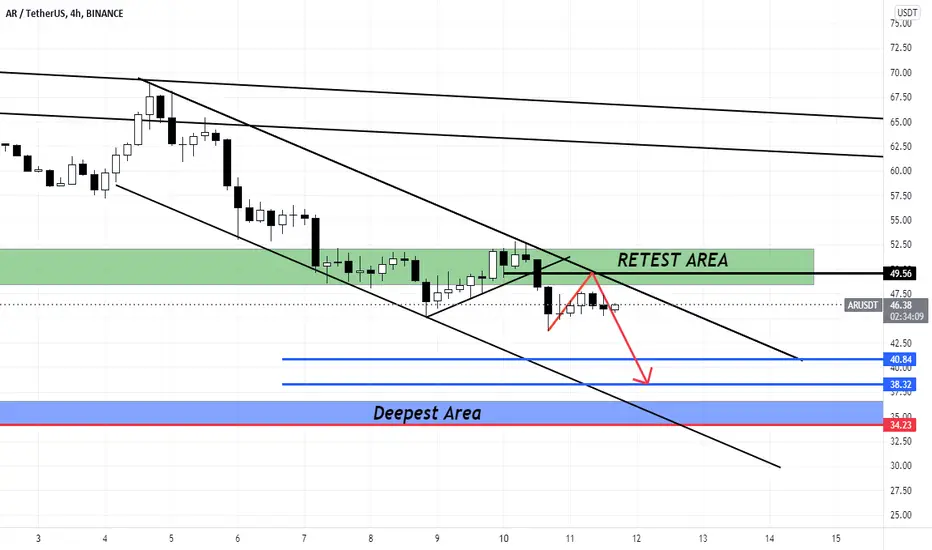
ARUSD IN BEARISH CHANNELAR/USDT
Move to the retest area for now, test the breakdown area
Or maybe can break the channel
We just need the confirmation, dont rush
Please be patience
#tipsfortradingplanning
ARUSDT will go around 56.89usdt !!!ARUSDT can go around 56.89usdt. If you go higher will hit 59.85 or 61.00usdt and support resistance it will be orange lane (56.89ust)!! If AR hit 59.85usdt and he go down (after hitting 59.85usdt) other support resistance is black/red lane (51.56usdt) and if AR can't stay on red-black support resistance (51.56usdt) he will go down to 45 or 48usdt!!!!
