Hejaz High Innovation | Chart & Forecast SummaryKey Indicators On Trade Set Up In General
1. Push Set Up
2. Range Set Up
3. Break & Retest Set Up
Notes On Session
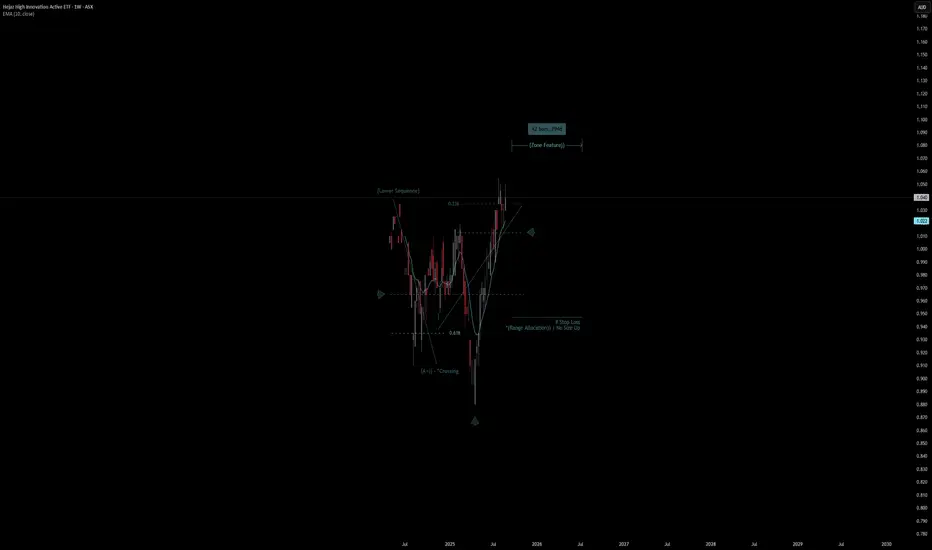
# Hejaz High Innovation
- Double Formation
* (Lower Sequence) Short Entry - *10EMA | Subdivision 1
* (A+)) - *Crossing | No Size Up - *Reversal Area | Completed Survey
* 42bars, 294d |
Key stats
About Hejaz High Innovation Active ETF
Home page
Inception date
May 2, 2024
Dividend treatment
Distributes
Primary advisor
Hejaz Asset Management Pty Ltd.
ISIN
AU0000327892
To achieve a (total) return at least equal to movements in the Benchmark over a rolling 5 to 7-year timeframe through exposure to a diversified equities portfolio of Shariah Compliant listed companies poised to outperform the broader market
Related funds
Classification
What's in the fund
Exposure type
Technology Services
Electronic Technology
Health Technology
Cash
Stock breakdown by region
Top 10 holdings
Summarizing what the indicators are suggesting.
Oscillators
Neutral
SellBuy
Strong sellStrong buy
Strong sellSellNeutralBuyStrong buy
Oscillators
Neutral
SellBuy
Strong sellStrong buy
Strong sellSellNeutralBuyStrong buy
Summary
Neutral
SellBuy
Strong sellStrong buy
Strong sellSellNeutralBuyStrong buy
Summary
Neutral
SellBuy
Strong sellStrong buy
Strong sellSellNeutralBuyStrong buy
Summary
Neutral
SellBuy
Strong sellStrong buy
Strong sellSellNeutralBuyStrong buy
Moving Averages
Neutral
SellBuy
Strong sellStrong buy
Strong sellSellNeutralBuyStrong buy
Moving Averages
Neutral
SellBuy
Strong sellStrong buy
Strong sellSellNeutralBuyStrong buy
Displays a symbol's price movements over previous years to identify recurring trends.
Frequently Asked Questions
An exchange-traded fund (ETF) is a collection of assets (stocks, bonds, commodities, etc.) that track an underlying index and can be bought on an exchange like individual stocks.
HHIF trades at 1.035 AUD today, its price has risen 0.99% in the past 24 hours. Track more dynamics on HHIF price chart.
HHIF net asset value is 1.02 today — it's fallen 1.80% over the past month. NAV represents the total value of the fund's assets less liabilities and serves as a gauge of the fund's performance.
HHIF assets under management is 7.20 M AUD. AUM is an important metric as it reflects the fund's size and can serve as a gauge of how successful the fund is in attracting investors, which, in its turn, can influence decision-making.
HHIF price has fallen by −1.91% over the last month, and its yearly performance shows a 11.29% increase. See more dynamics on HHIF price chart.
NAV returns, another gauge of an ETF dynamics, have risen by −1.80% over the last month, have fallen by −1.80% over the last month, showed a 4.53% increase in three-month performance and has increased by 6.20% in a year.
NAV returns, another gauge of an ETF dynamics, have risen by −1.80% over the last month, have fallen by −1.80% over the last month, showed a 4.53% increase in three-month performance and has increased by 6.20% in a year.
HHIF fund flows account for 105.71 K AUD (1 year). Many traders use this metric to get insight into investors' sentiment and evaluate whether it's time to buy or sell the fund.
Since ETFs work like an individual stock, they can be bought and sold on exchanges (e.g. NASDAQ, NYSE, EURONEXT). As it happens with stocks, you need to select a brokerage to access trading. Explore our list of available brokers to find the one to help execute your strategies. Don't forget to do your research before getting to trading. Explore ETFs metrics in our ETF screener to find a reliable opportunity.
HHIF invests in stocks. See more details in our Analysis section.
HHIF expense ratio is 1.55%. It's an important metric for helping traders understand the fund's operating costs relative to assets and how expensive it would be to hold the fund.
No, HHIF isn't leveraged, meaning it doesn't use borrowings or financial derivatives to magnify the performance of the underlying assets or index it follows.
In some ways, ETFs are safe investments, but in a broader sense, they're not safer than any other asset, so it's crucial to analyze a fund before investing. But if your research gives a vague answer, you can always refer to technical analysis.
Today, HHIF technical analysis shows the buy rating and its 1-week rating is strong buy. Since market conditions are prone to changes, it's worth looking a bit further into the future — according to the 1-month rating HHIF shows the buy signal. See more of HHIF technicals for a more comprehensive analysis.
Today, HHIF technical analysis shows the buy rating and its 1-week rating is strong buy. Since market conditions are prone to changes, it's worth looking a bit further into the future — according to the 1-month rating HHIF shows the buy signal. See more of HHIF technicals for a more comprehensive analysis.
No, HHIF doesn't pay dividends to its holders.
HHIF trades at a premium (0.51%).
Premium/discount to NAV expresses the difference between the ETF’s price and its NAV value. A positive percentage indicates a premium, meaning the ETF trades at a higher price than the calculated NAV. Conversely, a negative percentage indicates a discount, suggesting the ETF trades at a lower price than NAV.
Premium/discount to NAV expresses the difference between the ETF’s price and its NAV value. A positive percentage indicates a premium, meaning the ETF trades at a higher price than the calculated NAV. Conversely, a negative percentage indicates a discount, suggesting the ETF trades at a lower price than NAV.
HHIF shares are issued by Hejaz Capital Pty Ltd.
HHIF follows the No Underlying Index. ETFs usually track some benchmark seeking to replicate its performance and guide asset selection and objectives.
The fund started trading on May 2, 2024.
The fund's management style is active, aiming to outperform its benchmark index by actively selecting and adjusting assets. The goal is to achieve returns that exceed those of the index the fund tracks.