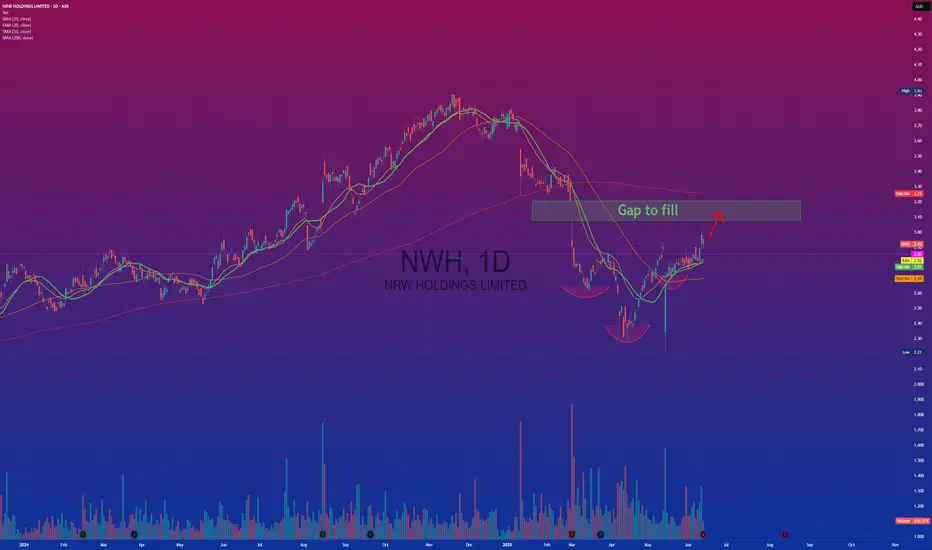
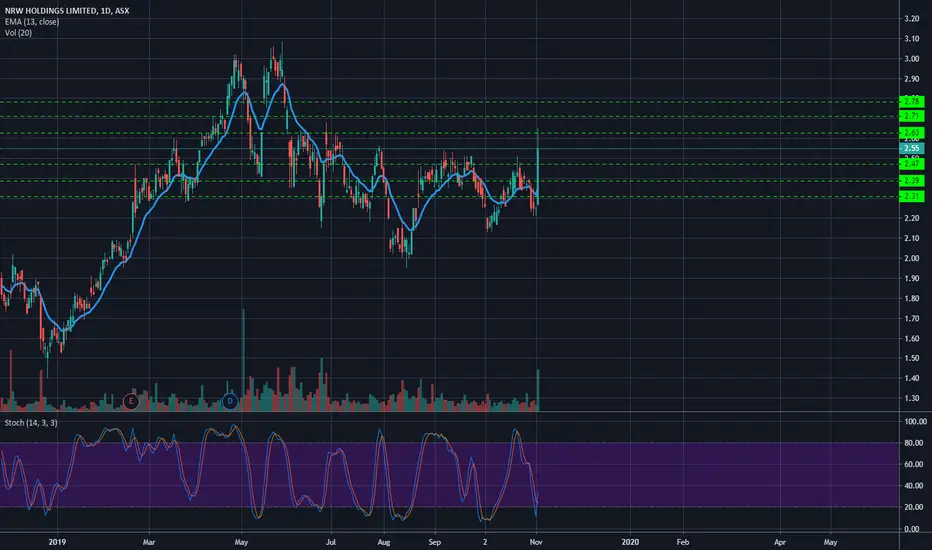
$NRW gap to Fill, bullish, Head and Shoulder breaks neckline🔍 Current Technical Setup
Price: $2.92 AUD
Trend: Recent bullish reversal from lows near $2.00
Volume: Increasing volume on the uptrend — a bullish sign of accumulation.
Moving Averages:
Short-Term EMA (10): $2.82 — price is above = bullish.
EMA (50): $2.61 — price is also above = uptrend intact.
SMA (200): $3.25 — price below = long-term resistance remains.
🧠 Key Chart Patterns & Levels
Structure: Cup & Handle / Inverted Head and Shoulders-like bottom formation from the April–June base.
Breakout Zone: Just broke through minor resistance around $2.90 with strong volume.
Gap Fill Zone: Between $3.10–$3.30 (highlighted grey box). This is a key target area where price previously sold off — likely to act as resistance.
Major Resistance: The 200-day SMA at $3.25 aligns with the upper edge of the gap zone = high confluence resistance.
📈 Bullish Scenario (High Probability ~60–70%)
Price continues to rally on strong volume to test the gap resistance zone.
Target: $3.10 to $3.30 in the short term (5–15% upside).
A daily close above $3.30 would confirm a structural breakout toward previous highs near $3.80–$4.00 (medium-term target).
📉 Bearish Scenario (~30–40% Probability)
Price rejects off $2.90–$3.00 and retests support at the 50 EMA (~$2.60).
If it loses the $2.50 level again, the structure weakens and re-tests lows near $2.10–$2.20 become possible.
🎯 Trading Strategy & Risk
Entry zone (momentum): $2.85–$2.95 (already underway).
Short-term Target: $3.10–$3.30
Medium-term Target: $3.80
Stop loss: Below $2.70 (just under the 50 EMA and recent swing low).
Risk:Reward: About 1:2 or better toward the gap fill.
🧠 Summary
NRW (NWH) is showing a strong bullish reversal from a major base with increasing volume. The short-term structure supports a gap fill to $3.10–$3.30, with a medium-term potential back to $3.80 if it breaks the 200 SMA cleanly. However, resistance is expected near that region and caution is warranted around $3.25.
Would you like a trade plan or probability table next?
NWH trade ideas
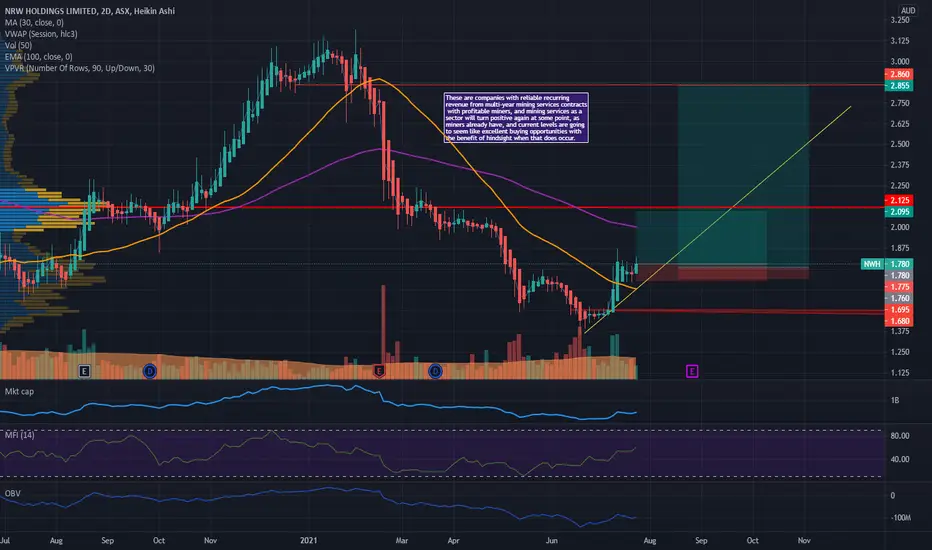
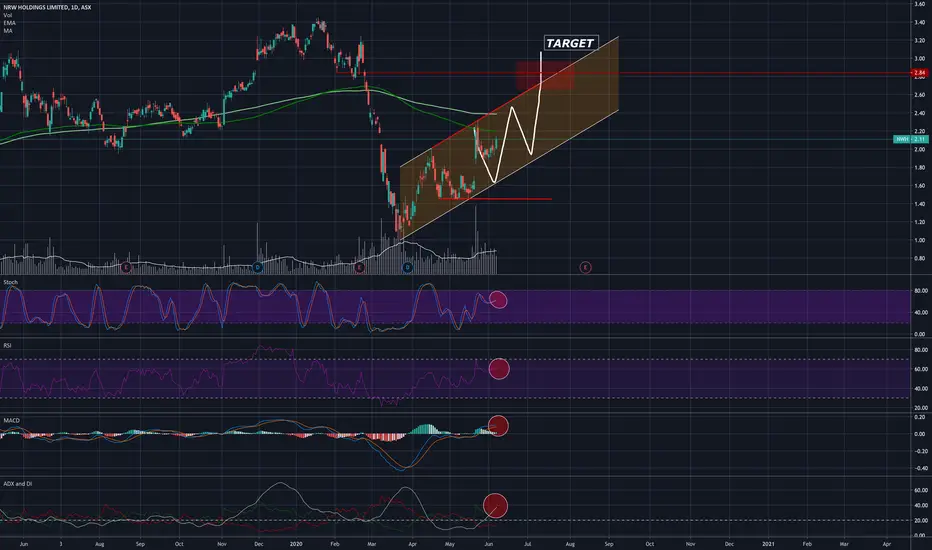
NWH LongSetup: Bounce then Flag break
Catalyst (If any): Quad 3 (Gold/Energy in favour again)
Risk: $30
Reason for SL location: Below Flag
Profit targets: T1 = $210 below key Volume profile and 3 X R. T2 = $2.85 next major resistance
Comments: Price and Volume picking up after dropping to near covid lows! Not sure why it had sold down so hard but a government infrastructure stimulus beneficiary with operations in energy and gold seems like a pretty good place to park your money! Recent bounce then consolidation then break is a nice setup too!
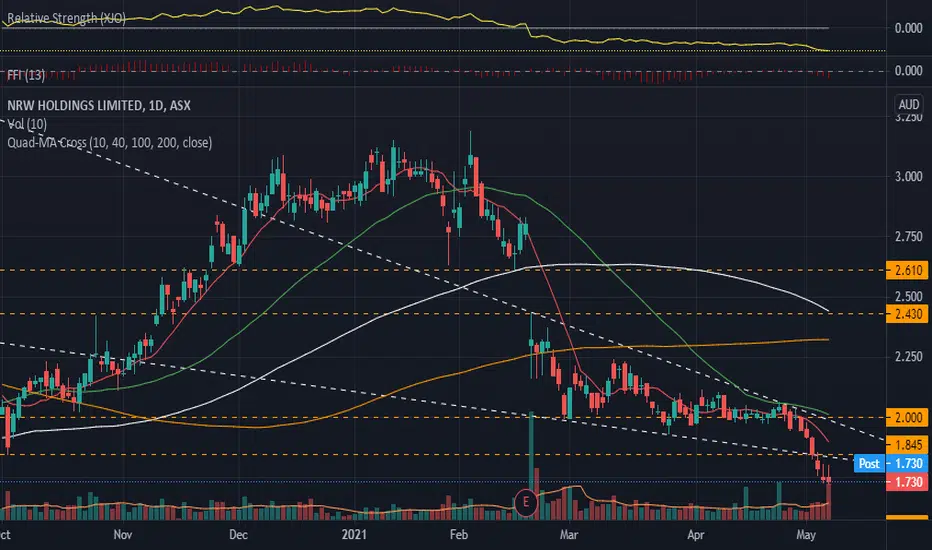
NWH.ASX_Range Breakout and Retrace Trade_ShortENTRY: 1.740
SL: 1.920
TP: 1.555
- ADX>20
- RSI<50, RSI<30
- Daily RS -ve
- Daily FFI -ve
- Daily MACD -ve
- Weekly RS -ve
- Weekly FFI -ve
- Weekly MACD -ve
- Breakout from range and descending triangle with decent volume on 4 May 2021
NWH - Ascending triangle formationBuy on break of resistance.
On balance volume is solid and building.


looking for a short This stock gain 13.33% yesterday and now i think its a bit over extended at this point, looking for a short between the range of $2.63 and $2.47.
ASX.NWH: Short & long term outlook bullishNWH driven by fib retracement. Proven gap between 2.13-2.18, bulls always push it up through this zone.
Expecting NWH to go to $2.25 in short term -> test support @ $2.20 -> go to $2.40

Quick crash course on how to configure Trading View chartsJust a very quick (ie 10 min limit) overview of some of what you can do to get started customising Trading Views charts. Ill probably need to do a few more as there is SO much you can do...

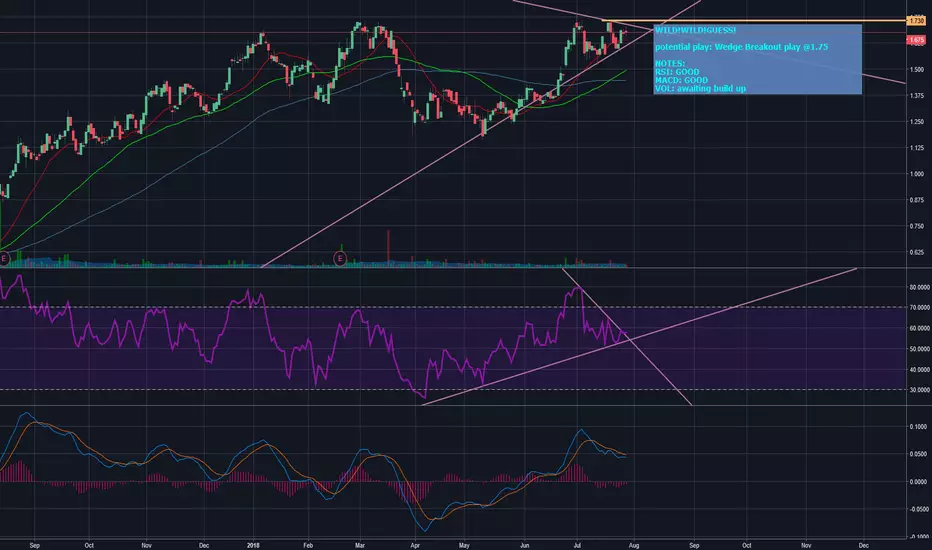
WILD!WILD!GUESS!WILD!WILD!GUESS!
potential play: Wedge Breakout play @1.75
NOTES:
RSI: GOOD
MACD: GOOD
VOL: awaiting build up
The daily chart of NRW Holdings Limited Head and Shoulders The daily chart of NRW Holdings Limited
Head and Shoulders bottom and ascending triangle.
The price broke the neckline and we got confirmation for the trend reversal.
RSI gives bullish signal.
The profit target $1.71 and $1.80
Probably the price will return to the neckline breakout $1.43 or throwback $1.35 and offer a second chance to buy.
Let see how we go.

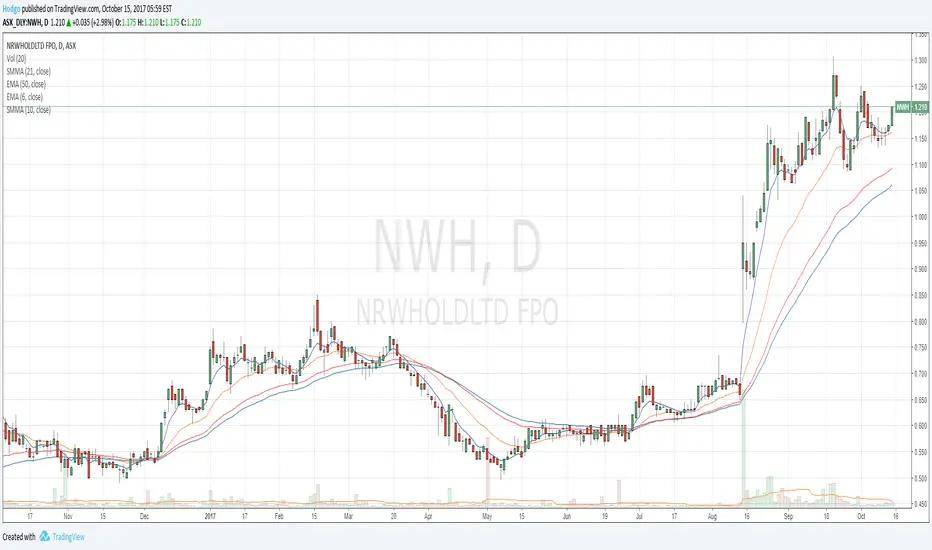
$NWH may try to push on after the strong volume yesterday$NWH may go again here after the false start back in September, which shows it needed more time to digest gains prior to stepping on the gas again. The strong volume day yesterday is also a pocket pivot volume, showing a high breakout potential.
$NWH tight pivotreally nice action last week on this. Pivoting around ma's. Looking for it to test old highs from here.
$NWH pennantA nice pennant forming here on $NWH. Low volume red bars compared to green bars is very constructive as it shows a lack of supply. Watch for volume if/when it breaks $1.20.
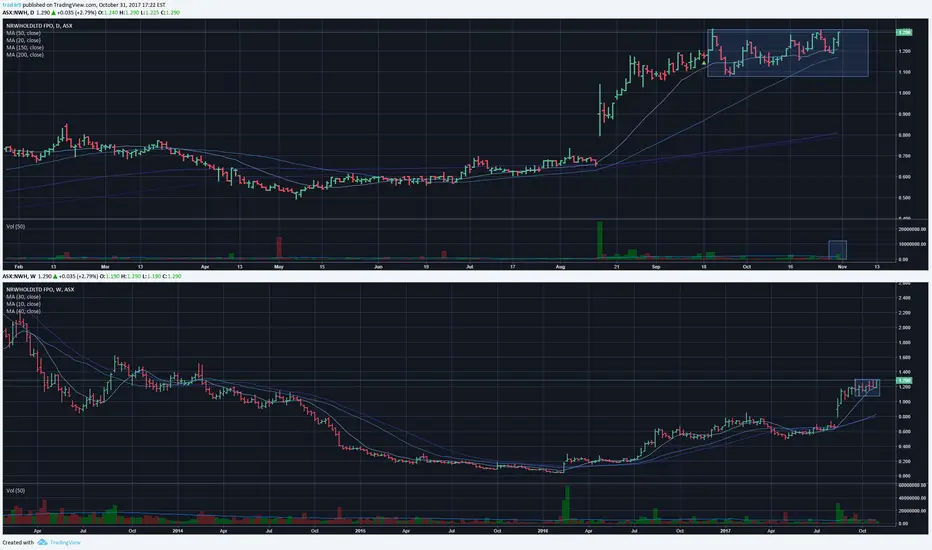
The weekly chart is showing that the long-term trend is now in Stage 2 (Markup phase) so can continue to watch for a long-term long signal.
