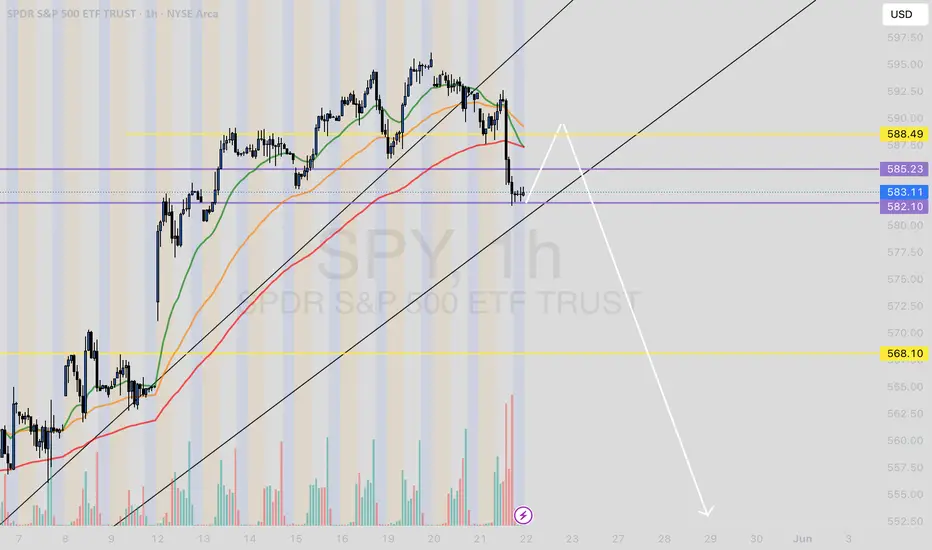
Puts on SPY, with temp pullback to buyI see emas beginning to cross, I am expecting a temporary pull back upwards and for the SPY to drop immediately after. With ema's crossing, as my confirmation before entering.
SPY trade ideas
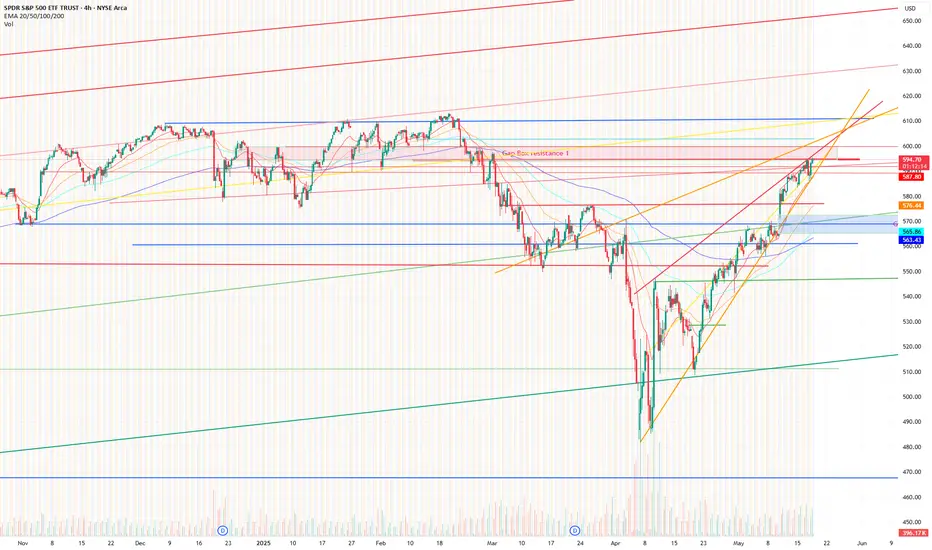
SPY @ the trendlineTruly a 50/50 from here depending on the gap up/down tomorrow. My best guess? Bullish.
Nightly $SPY / $SPX Scenarios for May 22, 2025 🔮 Nightly AMEX:SPY / SP:SPX Scenarios for May 22, 2025 🔮
🌍 Market-Moving News 🌍
📈 Treasury Yields Surge Amid Weak Bond Auction
U.S. Treasury yields continued their upward trajectory, with the 10-year yield nearing 4.6% and the 30-year yield surpassing 5%, marking the highest levels since early 2023. This increase followed a weak $16 billion auction of 20-year bonds, which attracted less investor demand and sold at higher-than-expected yields. Factors contributing to the rise include fading recession fears, persistent inflation concerns, and growing fiscal worries related to potential tax cut extensions.
📉 Stock Market Declines as Tech Stocks Retreat
The stock market experienced significant losses, with the Dow Jones Industrial Average dropping 1.9%, falling below its 200-day moving average. The S&P 500 and Nasdaq fell 1.6% and 1.4%, respectively.
💼 Snowflake ( NYSE:SNOW ) Reports Strong Earnings
Snowflake Inc. reported record quarterly revenue of $1.04 billion, surpassing expectations. Product revenue increased 26% year-over-year to $996.8 million. The company raised its full-year forecast to $4.325 billion, reflecting a 25% year-over-year increase. Despite a GAAP net loss of $430 million, Snowflake posted an adjusted profit of 24 cents per share, exceeding the 21-cent estimate.
📊 Morgan Stanley Turns Bullish on U.S. Stocks
Morgan Stanley has shifted to a bullish stance on U.S. stocks and bonds, raising its outlook due to signs of market stabilization and improving growth conditions. The bank maintains a base target of 6,500 for the S&P 500 by mid-2026, with a bullish scenario projecting 7,200.
📊 Key Data Releases 📊
📅 Thursday, May 22:
8:30 AM ET: Initial Jobless Claims
9:45 AM ET: S&P Global Flash U.S. Services PMI for May
10:00 AM ET: Advance Services Report (First Quarter 2025)
⚠️ Disclaimer:
This information is for educational and informational purposes only and should not be construed as financial advice. Always consult a licensed financial advisor before making investment decisions.
📌 #trading #stockmarket #economy #news #trendtao #charting #technicalanalysis

SPY had a small correction today, as I expected!Do I even need a description? We perfectly just called the latest correction and a spy to take place this week and now it happened, so let's talk about what's next.

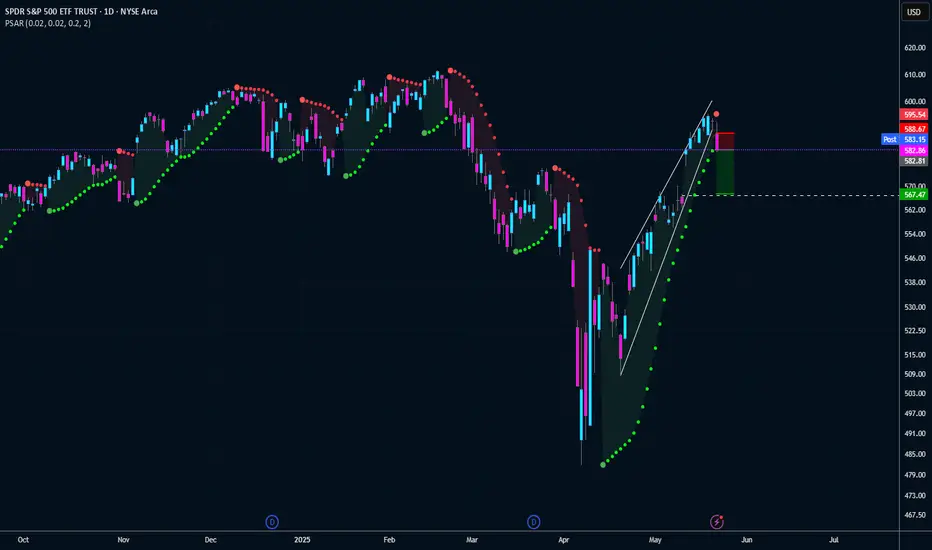
Ugly SP500 Reaction to Treasury YieldsUnlike other headline news, long term interest rates breaking out to the upside is an immediate threat to equity prices especially if it's driven by bond vigilantes rather than strong economic news. This will immediately compress valuations and particularly hurt high growth and small caps the most. In addition, this is not a one-off headline where equities markets can easily shake it off and continue to rally. I think we're going to test the gap ~$567 on AMEX:SPY after breaking down from a rising wedge and triggering the PSAR flip.
SPY Trading Opportunity! SELL!
My dear subscribers,
My technical analysis for SPY is below:
The price is coiling around a solid key level - 594.29
Bias - Bearish
Technical Indicators: Pivot Points Low anticipates a potential price reversal.
Super trend shows a clear sell, giving a perfect indicators' convergence.
Goal - 563.56
My Stop Loss - 611.99
About Used Indicators:
By the very nature of the supertrend indicator, it offers firm support and resistance levels for traders to enter and exit trades. Additionally, it also provides signals for setting stop losses
Disclosure: I am part of Trade Nation's Influencer program and receive a monthly fee for using their TradingView charts in my analysis.
———————————
WISH YOU ALL LUCK

Why this may be the bottom: Touch of crucial trendlineI think it may be a good idea to go full port long here.
We will be re-visiting the 590s again very soon.
This sell off was a result of a impending pent up dump that needed to happen sooner rather than later.

spy filling gap, to continue to upside? #tradewhatyousee
Market rallied up, inside area of interest for selling, will the GAP be a area of where buyers want to get involved?

SPY Intraday Breakdown | Will the Fill Zone Hold?🕰️ 15-Min Chart | May 21, 2025
🏢 Posted by: Wavervanir_International_LLC
A textbook ascending wedge breakdown has triggered intraday, breaching dynamic support right at the edge of the VWAP envelope. This breakdown aligns with a higher time-frame rejection seen near 598.22 (0.886 retrace zone).
🔍 Intraday Observations:
Structure Break: Rising wedge support snapped → suggests momentum shift short-term.
Next Liquidity Pools:
📍 567.51 – Prior HVN zone and VWAP mid-band
📍 559.30 – Golden pocket + historical positioning from April
Volume Spike: Bearish confirmation on rising sell-side volume.
🧠 Strategic Context:
Macro Tone: Market breathes as participants await key inflation data + Fed speak. Liquidity is not risk-on.
Risk Flow Watch: Options OI building around 560/570 strikes — could magnetize toward there if flow accelerates.
🛡️ Tactical Setup:
Short-Term Bias: Bearish to neutral into 567.5–559.3 zone
Mean Reversion Setup: Watch VWAP / 3-day anchored VWAP cluster around 559 as a potential reload zone
Invalidation: Quick reclaim and hold above 590 with strong volume flips intraday tone bullish again.
📌 Message to Traders:
Major buyers may be lurking below. The market is deciding whether to reward trapped longs or give value buyers their fill at better risk-adjusted zones. We remain liquidity-aware and flexible.
—
🔗 #SPY #IntradayTrading #VolumeProfile #Wavervanir #LiquidityMapping #VWAP #Orderflow #SMC

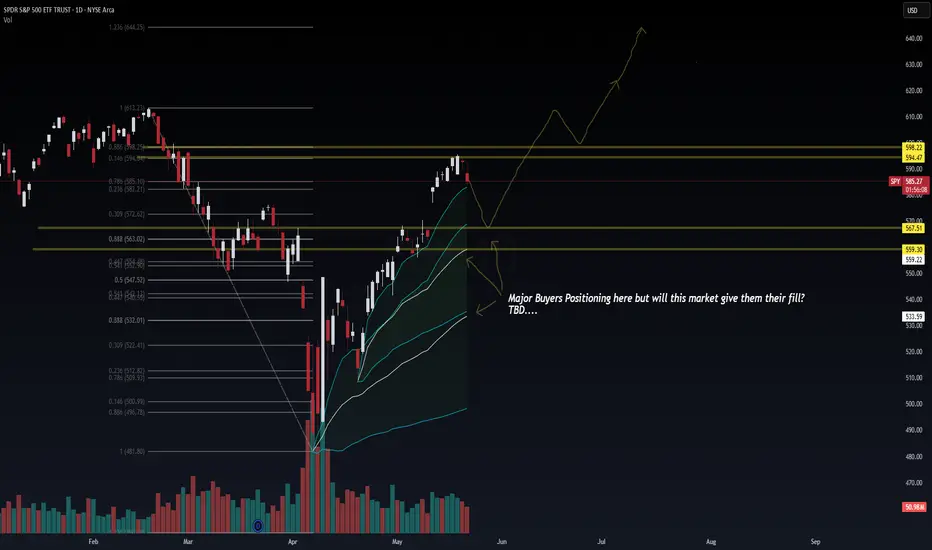
SPY | Liquidity Engineering or Reversal?🕰️ Daily Chart | May 21, 2025
🏢 Posted by: Wavervanir_International_LLC
“Major buyers are lurking... but will the market deliver the fill they want?” That’s the question.
We’re currently watching a tactical rejection near 598.22, the 0.886 Fib retracement of the prior high-volume breakdown. This level historically serves as a liquidity sweep zone before decision-making candles emerge.
🔍 Technical + Volume Profile:
Liquidity Zones:
Resistance: 594.4–598.2 = prior supply + Fib confluence
Demand Zones:
567.5 → anchored VWAP / trend channel midpoint
559.3 → 0.618 Fib + major positioning cluster
Volume: Distribution volume into prior highs = possible short-term exhaustion
EMA Structure: Bullish stack but extended from mean; room for reversion to VWAP bands.
🧠 Macro Overlay:
Risk Events: Debt ceiling headlines are muted, but upcoming PCE inflation and labor data could dictate short-term gamma positioning.
Options Skew: OTM put volume rising; VIX curve remains steep in front-end → suggesting hedging or prep for pullback.
Macro Setup: Real yields are sticky, and the Fed is not signaling dovish pivot yet — any continuation will need confirmation via breadth and credit spreads.
🛡️ Risk Framework:
Reclaim 598.2: Bias flips bullish with upside into 613–644
Break Below 567.5: Opens doors for deeper retest at 559 or even 533
Neutral Range: 567.5–594.5 → Let market structure show intent before deploying size.
📌 Game Plan:
Let price come to you. Patience > Prediction. Market is deciding whether to reward early breakout traders or punish late longs via mean reversion. Watch the 567–559 cluster—that’s where smart money may reload.
—
🔗 #SPY #MacroTrading #VolumeAnalysis #RiskManagement #Fibonacci #Wavervanir #SP500 #LiquidityMap
2-3 % Drop coming for SPY 581 -> 571...The top is in...----May 20, 2025 Update----
Price made its first lower high at 593 and retested 589 today.
I am expecting the next breach of 589 to cascade all the way down to the 581 level (1st target), and finally to 571.
Patience pays.

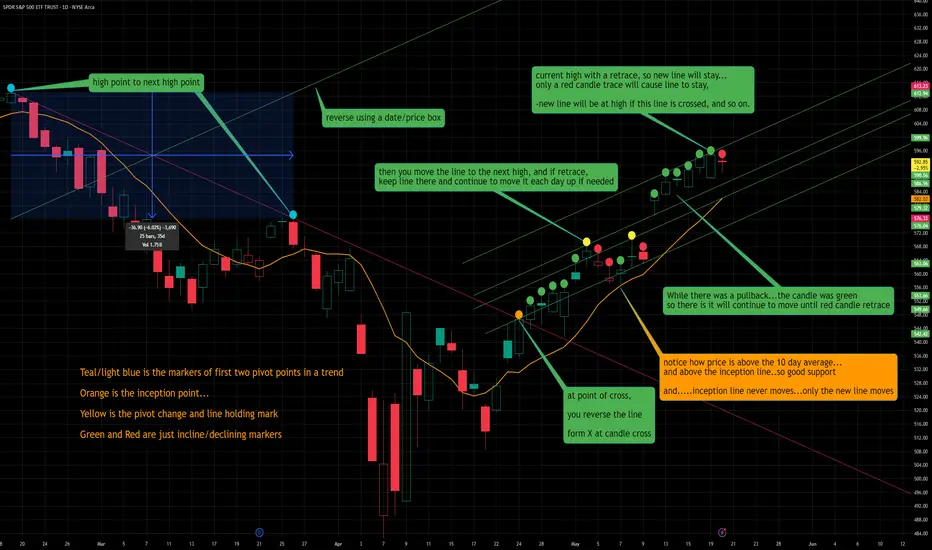
SPY trend reversal linear analysis, with parallel stackingAll the annotations speak for themselves...
but just a simple idea to see if there are levels that make sense if the descending line were to be reversed and applied to the ascending trend.
Have to follow those rules, and if too cluttered on choppy weeks- then hold the bottom line and only increase the newest line if you have price chopping greater than the height of the biggest candle in said chop.
ergo, if the biggest candle is say 4 point up from the last trend line off the inception permanent line ascending trend, then hold that line at the high of that day until price breaks above it. If chops continues above it, then draw another parallel 4 points (the height of that largest candle before the chop started) above the original line and hold it there until the chop continues up or is reverts and heads back down.
If you want to see if chop is a flag formation, then take the above example of a big candle up marking a new parallel line high and see if price for 3-4 days stays within it, pull down another parallel from that high and put it on that low...will allow for visual where the flag boundaries may be...
BTC 4hr examples:
Nightly $SPY / $SPX Scenarios for May 21, 2025🔮 Nightly AMEX:SPY / SP:SPX Scenarios for May 21, 2025 🔮
🌍 Market-Moving News 🌍
🇺🇸 G7 Finance Ministers Convene Amid Tariff Tensions
Finance ministers from G7 nations are meeting in Banff, Alberta, focusing on restoring global stability and growth. Discussions are expected to address excess manufacturing capacity, non-market economic practices, and financial crimes. Tensions may arise due to recent U.S. tariffs affecting multiple G7 nations.
🛢️ Oil Prices Rise on Geopolitical Concerns
Oil prices increased over 1% following reports that Israel may be preparing a military strike on Iranian nuclear facilities. Such actions could disrupt Middle East oil supplies, particularly if Iran blocks the Strait of Hormuz, a vital passage for crude exports.
📈 Retail Earnings in Focus
Major retailers, including Lowe's ( NYSE:LOW ), Target ( NYSE:TGT ), and TJX Companies ( NYSE:TJX ), are set to report earnings today. Investors will be closely monitoring these reports for insights into consumer spending patterns amid ongoing economic uncertainties.
📊 Key Data Releases 📊
📅 Wednesday, May 21:
10:00 AM ET: State Employment and Unemployment (Monthly) for April 2025
10:30 AM ET: EIA Crude Oil Inventory Report
⚠️ Disclaimer:
This information is for educational and informational purposes only and should not be construed as financial advice. Always consult a licensed financial advisor before making investment decisions.
📌 #trading #stockmarket #economy #news #trendtao #charting #technicalanalysis

SPY interesting view of Fib-extension off 07-15 highsJust a simple extension using basic settings////
quite the serious number of levels hit and sometimes, things work
So are we looking at a smidgen more up and then double resistance and then down?
Who knows...but closer view:

SPDR Possible Reversal hammer on the SPY Daily, more red?SPY on the daily chart, seems to bounce up when it touches the lower trend line the past several weeks but this time it shows some exhaustion on the buyers. Are we going to see more red or gap up tomorrow?
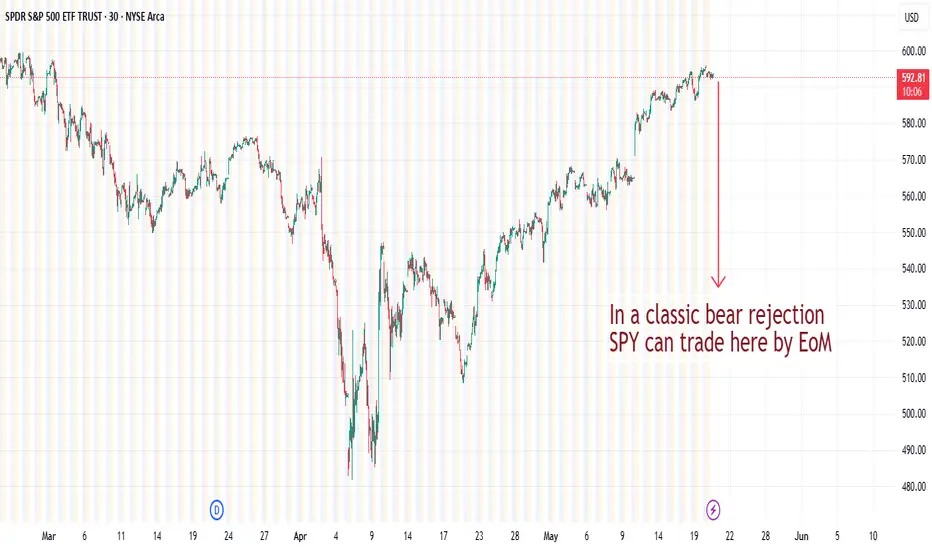
Big Wick Month in Classic Bear MoveWhich type of move we're in is hard to determine at this point, but if we were inside a classic bull trap we'd have to trade down to 5500 - 5400 from this zone.
It'd have to be a wick rejection on the monthly candle.
Which would mean we'd have to dump over 7% in the next 10 days.
These things may or may not happen, but the odds betting on them are awesome.
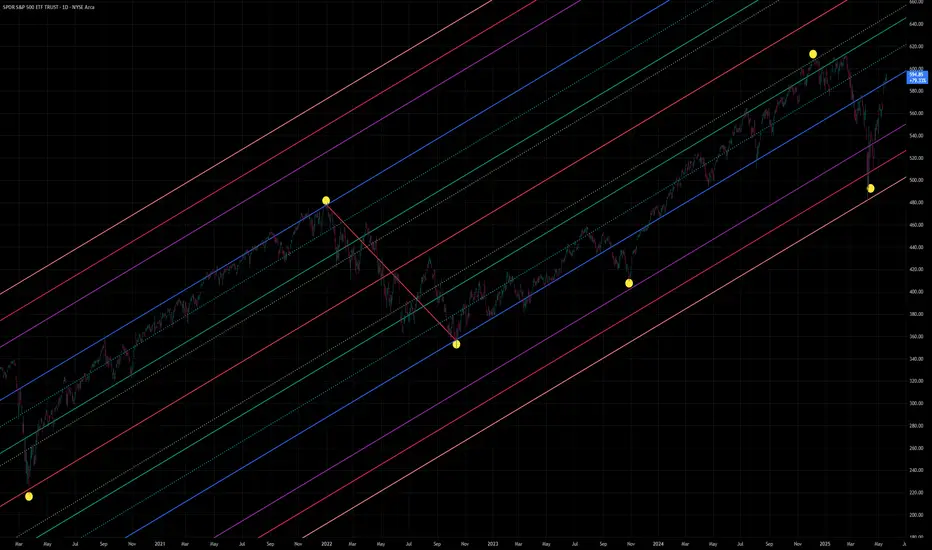
SPY ... intersting levels when view by DXY ratio and pitchforkSame as all my others, so for reference see my earlier ideas for better grasp of what I do...
But when the dollar changes, you must track that with price to see if things are in inflated territory or deflated territory. As in, gold goes up cause the currencies its measured against go down....cant view it another way.
So if SPY is overdone, it should be higher than previous highs...which the one chart below shows....but the price chart doesn't show it....so if your stock accelerates faster than the currency can devalue....you have potentials for blowoffs and hard reversions.
enjoy:
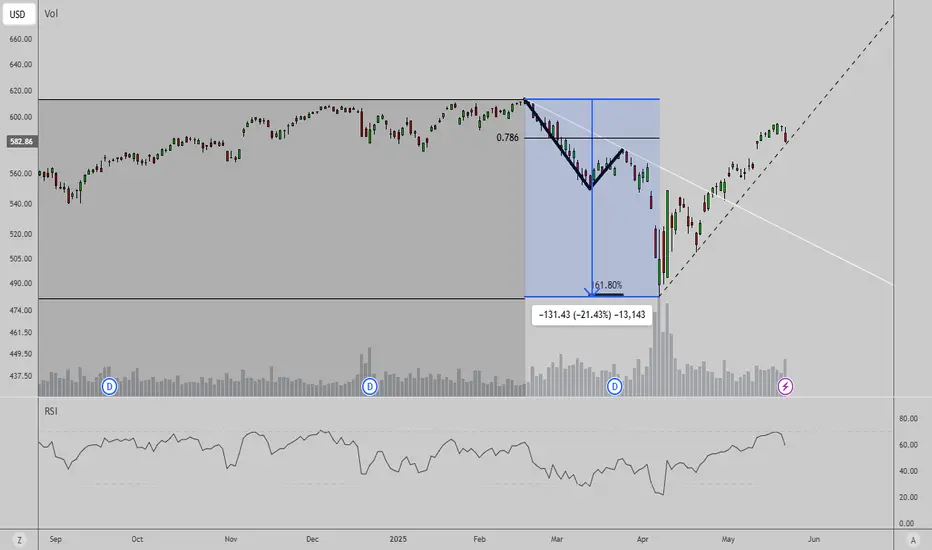
SPY 4H | Smart Money Concepts x Fibonacci ConfluencePrice has rallied into premium territory (above the 0.786–0.886 Fibonacci retracement), tapping into a prior strong high with signs of exhaustion. From a Smart Money perspective, we're entering a high-probability sell-side liquidity sweep zone. 📉
Key Technical Highlights:
🔺 Strong High @ ~613.23 aligning with FVG and premium zone
🔻 Projected retracement target: 560–565 zone (mid-FVG & equilibrium)
⚖️ Equilibrium at ~563 — likely acting as magnet for price
🟦 Demand zone and breaker block overlap between 560–570
📈 Long-term bullish trajectory remains intact if this corrective leg plays out and holds
Bias:
Short-term Bearish: Potential rejection from premium into equilibrium
Mid-term Bullish: If we reclaim the demand zone with strength, we likely re-accumulate and target the ultimate liquidity grab @ 644.46
"Liquidity seeks liquidity. Patience is premium." – Wavervanir DSS
📍Watch for volume confirmation and reaction near 560–570 before scaling in. If invalidated (close above 613), reevaluate bullish breakout scenario.
#SPY #SmartMoney #Fibonacci #Wavervanir #Liquidity #VolumeProfile #OrderBlocks #TradingView #QuantStrategy #PriceAction #SMC

$SPY May 20, 2025AMEX:SPY May 20, 2025
15 Minutes.
The expected retrace did not happen.
588-594 movement has led the 200 averages in 15 minutes to move up gradually.
So, the move 588.1 to 595.53 holding 591-592 levels uptrend intact for 598-599 levels.
This is extension for the move 541.52 to 568 to 556
AMEX:SPY weak below 590-589.

Nightly $SPY / $SPX Scenarios for May 20, 2025🔮 Nightly AMEX:SPY / SP:SPX Scenarios for May 20, 2025 🔮
🌍 Market-Moving News 🌍
📉 Bear Market Concerns Emerge
Veteran investor David Kotok warns of a potential bear market, projecting that tariffs could reduce S&P 500 earnings per share from $260 to $230 over the next year. This outlook suggests a possible decline of the index to the 4,000–4,400 range, with elevated Treasury yields further pressuring valuations.
🚢 Retail Inventory Challenges Amid Tariff Uncertainty
The Port of Los Angeles reports potential lower inventories for retailers due to ongoing U.S.-China tariff uncertainties. Despite a temporary 90-day tariff reduction, complexities in forecasting cargo volumes persist, potentially leading to fewer product choices and rising prices for consumers.
🛍️ Retail Earnings Spotlight
Major retailers, including Home Depot ( NYSE:HD ), are set to report earnings today. Investors will closely monitor these reports for insights into consumer spending patterns amid economic uncertainties.
💬 Federal Reserve Officials Scheduled to Speak
Federal Reserve officials, including Richmond Fed President Tom Barkin and Boston Fed President Susan Collins, are scheduled to speak today. Their remarks will be scrutinized for indications of future monetary policy directions.
📊 Key Data Releases 📊
📅 Tuesday, May 20:
10:00 AM ET: Labor Force Characteristics of Foreign-born Workers (Annual 2024)
10:00 AM ET: State Job Openings and Labor Turnover for March 2025
⚠️ Disclaimer:
This information is for educational and informational purposes only and should not be construed as financial advice. Always consult a licensed financial advisor before making investment decisions.
📌 #trading #stockmarket #economy #news #trendtao #charting #technicalanalysis

Rising wedge on SPY - Melt up? or Next leg down? Immediate Bias (Tomorrow):
Scenario 1 – Bullish Continuation (Low Probability unless there's a macro catalyst):
Breaks above ~$596–$598 cleanly
Retests that zone as support (watch 595.50 intraday)
Then targets:
600 psychological
604–608 upper resistance channel
Possible end-of-month blow-off top: 612–618
Scenario 2 – Pullback / Rejection (More Probable Setup):
Rejected at ~596–597 zone (which aligns with upper wedge resistance)
Breakdown below $590 intraday
Then targets:
587.80 EMA cluster (20/50)
If lost → 576.44 next EMA + demand level
Followed by major support at 565.87 / 563.43
🔥 Week Ahead Trade Plan (May 20–24)
✅ Bullish Possibility:
If NVDA earnings, FOMC minutes, or macro data surprise to the upside
Watch for breakout above the red wedge and hold above 600
Target range: 604 → 612 max upside
🚨 Bearish Scenario:
Wedge breakdown below ~$590
Momentum cracks down to:
587
576 (watch for bounce)
If panic selling → 565–563 (larger time frame buying zone)
Volume divergence and overbought EMAs support a potential cool-off.
📅 Monthly Projection (End of May):
If wedge breaks down → consolidation range between 563 – 587
If wedge breaks out → blow-off rally up to 612–620, but likely to fade quickly
Fed commentary and NVDA earnings on May 22 will be major catalysts
📌 Key Levels
Type Price Notes
Resistance (R3) 612–618 Final upside blow-off zone (channel top)
Resistance (R2) 604 Overhead channel line
Resistance (R1) 595–598 Wedge top + major resistance
Support (S1) 587 EMA cluster + strong local demand
Support (S2) 576 Clean structure + prior breakout
Support (S3) 565–563 Confluence of long-term EMAs + trendline
🎯 Trade Setups
📉 Bearish (Favored if no breakout tomorrow):
Short 595–597 with stop above 600
Targets: 587 → 576
Optional: Add below wedge break (~590)
📈 Bullish (Confirmation-based):
Break + retest of 597–600
Target: 604, then scale out at 612
Avoid front-running long unless you see volume + price close outside wedge
$SPY // May 19 2026 // Analysis & Targets for Day TradersAMEX:SPY // May 19 2026 // Analysis & Targets for Day Traders
Let's see if the downgrade respects where options closed on Friday

SPY/QQQ Plan Your Trade For 5-19 : Gap Breakaway In Trend ModeToday's pattern suggests the SPY/QQQ will start with an opening price GAP (downward in this case) and could continue to move into a Breakaway pattern.
Given the recent news of a US Credit Downgrade, I'm suggesting all traders prepare for what may become a period of sideways price volatility over the next 3-5+ days.
I've highlighted a potential breakdown range on the SPY/QQQ on my charts that I believe acts as a solid confirmation level related to any potential reversal/breakdown in trend.
Currently, the trend is still BULLISH. If price falls below my breakdown range (the angled rectangle on my charts) - then I believe price will have broken this upward FLAGGING trend channel and will begin to move downward - targeting lower support levels.
This is a critical time for the markets. If we fail to move higher at these levels, we have a long way to go (downward) before we attempt to find any support.
Gold and Silver appear to be attempting to break the FLAG HIGH of an Inverted Excess Phase Peak pattern. This could prompt a strong rally phase back above $3300/$33 for Gold/Silver over the next few days. Time will tell how things play out.
BTCUSD appears to be REJECTING the recent highs within a consolidation range. If this rejection continues, I see BTCUSD moving downward - trying to reach the $95k (or lower) looking for support.
Remember, we are still generally BULLISH and moving upward within the FLAGGING channel. If we do get a breakdown in price over the next few days, it will become clearly evident on the charts and we'll have to begin to change our expectations.
Right now - HEDGE.
Get Some...
#trading #research #investing #tradingalgos #tradingsignals #cycles #fibonacci #elliotwave #modelingsystems #stocks #bitcoin #btcusd #cryptos #spy #gold #nq #investing #trading #spytrading #spymarket #tradingmarket #stockmarket #silver
