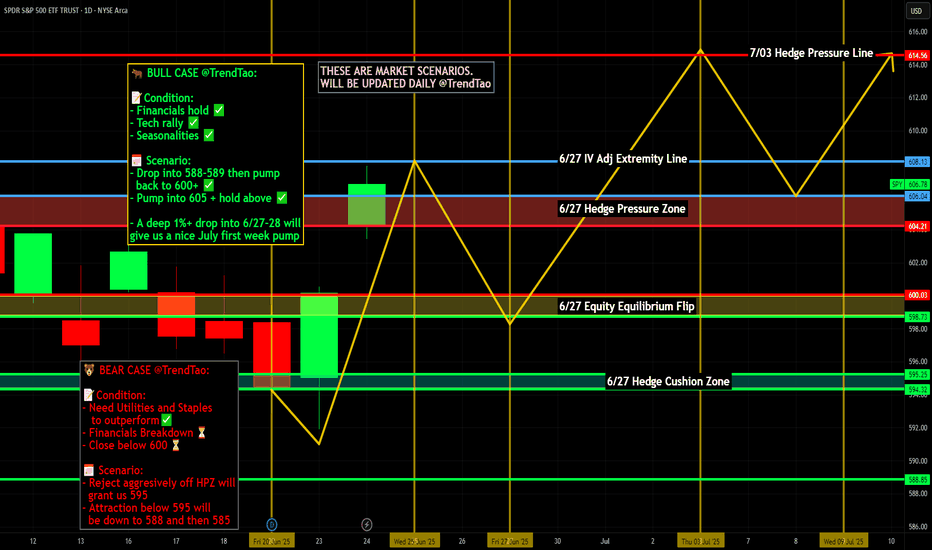
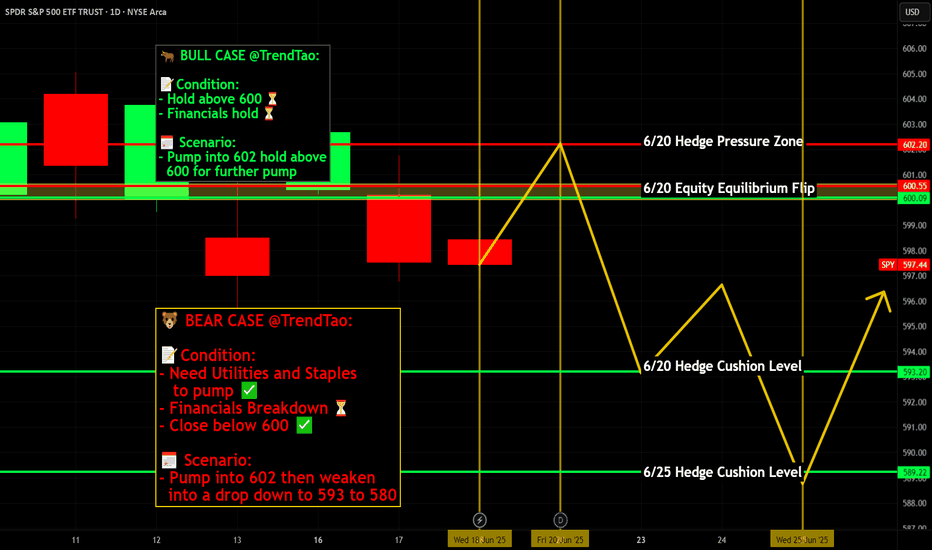
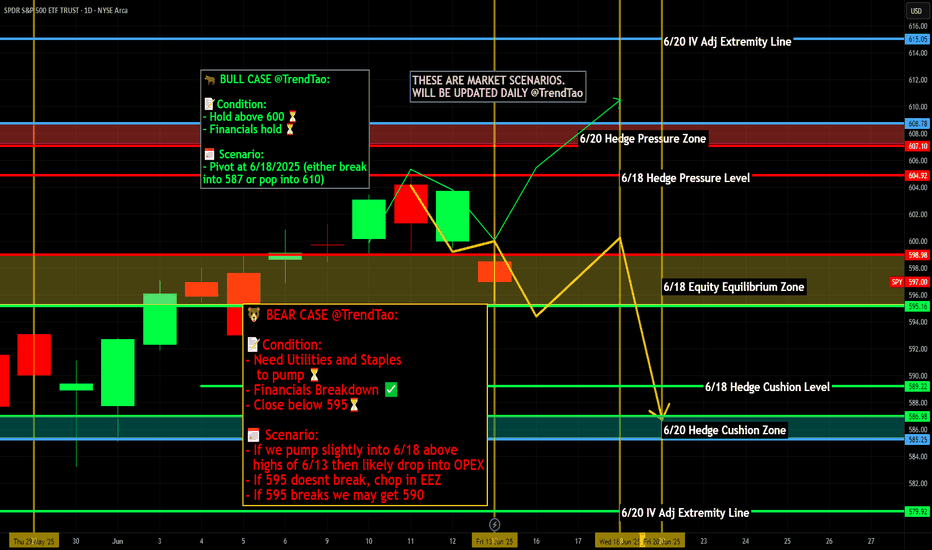
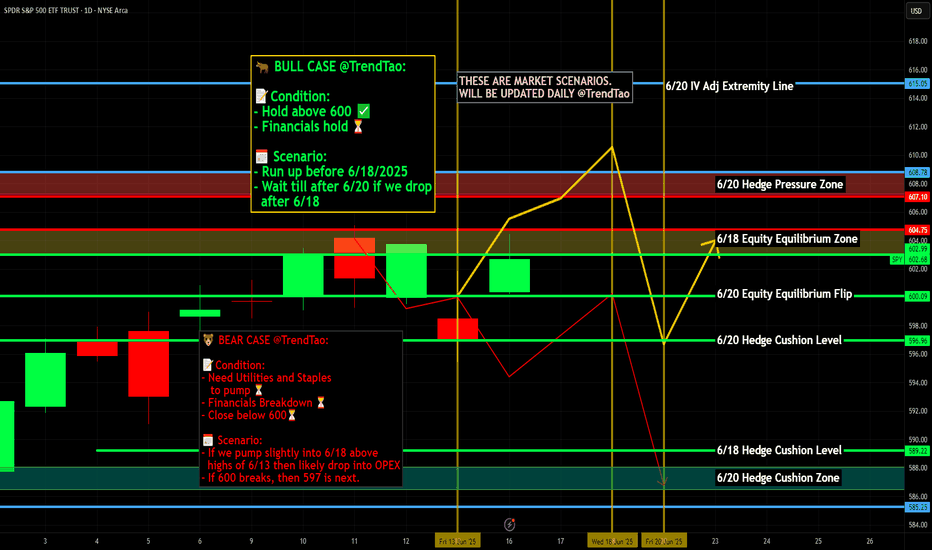
Nightly $SPY / $SPX Scenarios for June 25, 2025🔮 Nightly AMEX:SPY / SP:SPX Scenarios for June 25, 2025 🔮
🌍 Market-Moving News 🌍
💱 Dollar Slides on Middle East Ceasefire Optimism
A fragile ceasefire between Israel and Iran lifted risk sentiment across global markets. The U.S. dollar weakened, while the euro and British pound hovered near multi‑year highs
📈 Equities Near Record Highs
The S&P 500 and Nasdaq pushed toward all-time highs on June 25, supported by the Middle East truce and retreating energy prices. The S&P 500 rallied ~1.1%, with tech and discretionary sectors leading the charge
🛢 Oil & Treasuries Dip, Yield Cuts Anticipated
Oil plunged ~6% to ~$65/bbl as conflict fears eased. Softer prices plus weak consumer confidence spurred expectations of up to 60 bps in Fed rate cuts by December; Treasury yields pulled back accordingly
📉 Consumer Confidence Falls Again
The Conference Board’s index dropped to 93—the lowest level since May 2020—as concerns over tariffs and job availability weighed on households
📊 Key Data Releases 📊
📅 Wednesday, June 25:
(No major U.S. economic data scheduled)
Markets remain focused on geopolitical dynamics, Fed commentary, and next week’s PCE inflation release.
⚠️ Disclaimer:
This information is for educational and informational purposes only and should not be construed as financial advice. Always consult a licensed financial advisor before making investment decisions.
📌 #trading #stockmarket #economy #geopolitics #Fed #inflation #technicalanalysis
SPY trade ideas
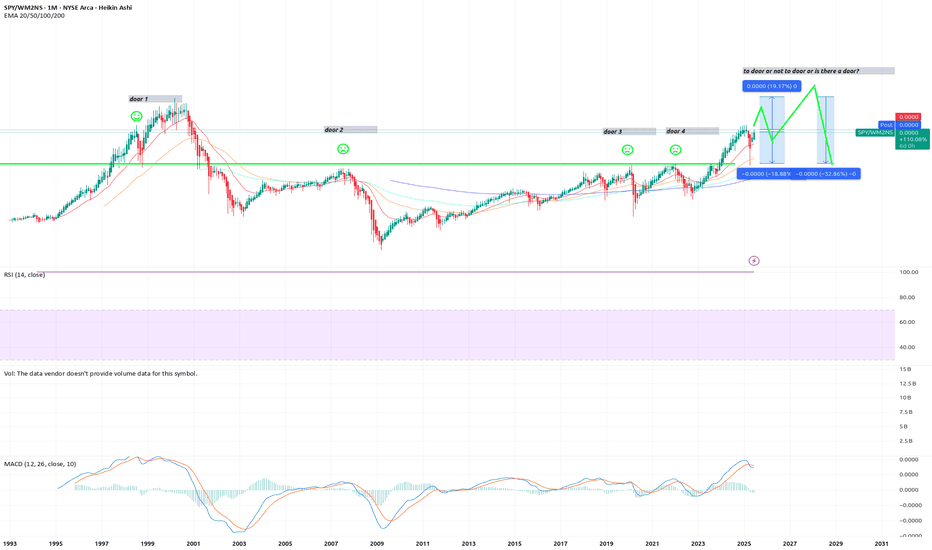
6/24/25 - $SPY - punchbowl musings. moar upside into YE.6/24/25 :: VROCKSTAR :: pondering $SPY/M2
I'll attempt to keep this punchy.
- Moar upside into YE, but with a few bumps along the road. We're probably due for a small garden variety pullback sooner vs. later. And it should be bought, without flinching. Index options are easiest and lowest risk way to play this trend, unless u like single names like me :)
- I look at the above chart SPY/M2 (so S&P divided by M2) a lot
- The last time it grabbed my interest was earlier this yr before the market did it's lil dip, now it's grabbing my interest again since we've played out a bottom and a recovery
- I wonder... is px action going to follow '98 (door 1) or the trapdoors of '08/09 (door 2)/ '20 (door 3)/ '22 (door 4).
- I suspect it's closer to '98 (and btw had this thesis before seeing the recovery in the last two months, so it's played out)
- While any event can cause the market to reset another 20-30% from here, the problem is "we don't have this event". Clearly war (at least an escalating one, not a multi-week headline-driven one - sad as any war is) won't do it. Also the Fed is just about telling Trump to suck the long one... and even that rates might go higher, but the mkt also is either ignoring this/ or frankly- might acknowledge it and doesn't care. Also we have a consumer recession on the horizon - this is no surprise to many of us. Market still doesn't really care. So what kind of event is it?
- Well in door 2 we had a pretty gnarly set of defaults in US housing. Will this happen again? Probably not in housing, there will be pockets, yes. But these sorts of things typically don't repeat, esp with the money printer locked and loaded.
- Door 3 was a "pandemic" (quotes intended) which freaked everyone out. Well played Klaus. But doubtful that card can be re-played without also seeing the money bazooka locked and loaded.
- Door 4 was rates FINALLY seeing liftoff after over a decade. But now they're pretty restrictive. Can they get more restrictive? Sure. But will they go up another 2...3...4...%? Unlikely. Direction ultimately is probably lower *eventually*, even if there's a bit more economic pain on mainstreet.
- So door 1 is somewhat unique. The market doesn't remember that timeframe well. And it feels like tech is back in that sweetspot. Mag 7 (just use QQQ on it's IWM- small cap pair) so QQQ/IWM or even SPY/IWM (both contain similar mag 7 weightings) shows no brakes. Hard to see why I'd rather pay 15 or 20x for a small cap with mid singles growth and no margin or moat vs. say NVDA at a slight premium. You get the point. So I think we're back there.
- Does that mean we get a garden variety pullbacks here/there along the way as headlines hit? Probably. I see a lot of crazy 0dte'ing all over the place. The cheapest and probably most profitable way to play that would simply be sticking to index options, tbh. But alas, that's not a 10 or 20x ;)
- Could a consumer recession in 2H keep stonks flat or only +5-10% higher capped until we can see "beyond"? Maybe. But remember, the big leaders (most Mag 7) are B2B and AI-driven. So you can paint an earnings story (lower costs b/c of tech) even if the top-lines are challenged. Again, let's see.
- Alas people have been DM'ing me "WHY ARE YOU SHORT?"
- Simply put, I have conviction in a very few number of things right now on the long side. I do think the market will tend to see higher highs, and there's not an obvious reason why that ends, just yet. And the market needs a reason to go down, not up.
- However, a lot of ETFs I've found to short are offering me ATM exposure for 5-10x leverage for very very little premium (low IV) relative to picking and banging my head causing brain damage to keep identifying the single names. Most of these ETFs own "the same company" which all trade correlation 1... so in any garden variety pullback, they will all trade v similarly and so I'd rather just pay less for the hedge.
- Therefore I remain with high BTC exposure (vis a vis OTC:OBTC ) at nearly 50% of my book. I think this converts to ETF in the next 90 days, giving me another 10-12% pop (as it's 88-90% discount to spot). Therefore, I can pack just a 1.4% IBIT ATM short (vis a vis puts) for nearly half this exposure. If BTC runs, as I expect, but can't predict exactly (EVEN IF THE CONVERT DOESN'T HAPPEN), I lose the 1.4% but probably pick up a solid 10...15...20% on this OBTC exposure. Seems like a good hedge.
- Same thing for BUG, ROBT, UFO... IV is just low. These are all correlation 1 baskets. They let me offset my NXT and GAMB size. That's all. I'm not calling "SHORT IT ALL" but rather, if things keep running "yes" i'll make less... but I believe my long exposure OBTC/ NXT and GAMB will outrun these ETFs. And even if they are similar in px action... I'll just make less, but it will still be positive.
- Now if the market really does puke 10-15 or 20%... I'll take these shorts and just deploy across all the work on single names I like. V likely the usual suspects are the one's I've written about and I'd size these up. King among them will be BTC.
Hope that helps. I like looking at this chart. Perhaps you have one that catches your attention too... that allows us a glimpse around what inning we're in.
The TL;DR is I think we're in inning 7 of this multi-decade run. I'd guess a true top gets put in in the coming years. But unlikely this year. And I'd be surprised if we retest the Mar/ Apr lows. Dips of the 5-10% size should be bought aggressively, not feared.
Alas who knows. I don't have a crystal ball.
V
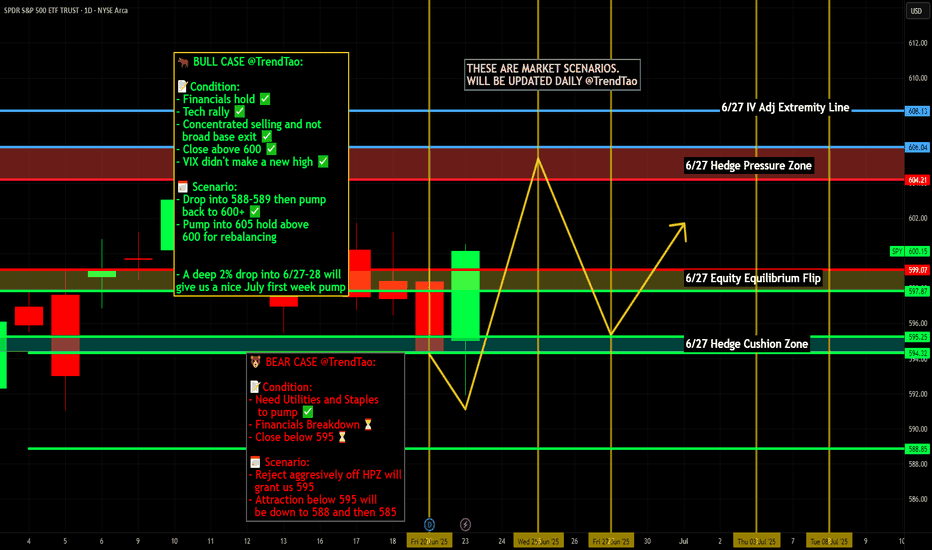
Nightly $SPY / $SPX Scenarios for June 24, 2025🔮 Nightly AMEX:SPY / SP:SPX Scenarios for June 24, 2025 🔮
🌍 Market-Moving News 🌍
🇺🇸 Markets Eye Powell Testimony & Consumer Confidence
Today brings a double dose of market-moving data: the June Consumer Confidence Index and Fed Chair Jerome Powell’s testimony before Congress. These will be key indicators of household sentiment and potential shifts in Fed rate guidance
🛢️ Oil Volatility Persists on Middle East Strain
Oil prices briefly spiked after U.S. strikes on Iran’s nuclear facilities, prompting fears of supply disruptions. However, prices have since dipped as ceasefire hopes emerge. Investors remain cautious on energy headwinds
💱 Dollar Retraces on Safe-Haven Rotation
The dollar softened after peaking as geopolitical tensions eased slightly. Still, it remains sensitive to Powell’s tone and confidence data, which could reintroduce volatility
📊 Key Data Releases & Events 📊
📅 Tuesday, June 24:
10:00 AM ET – Conference Board Consumer Confidence (June)
Monitors household optimism; a rebound could support consumer spending and equities.
10:00 AM ET – Fed Chair Powell Testimony Begins
Powell appears before the House Financial Services Committee. Market focus: inflation outlook, tariffs, and potential timing for rate cuts.
⚠️ Disclaimer:
This information is for educational and informational purposes only and should not be construed as financial advice. Always consult a licensed financial advisor before making investment decisions.
📌 #trading #stockmarket #economy #Fed #trade #energy #technicalanalysis
June 27th, 2025 - Morning BriefFriday, June 27, 2025. Markets are on the edge, and if you thought summer would bring calm, think again. Today’s script is pure adrenaline.
Overnight, the U.S. and China finally inked a trade deal that actually matters: tariffs are coming down, and rare earths are flowing again. Tech and manufacturing stocks are already celebrating, with SP:SPX and CME_MINI:NQ1! futures inching toward fresh record highs. NASDAQ:NVDA is still the market’s favorite lottery ticket, hitting another all-time high. Meanwhile, NYSE:NKE just spiked 10% premarket after beating earnings. Never mind the $1 billion tariff punch, they’ll “manage it.” Sure.
But the real show is the May PCE inflation data dropping this morning. The Fed’s favorite gauge is expected to tick up to 2.3% year-over-year, with core PCE at 2.6%. If the numbers surprise, brace for whiplash in rates and risk assets. GDP’s third estimate confirmed a -0.5% contraction in Q1, so the “soft landing” crowd is sweating. Jobless claims and new home sales hit at 10:00 AM ET. Expect every algo on the Street to be watching.
Trump is making noise about firing Powell before 2026, which has traders betting on earlier rate cuts. If you’re looking for stability, you’re in the wrong casino.
Here’s where things stand:
- OANDA:XAUUSD : $3,280–$3,334/oz (slipping as risk appetite returns)
- BLACKBULL:WTI : $65.64–$65.82/barrel (steady, but one headline away from chaos)
- BINANCE:BTCUSDT : $107,215–$107,477 (down, but still a six-figure fever dream)
- CME_MINI:ES1! : Hovering just below the 6,144 record
Today’s takeaway: The market’s running on hope, caffeine, and denial. Stay sharp, one bad print and the rally could turn into a stampede for the exits. Welcome to the volatility vortex.
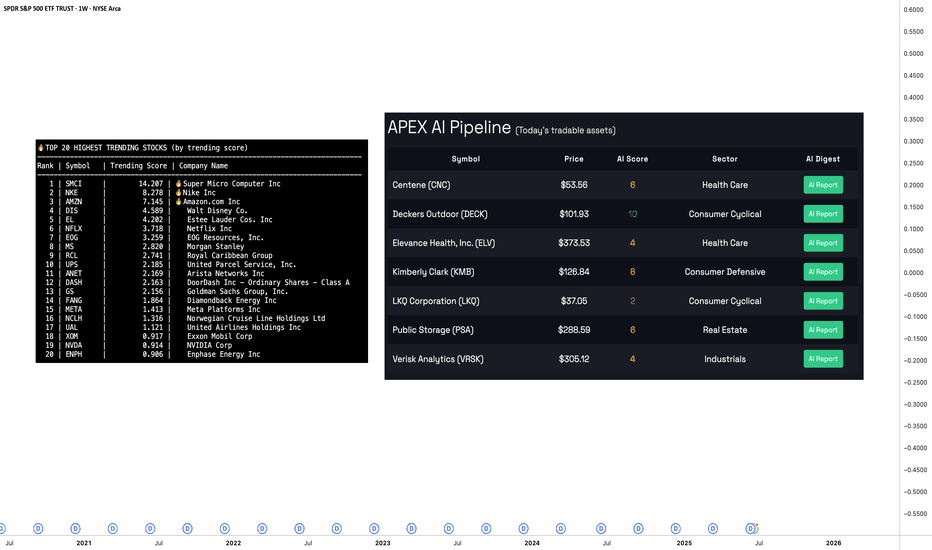
Been building something for US swing traders — if you’re one, I’d really appreciate your feedback. Free to test, link in Bio
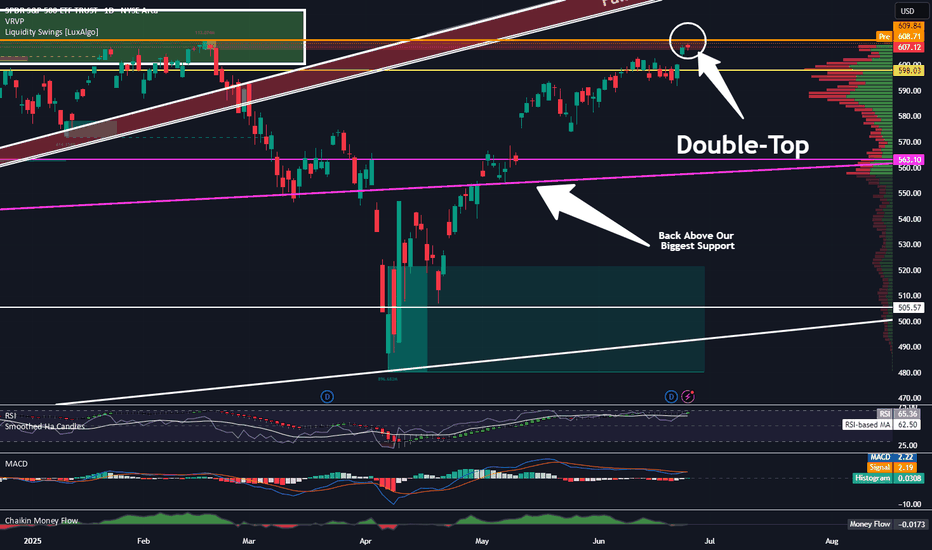
What Is The Market Waiting For?Good Morning Trading Fam,
Our stock and crypto markets seem to have stalled. You may be wondering what they are waiting for. Quite simply, the S&P 500 has reached a double-top. That's all. There may be some more pause here for the next week or so. Barring any significant bearish geopolitical or other events, I expect us to move higher. Any FUD at all will send the market back down again. So yes, unfortunately, the next move(s) will be mostly predicated on news. Traders are rather fragile rn. Trade accordingly.
Best,
Stew
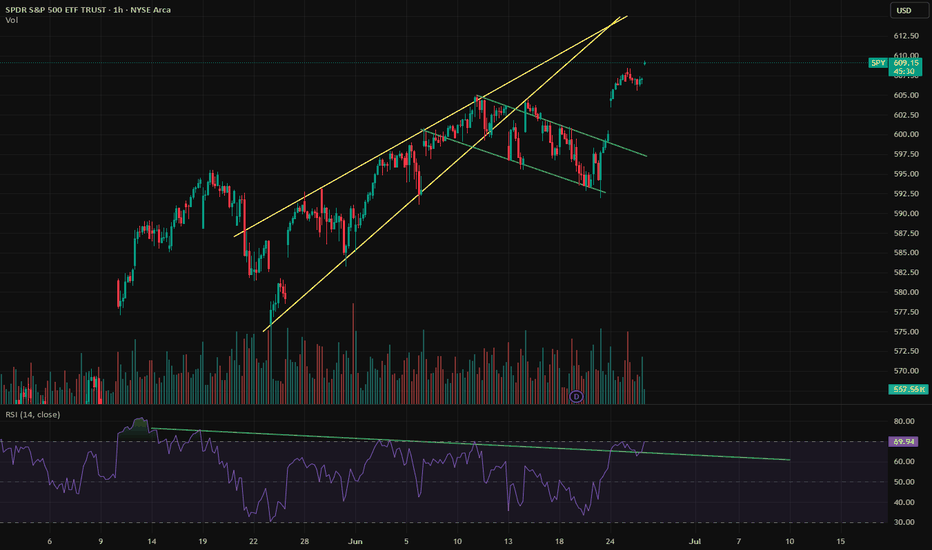
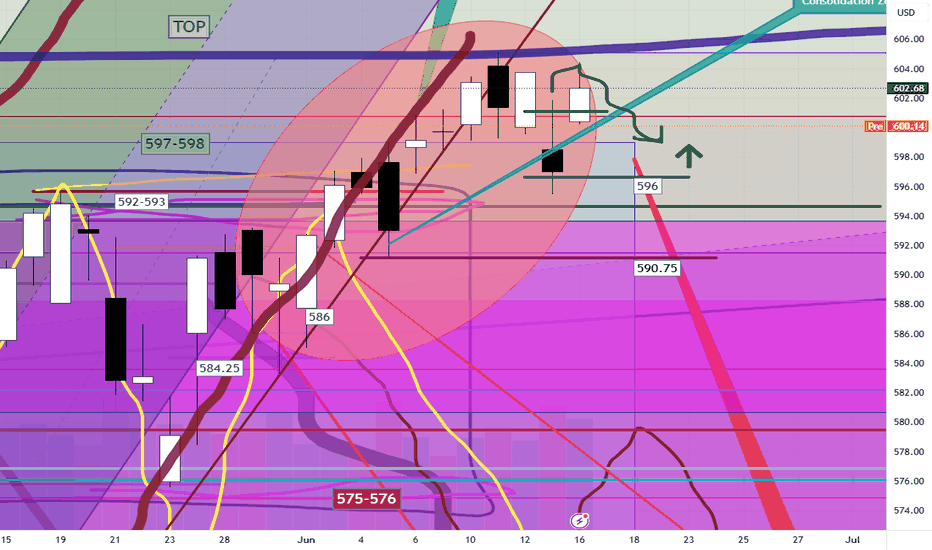
SPY (S&P500 ETF) - Price Bouncing Up from Support after NewsSPY (S&P500 ETF) price has bounced up from the $593 support level after recent global news (de-escalation news).
Price action has slowed and consolidated in June 2025, and the S&P500 is still maintaining a price uptrend.
The 50EMA and 20EMA Golden Cross is still active and in progress (since May 2025).
The next stock market earnings season is not for another 3 months. Inflation, interest rate news, global events, government news, corporate news will continue to affect price volatility this summer.
Resistance Levels: $604, $610, $612, $619.
Support Levels: $600, $593, $586, $579.
SPY/QQQ Plan Your Trade For 6-16 : Up-Down-Up PatternToday's Up-Down-Up Pattern suggests the markets will transition into a moderate upward trending price bar - which is quite interesting in the world we have today.
War and a big weekend of events, protests and other new items could drive market trends over the next few days.
Still, the SPY Cycle Pattern for today is an Up-Down-Up - which suggests last Thursday was an Up bar, last Friday was a Down bar, and today should be an Up bar.
The Gold/Silver pattern is a POP pattern in Counter-trend.
I believe the US markets are benefiting as a safe-haven for capital as the global turmoil drives global investors to seek safety and security for their capital.
That means as long as the world continues to spin out of control, the US markets and the US-Dollar will act as a moderate safe-haven for capital.
Gold and Silver should also benefit from this global chaos.
Bitcoin is benefiting from the strength of the US markets (and the technology sector) as well.
Let's see how this week start to play out. I'm waiting for some more news.
Could be very interesting this week.
Get some.
#trading #research #investing #tradingalgos #tradingsignals #cycles #fibonacci #elliotwave #modelingsystems #stocks #bitcoin #btcusd #cryptos #spy #gold #nq #investing #trading #spytrading #spymarket #tradingmarket #stockmarket #silver
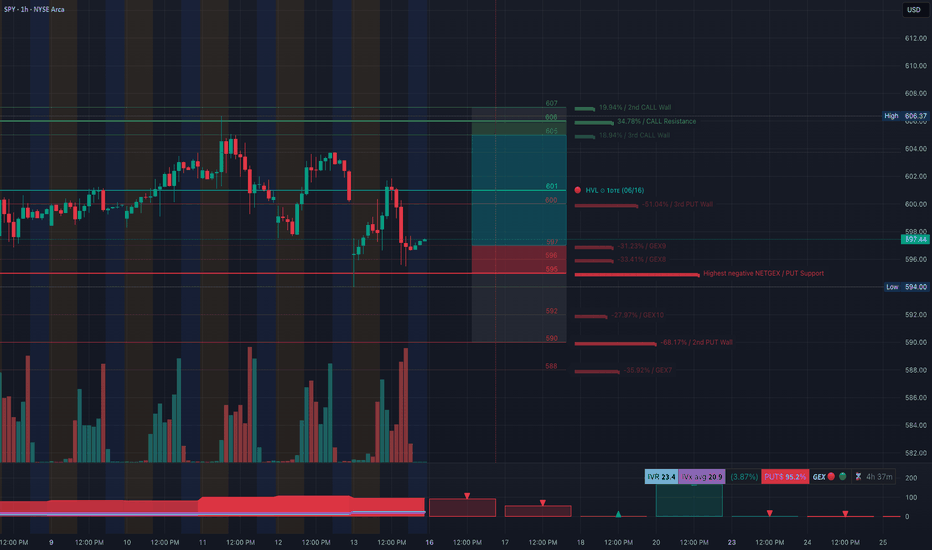
SPY Technical Analysis - Jun 16⏱️ 1‑Hour Chart Overview
Key Zones
* Support: $597–$601 — built on put-gamma support
* Resistance: $605–$607 — topped by call-gamma walls
Bias: Cautiously bullish — awaiting confirmation above $600–601
Trade Idea:
* Structure: Bull call spread (600/605 strikes)
* Targets:
* T1: $605 (initial gamma cap)
* T2: $607 (upper gamma wall)
* Invalidation: Break decisively below $595
Management:
* Entry: Buy near $600–601 with bullish candle and supportive volume
* Scaling: Start small and layer in if price holds
* Exit:
* Take partial profits at $605
* Trail to $607
* Exit if SPY drops below $595
Why It Works: Gamma flows from option expiries tend to provide momentum near the spread’s strikes, and the debit structure defines both risk and reward.
⏳ 15‑Minute Chart (Intraday Entry)
Setup Window: Zooming in for precise entry within 1‑hour framework
What to Observe
1. Pullback to $600–601
* Look for a bullish reversal candle (hammer, engulfing) on 15‑m
* Ideally, with increasing volume
2. Confirmation Signal
* Break above the high of that reversal candle
* Volume support confirms genuine demand
3. Momentum Alignment
* Pair with an intraday oscillator (e.g., Muscle mover, RSI rising)
* Candles should show higher lows or extended wick above support
15‑Minute Trade Rules
* Entry: Market or limit buy on a 15‑m candle closing above reversal high (~$601)
* Stop: Under that candle’s low (e.g., ~$599.50)
* Profit Scaling:
* Partial de‑risk at ~$605
* Full exit planned at ~$607
🚦 Multi‑Timeframe Strategy Summary
1‑Hour: Macro bias and strike framework
15‑Min: Precision entry zone & risk control
Spread Trade: Leverages GEX structure for momentum capture
Risk Defined: Debit known, stops clear
Upside Potential: Push toward gamma-neutralizing walls
Flow Edge: Option hedging dynamics predominantly active around spread levels
🧠 Watchlist
* Price behavior near $600–601 on 15‑m
* Volume surge with bullish candle
* Macro drivers: Fed noise, SPX futures action, sector rotation
* Shifts in implied volatility that may affect spread pricing
Trade with discipline — defined risk, entry precision, steady management.
Disclaimer: Not financial advice. All trading involves risk; do your own due diligence.
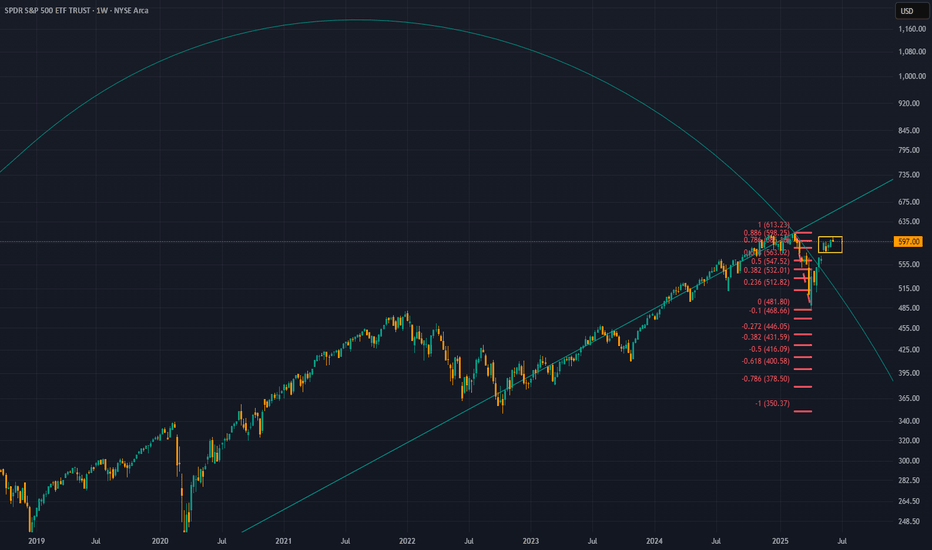
$SPY – Bearish Momentum Meets Spiral Timing🌀 AMEX:SPY – Spiral Timing, Macro Tension, and Bearish Momentum Brewing
Not financial advice. Short-term sentiment shifted bearish.
I’ve been tracking AMEX:SPY using both Fibonacci retracements and Fib spirals across the daily and weekly timeframes, and we’re now at a critical inflection zone. My sentiment has shifted more cautiously bearish in the short term, while acknowledging upside remains intact on the longer timeframes.
🔍 Macro Backdrop: Pressure Building
CPI Data (May) came in at 2.4%, slightly higher than April’s 2.3%, but still below forecast — showing inflation is sticky but not accelerating.
Geopolitical tensions between Israel and Iran flared again over the weekend, adding risk-off pressure to already fragile sentiment.
Market volatility remains high, with trillions of dollars swinging across a narrow window — validating shorter Fib cycles and accelerated price exhaustion.
🧭 Daily Chart Analysis: December 2024 High → April 2025 Low
I used a bearish Fib retracement from the December 2024 highs to the April 2025 lows.
SPY has now retraced nearly 100% of that drop, currently hovering between the 0.786 and 0.886 retracement levels — which often act as exhaustion zones in corrective rallies.
The Fib spiral from the April low shows we’ve lost the initial vertical trendline that marked the recovery leg — a shift in momentum tone.
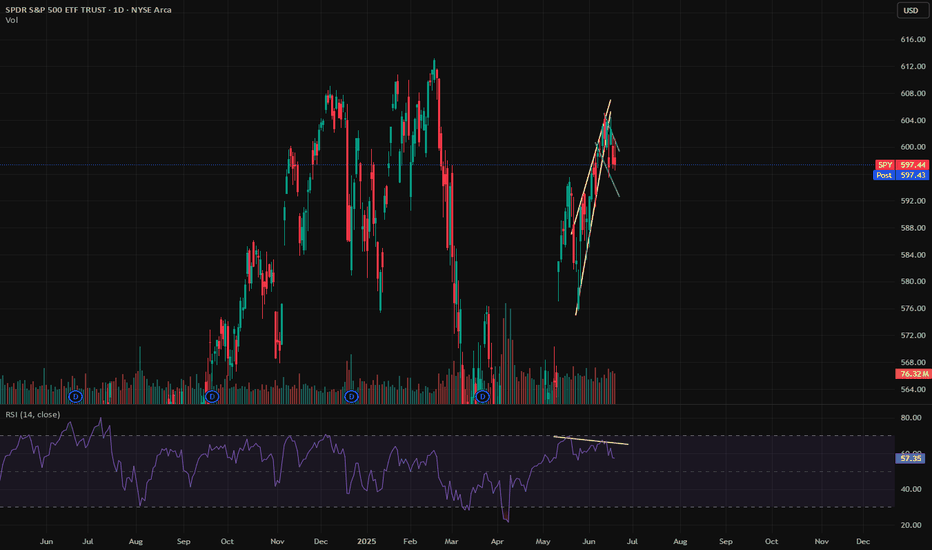
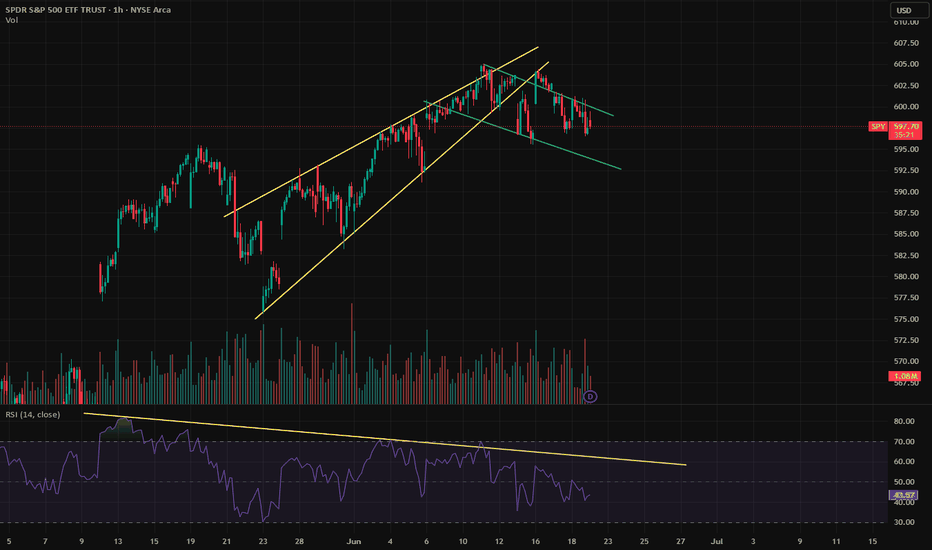
MACD has remained flat for 16 sessions, with a bearish divergence confirmed on Friday (6/13/25).
Momentum, which briefly turned positive on Thursday, flipped sharply back negative by week’s end.
📆 Weekly Chart Structure: March 2020 → Feb 2025
The weekly spiral, drawn from the March 2020 low to the February 2025 high, reflects a similar pattern:
→ Price is moving beyond the arc and approaching the vertical time marker, a zone where reversals or expansions often occur.
Long-term trend remains bullish, but short-term action suggests compression ahead of a possible pullback.
🔥 Spiral Interpretation Reminder:
The Fib spiral doesn’t predict direction — it identifies time-based pressure points.
When price crosses the arc or vertical band, volatility often follows.
🎯 Key Trade Levels:
Breakdown Watch:
→ Close below $595, then $587 could trigger downside toward $560 (0.618) and $545 (0.5) levels from the retracement
Breakout Watch:
→ A confirmed breakout above $609 (full retrace from the Fib) would invalidate the short-term bear thesis and resume bullish continuation
🤔 Positioning Outlook:
I’m tactically bearish here. The technicals show:
Momentum divergence
Fib exhaustion
Spiral confluence
Macro pressure mounting
I don’t think the long-term trend is broken — but we’re entering a time window for volatility, and that often brings opportunity on both sides. Short setups may offer better risk/reward right now if we see confirmation.
Would love to hear your bias here — bear trap brewing or topping process?
Nightly $SPY / $SPX Scenarios for June 20, 2025🔮 Nightly AMEX:SPY / SP:SPX Scenarios for June 20, 2025 🔮
🌍 Market-Moving News 🌍
🏦 Fed Holds Rates, Warns on Tariffs
Fed kept interest rates steady on June 19, cautioning that tariffs could stoke inflation and slow growth. Inflation projections were raised from 2.7% to 3.0%, while growth estimates were revised lower to 1.4%
🌍 Middle East Risk Drags Markets
Global stocks fell and safe-haven assets surged after U.S. futures weakened amid heightened tensions in the Israel–Iran conflict. Yields were mixed: gold weakened and bonds gained, while oil held steady near seven-week highs
📈 Treasury Yields Edge Higher
Despite safe-haven demand, U.S. 10‑year yields ticked up as markets absorbed the Fed’s updated rate outlook. The yield curve remains elevated ahead of next week’s $38 bn auction of long-dated notes
📊 Key Data Releases 📊
📅 Friday, June 20:
(No major U.S. economic reports)
Markets will be driven by Fed commentary follow-ups and geopolitical headlines over the weekend.
⚠️ Disclaimer:
This information is for educational and informational purposes only and should not be construed as financial advice. Always consult a licensed financial advisor before making investment decisions.
📌 #trading #stockmarket #economy #geopolitics #fixedincome #inflation #charting #technicalanalysis
SPY/QQQ Plan Your Trade for 6-17: Top Resistance PatternToday's pattern suggests the SPY/QQQ will move into a type of topping pattern, attempting to identify resistance, then roll away from that resistance level and trend downward.
I suggest the news related to the conflict between Israel & Iran may continue to drive market trends with traders moving away from uncertainty near these recent highs.
Silver makes a big move higher. Gold will likely follow later this week or early next week.
BTCUSD moves into a sideways FLAGGING pattern - possibly attempting a BIG BREAKDOWN event over the next few weeks.
Overall, the markets look like they are poised for a very big move - just waiting for the GREEN LINK (GO).
Stay safe. Protect capital and HEDGE.
Get some.
#trading #research #investing #tradingalgos #tradingsignals #cycles #fibonacci #elliotwave #modelingsystems #stocks #bitcoin #btcusd #cryptos #spy #gold #nq #investing #trading #spytrading #spymarket #tradingmarket #stockmarket #silver
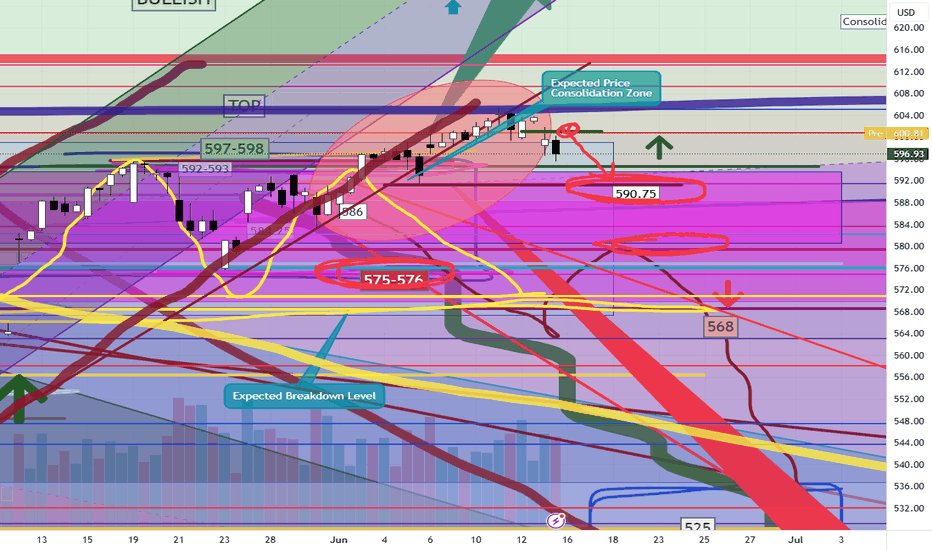
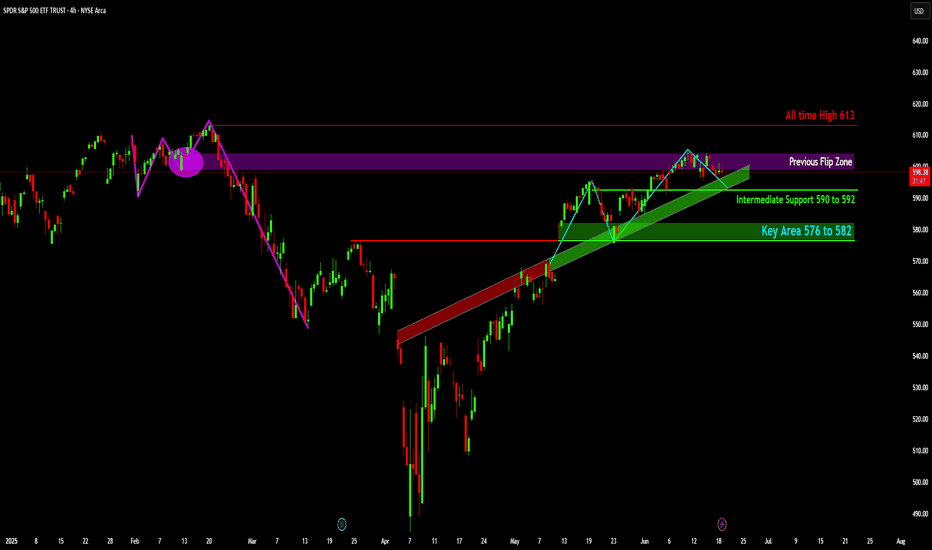
SPY: What's Next After the Resistance Retest?
The price action of SPY, shows a significant decline from early February highs, followed by a strong recovery and an established uptrend from mid-April.
Price is currently testing the "Previous Flip Zone" (indicated by the purple shaded area), a level that previously acted as support before the market's sharp decline and has since been retested as resistance.
The "All time High 613" is marked as a major overhead resistance level, representing the peak achieved before the February drawdown.
An "Intermediate Support" zone is identified between 590 and 592, coinciding with the upward-sloping green trendline that has supported the recent rally.
A "Key Area" of support is highlighted further down between 576 and 582, indicating a more substantial demand zone should the intermediate support be breached.
Disclaimer:
The information provided in this chart is for educational and informational purposes only and should not be considered as investment advice. Trading and investing involve substantial risk and are not suitable for every investor. You should carefully consider your financial situation and consult with a financial advisor before making any investment decisions. The creator of this chart does not guarantee any specific outcome or profit and is not responsible for any losses incurred as a result of using this information. Past performance is not indicative of future results. Use this information at your own risk. This chart has been created for my own improvement in Trading and Investment Analysis. Please do your own analysis before any investments.
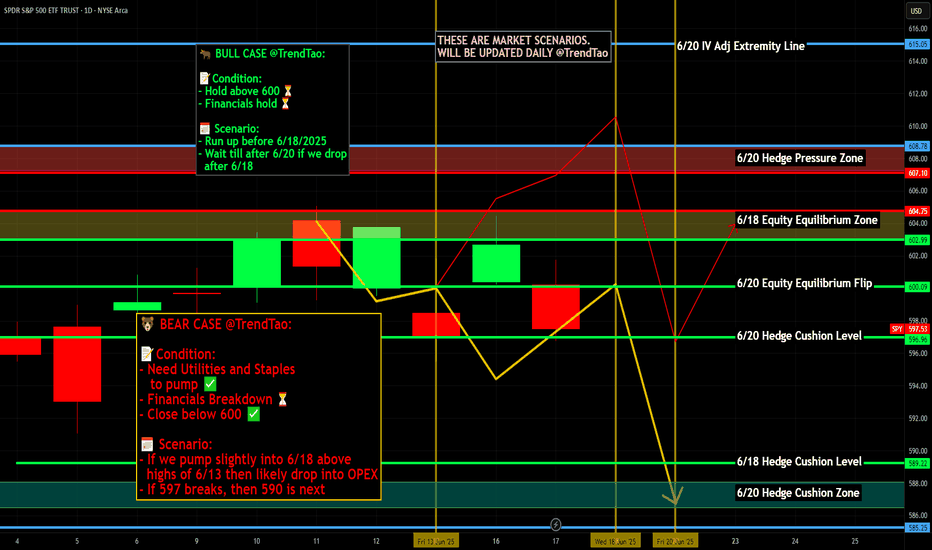
Nightly $SPY / $SPX Scenarios for June 18, 2025🔮 Nightly AMEX:SPY / SP:SPX Scenarios for June 18, 2025 🔮
🌍 Market-Moving News 🌍
💼 Business Inventories Flat in April
U.S. business inventories held steady in April, indicating stable consumer and wholesale demand. That suggests production won't need to cut sharply in the near term, supporting GDP outlook
🏭 Industrial Production Slips
Industrial output declined 0.2% in May, signaling ongoing weakness in factory activity amid less favorable global trade conditions .
🌐 Geopolitical Pressures Persist
Heightened tension in the Middle East continues to pressure risk assets. Investors remain focused on safe-haven flows into gold, Treasuries, and defensive equities, with analysts noting the risk backdrop remains tilted to the downside
📊 Key Data Releases 📊
📅 Wednesday, June 18:
8:30 AM ET – Housing Starts & Building Permits (May)
Measures new residential construction — leading indication of housing sector health.
8:30 AM ET – Initial Jobless Claims
Tracks the weekly count of new unemployment filings — useful for spotting early labor-market weakening.
2:00 PM ET – FOMC Interest Rate Decision
The Federal Reserve is expected to hold steady. Market focus will be on any commentary that hints at future tightening or easing plans.
2:30 PM ET – Fed Chair Powell Press Conference
Investors will parse Powell’s remarks for guidance on rate paths, inflation trends, and economic risks.
⚠️ Disclaimer:
This is for educational/informational purposes only and does not constitute financial advice. Consult a licensed advisor before making investment decisions.
📌 #trading #stockmarket #economy #housing #Fed #geo_risk #charting #technicalanalysis
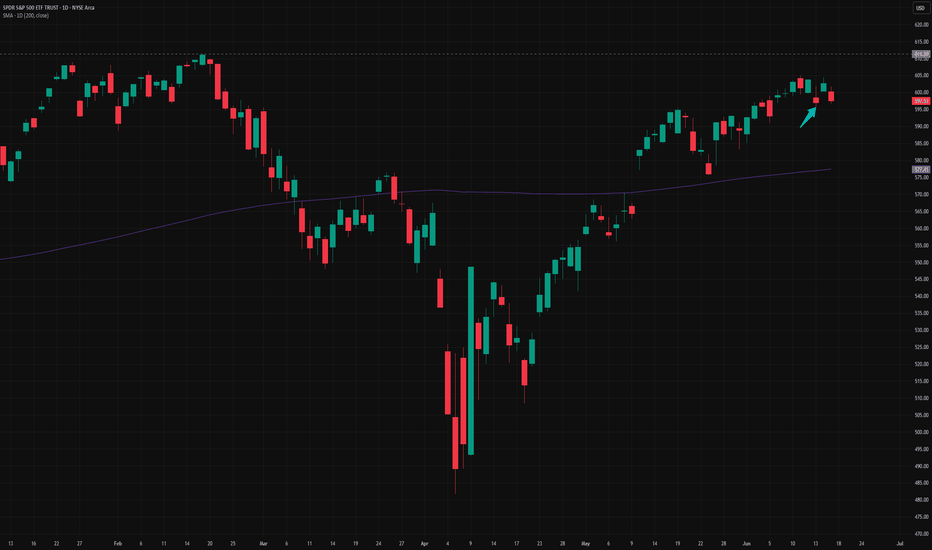
(No) IdeaWhy the handle of "The Uncertain Trader"? Let's check the daily SPY (S&P 500 ETF) chart just after the close of 17 Jun 2025;
I've got no idea where this thing is going.
Thus the handle.
No one has any idea where this is going. If they insist they do they are selling you something. In the words of Brad Hamilton, "Learn it. Know it. Live it".
However, one must form a hypothesis to trade from, right or wrong. And TradingView has excellent tools to do so AND a FREE social network to share such theories.
Back to SPY, I have my suspicions;
SPY closed at 597.53, below it's all-time high of 611.39 (gray line and box) from Feb 19 and above it's 200 day simple moving average of 577.41 (purple line and box). Besides some support at 595.48 (arrow), which is way too close to be useful, and maybe resistance at Wed's high (also too close), there's really no other obvious support or resistance. So, it's ~14 points to the solid resistance at that significant high and ~20 points to support. If one goes long it's 20 points to be proven wrong, 14 points to the good and where the trade will likely stall - not a good reward to risk. Going short is a little better, with 20 points to support with 14 points of risk, but still a rather meager reward to risk.
And now factor in an FOMC meeting tomorrow (Wed 18th). SPY could easily hit one of those marks (2.3% up, 3.4% down), or both, tomorrow afternoon.
The (safer) play is to hold off, stay neutral, and let SPY resolve this, up or down. Let it test/hold it's all-time high or it's 200-day.
Again, I have no idea where this is going - just my theory.
And please, read the following and, again, "Learn it. Know it. Live it";
My ideas here on TradingView are for educational purposes only. It is NOT trading advice. I often lose money and you would be a fool to follow me blindly.
Weekly $SPY / $SPX Scenarios for June 16–20, 2025 🔮 Weekly AMEX:SPY / SP:SPX Scenarios for June 16–20, 2025 🔮
🌍 Market-Moving News 🌍
🏦 Fed Holds Rates, Powell Expresses Caution
The Federal Reserve is widely expected to keep rates at 4.25–4.50%, though Chair Powell likely won’t provide fresh guidance. Markets see limited upside without stronger inflation or growth cues
💱 Dollar Strengthens on Geopolitical Risk
The U.S. dollar rose slightly as investors flocked to safe assets amid global tensions with Iran. Treasury yields eased slightly on risk-off flows
🛢️ Oil Near Multi-Week Highs on Mideast & OPEC Dynamics
Oil held near seven-week highs (~$67–70/barrel), buoyed by Iran-Israel tensions and OPEC+ output hikes (411K bpd added from May–July), offset by demand concerns .
⚠️ G7 Summit Faces Heightened Stakes
G7 finance ministers meet in Canada under pressure from Middle East escalation. Watch for policy coordination and commentary on trade, inflation, and global economic risks .
📊 Key Data Releases & Events 📊
📅 Monday, June 16
Regular markets open after Juneteenth holiday
Quiet day; oil & geopolitical headlines dominate
📅 Tuesday, June 17
8:30 AM ET – Retail Sales (May): Signals consumer spending strength/duration
8:30 AM ET – CPI (May): Confirms inflation trend post-CPI cooler reading
10:00 AM ET – Housing Starts & Building Permits (May): Gauges housing market demand
Unexpected Tesla Robotaxi Demo (Austin): Watch for surprise developments this week
📅 Wednesday, June 18
Global Central Bank Day: FOMC, BoE, BoJ policy updates; U.S. Fed will most likely hold steady
📅 Thursday, June 19 – Juneteenth Holiday – U.S. markets closed
📅 Friday, June 20
8:30 AM ET – Existing Home Sales (May): Measures U.S. housing activity
10:00 AM ET – Leading Economic Indicators (May): Early snapshot of economic momentum
⚠️ Disclaimer:
This information is for educational and informational purposes only and should not be construed as financial advice. Always consult a licensed financial advisor before making investment decisions.
📌 #trading #stockmarket #economy #news #trendtao #charting #technicalanalysis
Nightly $SPY / $SPX Scenarios for June 17, 2025🔮 Nightly AMEX:SPY / SP:SPX Scenarios for June 17, 2025 🔮
🌍 Market-Moving News 🌍
📈 U.S. Retail Spending Holds Firm
May’s retail sales were flat month-over-month, defying expectations of a slowdown. Core retail sales (ex-autos) edged up +0.2%, signaling resilience in consumer purchases—an encouraging sign for economic momentum
🤖 Tesla’s Robotaxi Buzz Accelerates
Tesla stock surged after a weekend robotaxi video surfaced ahead of its planned Austin launch. A viral clip showed a Model Y “robotaxi” navigating traffic autonomously, sparking fresh investor enthusiasm despite safety debates
📊 BoJ Holds Rates; Dollar Edges Higher
Japan’s central bank left policy unchanged at 0.5%, maintaining its dovish bias. This lifted the dollar slightly versus the yen, drawing focus to global interest-rate divergence
📊 Key Data Releases 📊
📅 Tuesday, June 17:
8:30 AM ET – Retail Sales (May)
Consumer purchases are tracked, excluding autos. Monitor if activity stays steady despite inflation and rate pressures.
9:15 AM ET – Industrial Production & Capacity Utilization (May)
Provides insight into factory activity and plant usage—a gauge of economic health amid global slowdown concerns.
10:00 AM ET – Business Inventories (April)
Shows stock levels held by wholesalers and manufacturers. Higher inventories with weaker sales may signal slowing demand.
⚠️ Disclaimer:
This information is for educational and informational purposes only and should not be construed as financial advice. Always consult a licensed financial advisor before making investment decisions.
📌 #trading #stockmarket #economy #news #trendtao #charting #technicalanalysis
