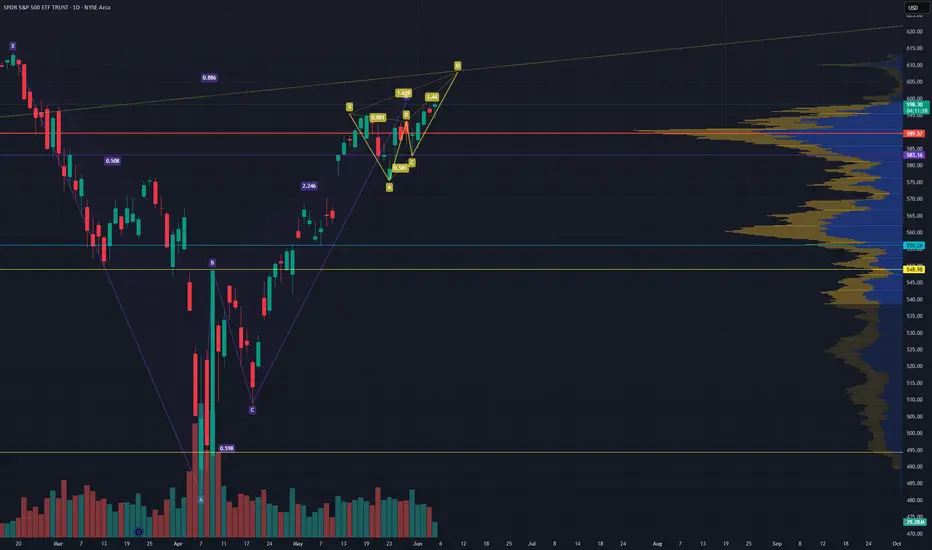
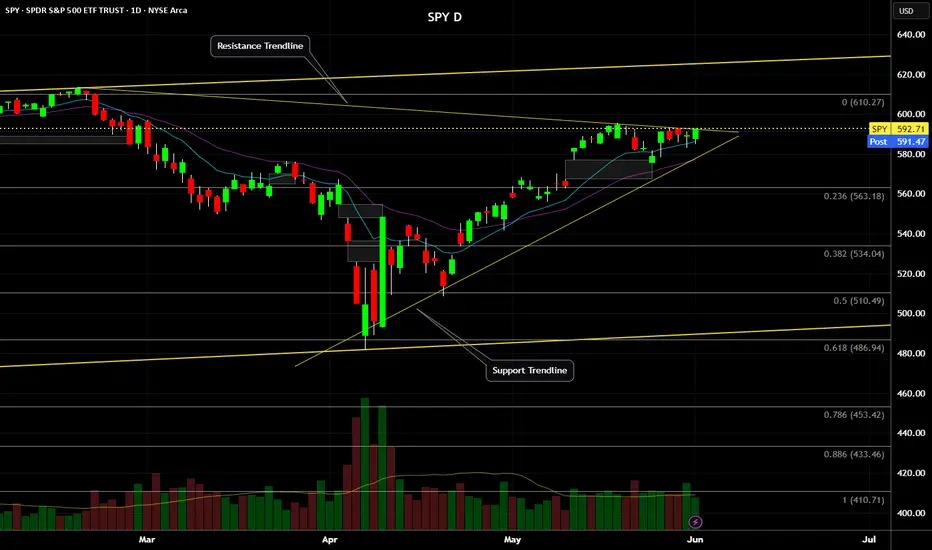
Big BAT Little Deep Crab on SPY WTF is going on with the marketI don't know what to make of this market but the BAT completed and what looked like a cup and handle is starting to look like a BAT and a deep crab. The deep Crab finishes right around a trendline I have that goes way back.
Publishing for tracking purposes
#SPY
SPY trade ideas
SPY/QQQ Plan Your Trade For 6-5 : Inside BreakawayToday's SPY Cycle Pattern is an Inside Breakaway pattern - which indicates the markets want to try to break away from the sideways range I've been sharing with you.
Gold and Silver are making a very big move higher this morning - which may be indicative of some crisis or military conflict move throughout the world.
I see this move in Metals as a bit of a warning to the global markets. Metals hedge global risk levels. A rise in metals suggests traders fear some crisis event and are banking on Silver/Gold as an efficient hedge.
BTCUSD is still trading within the sideways channel as well. I see BTCUSD less as a hedge and more as a technology/Block-chain asset. No matter how you slice it, BTCUSD is not really an alternate currency, it is a Technology asset.
We could see some big moves over the next 2-5+ days because of how the markets are setting up and how Gold/Silver are reacting.
Buckle Up.
Get Some.
#trading #research #investing #tradingalgos #tradingsignals #cycles #fibonacci #elliotwave #modelingsystems #stocks #bitcoin #btcusd #cryptos #spy #gold #nq #investing #trading #spytrading #spymarket #tradingmarket #stockmarket #silver

Thesis on the SPY ETF being rigged (live demonstration 5/5/25)Worlds Saddest Story
I have an algorithm running to find order block's in the form of resistance in the market at any given time. Here I will show the power of computers and how they both effectively and unknowingly create a repeatable system than unfortunately rigs the market to act in predictable ways. This theory will be tested at open today and lucky souls who find this thesis before open will have a rare opportunity to witness these events unfold. The events I am referring to are the SPY ETF opening at or around 597.75~ and immediately creating the high point of the day and promptly descending to create a market drop that exceeds 1% by EOD. While it is rather unfortunate and unfair that the stock market, a once globally competitive market for people to fund ventures, has now turned into a profit making machine for math specialists who have an knack for understanding price movements that inevitably widens the wealth gap for the rich that can afford to invest in computer driven algorithms, while the working man must try to create their own system that CAN NEVER consistently beat the machine.
TL/DR: Bet on the SPY ETF making a high off open and plummeting over 1%

Introduction to HFT Involvement in financial marketsIntroduction to HFT Involvement in financial markets
Market Making algorithms continuously post buy (bid) and sell (ask) limit orders, aiming to earn the bid- ask spread while providing liquidity. HFT market makers function much like traditional market makers but at much higher speed and scale. They simultaneously quote both sides of the market and profit from the small price differential (spread) between bids and asks . Exchanges often incentivize market makers via liquidity rebates (fractions of a penny per share) for adding liquidity, which HFT firms capitalize on through very large trading volumes. Over the past two decades, human specialists have largely been supplanted by automated HFT market makers, which now dominate liquidity provision. Limit orders are prioritized over market orders, which in some capacity is fair; however special order types made for HFT that are just slightly more advanced limit orders are prioritized over regular limit orders but are not accessible by retail investors is very unfair. If you search up the IEX exchange website and look at their order types you can see that they are targeting HFT system creators and retail isn't able to use those products themselves.
Statistical Arbitrage (Stat Arb) strategies use quantitative models to exploit pricing inefficiencies among related instruments. In traditional stat arb, a trading system might track a portfolio of securities and identify when price relationships deviate from statistical norms, betting on convergence. In an HFT context, stat arb often means very short-term, high-speed versions of these tactics, sometimes called “data-driven” or “quantitative” HFT strategies. These strategies are market-neutral and typically involve trading a long-short portfolio of correlated assets based on mean reversion expectations. For example, an HFT stat-arb algorithm might monitor price spreads between an ETF and its underlying basket of stocks, or between index futures and the index’s component equities, and rapidly trade to exploit divergences before they close. One common HFT arbitrage is index arbitrage – comparing the real-time value of an index future (say the S&P 500 E-mini) with the aggregated price of the index’s constituent stocks. If the future is temporarily overpriced relative to the underlying, the algo will sell the future and buy the basket (or vice versa), capturing a virtually risk-free profit as prices realign. This is a relatively difficult strategy but is also the strategy I primarily focus on building since as someone who lacks resources, it is the one thing I can make, test, and deploy from my computer.
Latency Arbitrage strategies exploit tiny timing differences in information arrival between trading venues or market participants. If one market moves slightly before another, an HFT latency-arb algorithm can capitalize by racing to trade on the slower venue with knowledge of the price change that is about to occur. In essence, this is a race condition: the fastest trader to react to new information can “pick off” resting orders on venues that have not yet updated their prices. Latency arbitrage is often considered a predatory strategy – it’s been described as effectively front-running public information by virtue of speed. Virtually every time you place a trade through a broker, one of these systems will profit off you buy being payed a maker taker fee for bringing you to an exchange; this isn't fair since in many cases you'll be brought to the BATS exchange which pays the taker and charges the maker (every other exchange does the opposite) and you'll still be stuck paying a commission that someone else profits from.
Event-Driven HFT strategies focus on trading around news or specific trigger events. These algorithms rapidly analyze real-time news feeds, economic data releases, earnings reports, or even social media, and execute trades before human traders can react. In the modern market, machine-readable news feeds and NLP (Natural Language Processing) models are integrated directly into some HFT systems. For example, an event-driven algo might parse a company’s earnings press release the instant it appears and decide to buy or sell the stock based on whether results beat or miss expectations – all within milliseconds. HFT firms subscribe to low-latency news services and sometimes even co-locate servers near newswire sources to get a time advantage in receiving the information. This is self explanatory, just whatever system can react to news the fastest wins.
Some of the more controversial HFT strategies involve detecting liquidity and exploiting it, or conversely avoiding adverse selection from toxic order flow. Liquidity detection algorithms (sometimes called “pinging” strategies) attempt to sniff out hidden orders and large trading interest in the market. HFT firms may send out a flurry of tiny orders – often immediate-or-cancel (IOC) orders for 100 shares or 1 lot – across different price levels or venues to probe for supply or demand. If these pinging orders get hits (even partial fills), it indicates the presence of a large buyer or seller hidden in the order book or a dark pool. The HFT’s algorithm can then escalate its activity: for example, if a ping reveals a big buyer in a dark pool, the HFT might buy up shares on other venues and then sell into the buyer’s demand at a higher price. I'd compare this to playing call of duty and throwing a stun grenade into a room before entering, if someone gets stunned and you get +25 points, you know to move in immediately, and if you don't stun someone, you may proceed with caution.
Momentum Ignition refers to a strategy where a trader deliberately attempts to ignite a rapid price movement – up or down – and capitalize on the frenzy that follows. An HFT or algorithmic trader employing momentum ignition will initiate a series of aggressive orders (market orders or large trades) in a short span, hoping to spark other algorithms or investors to also start buying or selling, thereby driving the price further in that direction. Once momentum takes hold, the instigator can profit by flipping their position (for example, buying shares to start an up-move, then selling into the rally they created). This is what happens every time you see newsa drop and the price of the stock goes in the opposite direction for a split second
Spoofing and Layering are abusive tactics where a trader places non-genuine orders to mislead other market participants about supply or demand, with the intent to cancel those orders before execution. They are illegal in most jurisdictions (for example, spoofing was explicitly outlawed in the US via the 2010 Dodd- Frank Act). These tactics deserve discussion both to understand how rogue algorithms might attempt them and how modern systems detect and prevent them. Currently an order can be cancelled in 0.5 seconds after it has been placed legally.
In essence all of these are ways of fooling retail and institutional investors to profit off their lack of knowledge; I think its important to be informed hence I am pointing this out and publicizing it. There are 100's of pages on the federal registry that will tell you how HFT algorithms are screwing you (the retail investor) over and with all that being said I believe that investing should be left to computers as they have taken over the market. It isn't fair but it's how the world works now. You are just liquidity swimming in pools for larger fish to feed off.

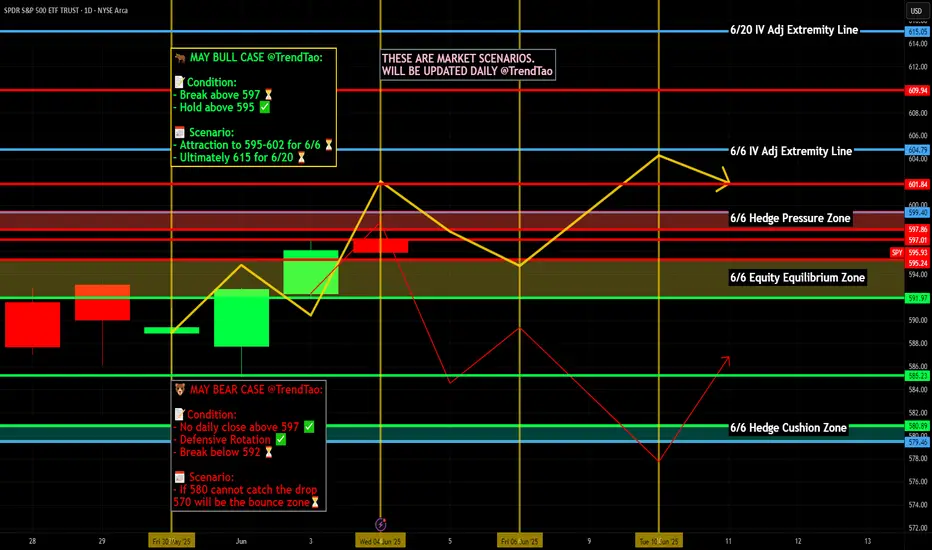
Nightly $SPY / $SPX Scenarios for June 5, 2025🔮 Nightly AMEX:SPY / SP:SPX Scenarios for June 5, 2025 🔮
🌍 Market-Moving News 🌍
🇺🇸 JOLTS Job Openings Surprise to Upside
U.S. job openings unexpectedly rose to 7.39 million in April—well above forecasts—indicating that labor demand remains robust despite macro headwinds and trade-policy uncertainty
🛢️ OPEC+ Greenlights July Supply Increase
OPEC+ agreed to boost production by 411 K barrels per day starting in July, adding downward pressure to oil prices and weighing on energy equities
📈 Fed’s John Williams Signals Patience
New York Fed President John Williams reiterated that the Fed sees no urgency to cut rates, citing mixed inflation signals and a balanced labor market—keeping investors cautious on rate-cut timing
📊 Key Data Releases 📊
📅 Thursday, June 5:
8:30 AM ET – JOLTS Job Openings (April)
Measures total U.S. job vacancies, a leading indicator of labor-market strength.
10:00 AM ET – OPEC+ Press Conference (Post-Meeting)
Details on production quotas for July, guiding energy market supply expectations.
⚠️ Disclaimer:
This information is for educational and informational purposes only and should not be construed as financial advice. Always consult a licensed financial advisor before making investment decisions.
📌 #trading #stockmarket #economy #news #trendtao #charting #technicalanalysis
Short - SPYPrice testing the neckline - yellow line at ~$588.20
Elliot Wave 12345 ABC: Wave 5 completed. Expect for Wave A
Support line to enter put: ~$582.15
Put option expiration 5/23/25 or 5/27/25
PT1: ~$569.20
PT2: ~555.80
SPY/QQQ Plan Your Trade For 6-3 : Carryover in Carryover modeToday's pattern suggests we may see more upward price consolidation/trending.
As many of you already know, I've been tracking the Excess Phase Peak pattern all the way up this incredible rally from the $480 lows on the SPY. In my opinion, we have moved into the "island" topping phase where price is struggling to break either upward or downward right now.
Currently, price seems to be attempting to break to the upside after yesterday's meltup. Today should be interesting because we could see solid REJECTION of yesterday's move with a big breakdown move. We'll see how things play out.
The SPY trend is still BULLISH based on my research. Thus, until and IF we get a breakdown, traders should continue to expect a MELT UP type of trend in the SPY/QQQ.
Hedging trades is a good idea right now.
Gold and Silver had a big move early this week and have not stalled into a sideways FLAGGING trend. By my estimates, the APEX of the flag will come near 1900-2100 today (Wednesday 6-3). That is when I think Gold/Silver will attempt to move into extreme volatility and attempt to make another big move.
I hope it is to continue the upside price trend, as this breakout move needs to push higher (breaking recent highs) for metals to move into a new dominant upward price trend.
BTCUSD is trading sideways - possibly setting up that DOUBLE-TOP pattern I suggested was going to take place on 5-20-25. Now, with Bitcoin leading the US markets by about 3-5 days (on average), we'll see if BTCUSD can attempt to move into another rally phase or if BTCUSD breaks below the $103k level and moves into a new downward price phase.
In my opinion, look out below.
Get some.
#trading #research #investing #tradingalgos #tradingsignals #cycles #fibonacci #elliotwave #modelingsystems #stocks #bitcoin #btcusd #cryptos #spy #gold #nq #investing #trading #spytrading #spymarket #tradingmarket #stockmarket #silver

Nightly $SPY / $SPX Scenarios for June 4, 2025🔮 Nightly AMEX:SPY / SP:SPX Scenarios for June 4, 2025 🔮
🌍 Market-Moving News 🌍
🌐 Markets Rally on Chinese PMI Surprise
China’s Caixin Manufacturing PMI unexpectedly climbed to 50.8 in May, signaling expansion in smaller export-focused factories. Asian markets jumped, lifting U.S. equity futures as investors recalibrated global growth expectations .
📉 U.S. Factory Orders Remain Soft
April’s U.S. Factory Orders fell 0.4%, underscoring persistent weakness in industrial demand amid elevated input costs and trade uncertainty. Declines in durable-goods orders weighed on industrial stocks .
🏦 Fed’s Bowman to Speak on Economic Outlook
Fed Governor Michelle Bowman is scheduled to deliver remarks at 2:00 PM ET, likely emphasizing caution on future rate moves given mixed data. Markets will watch for any shifts in tone regarding inflation risks and labor-market resilience .
🛢️ Oil Prices Slip on Rising U.S. Inventories
U.S. crude inventories rose by 3.8 million barrels last week, according to API data, pressuring oil prices lower and dragging energy shares down as supply concerns outweighed strong demand signals .
📊 Key Data Releases 📊
📅 Wednesday, June 4:
2:00 PM ET – Fed Governor Michelle Bowman Speaks
Remarks on economic outlook and monetary policy, watched for any hints on the Fed’s next moves.
⚠️ Disclaimer:
This information is for educational and informational purposes only and should not be construed as financial advice. Always consult a licensed financial advisor before making investment decisions.
📌 #trading #stockmarket #economy #news #trendtao #charting #technicalanalysis

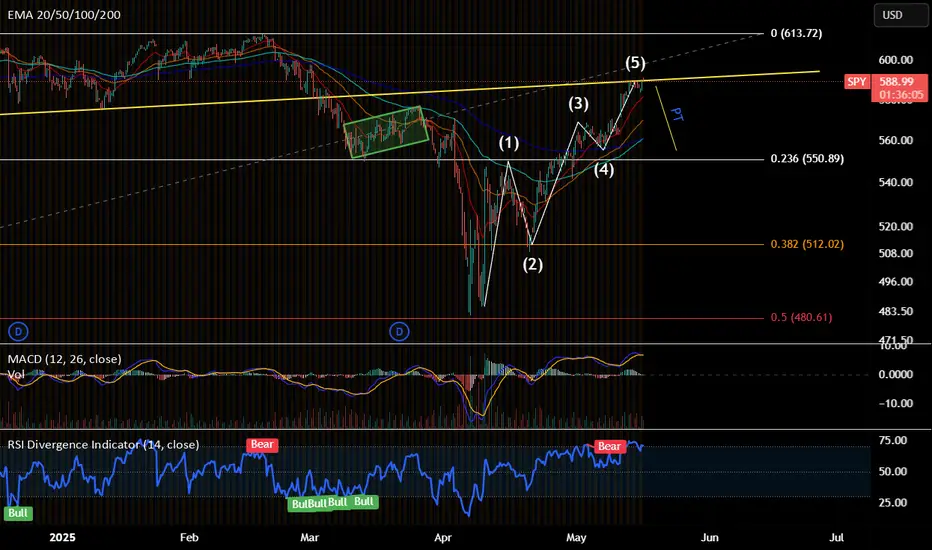
SPY in Wave 5This week I am expecting a final rally to 608 to finish wave 5. SPY broke above 595.50 resistance today, but with RSI at incredibly high levels on the 1HR chart I am anticipating a minor pullback tomorrow and the final push up to occur Thursday and Friday. Jobless claims are released Thursday and unemployment rate released on Friday. These are the two major data points coming out this week that will likely drive the market upward to finish this final wave up. For the remainder of the month, I am looking for major selling to begin and will likely lead us down to the 530 gap fill.
Cheers

SPY Inverse Head & Shoulders Played Out Clean – Bounce from Buy Just wanted to follow up on the AMEX:SPY idea I published yesterday — this played out exactly as expected 👇🏾
We got that clean pullback right into the 588.50–589.90 buy zone, which aligned perfectly with high-volume support. From there, price reversed and gave us that upside move back toward 593+.
Even more validating: the pattern that formed was a textbook inverse head and shoulders
🔹 Left Shoulder → formed near 586
🔹 Head → at the deeper 585 level
🔹 Right Shoulder → bounced cleanly off the buy zone
🔹 Neckline Break → confirmed the move above 591.12
This is why I always say: have your levels ready and wait for confirmation. No chasing, just execution.
🔑 Buy zone held
📊 Volume-backed support
📈 Continuation in progress
Will continue monitoring for follow-through above 593.46. If bulls hold control, next resistance is near 596–597.
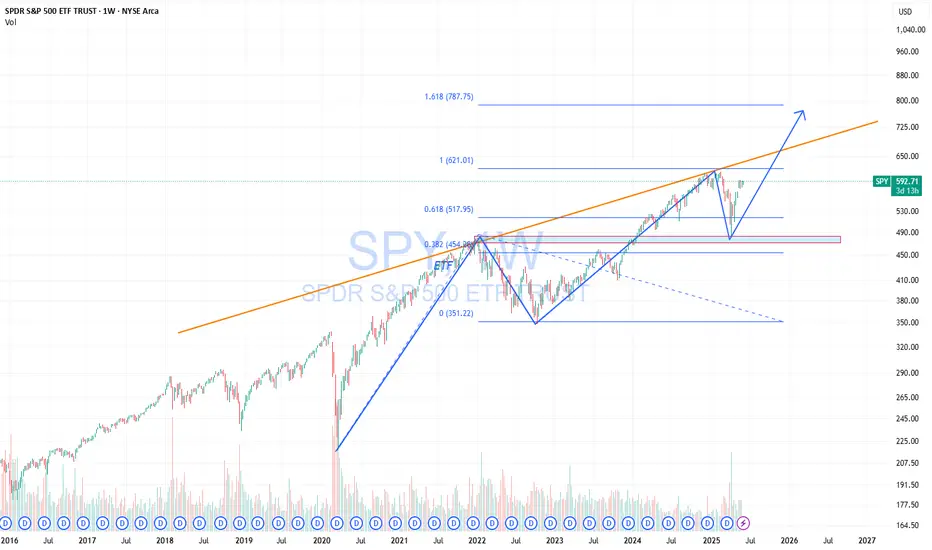
SPY Major Confluence ZoneSPY has a major upside confluence zone around 625
Looking for a test of this area in the coming weeks.
The level is about 5% away.
Let the melt up begin.

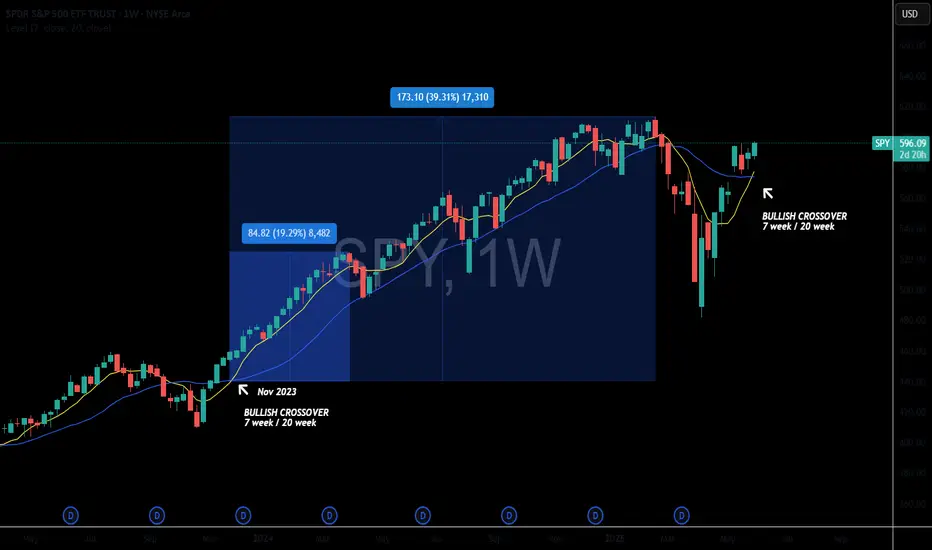
SPY New All Time Highs IncomingThe #SPY weekly chart is so bullish but don't take my word for it.
Simply look at the weekly bullish crossover that occurred between the 7 week & the 20 Week MA.
The last time this occurred was in Nov 2023 and the markets ripped 19% before having a major 3 week pullback and then another soaring continuation higher.
$SPY WILL 100% Hit ATH By End Of July! SPY is loaded up for a breakout run. All-time highs isn't even a question, but when is — and my bet is before July ends , honestly before end of June. In this idea, I go over key support levels, resistance zones, and the momentum shifts pointing toward a bullish continuation.

Bullish Intraday Patterns Everywhere!SPX had a wonderful intraday hourly chart confirmed breakout. This pattern is bullish and likely will continue higher.
The bulls tomorrow would love to confirm the daily chart breakout and will try to push for that.
SPY/SPX is holding more relative strength than the Q's & IWM which is displaying broad participation.
There are many bullish charts showing accumulation, golden crosses and bullish MA crossovers.
The DXY appears to be wanting to break down to around $97.00 which should yield more upside.
We secured profits today on SPY 594 calls & NVDA 144 calls.
We still remain net long and see the S&P 500 over $6000
Apple, XYZ, AI - are bullish setups were continuing to manage.

$SPY market COULD trend till nov25' (confirmation this month)I like to write today,
I see AMEX:SPY at a critical point right now, Im ultra long stocks and hedged today with a short AMEX:SPY ,
because:
We reached the target of a quarterly trend and didnt go higher for a long time.
We have a strange political situation which news affect the markets (more than usually) (positive and negative).
Were coiling at the top again after an insane rally from the lows.
But there are reasons to be bullish:
If we stay up this month we can form another longterm signal (6 month) until end of october and see an insane continuation rally. Target would be about 720 in AMEX:SPY and I guess its above all targets from US Banks for S&P.
Lets see whats coming and play it safe and with some calculated risks, its not safe out there but there are many oppurtunities.
1 step better every day, every week, every month and every year - my wish for you.
SPY/QQQ Plan Your Trade For 6-3 : BreakAway In Trend ModeToday's pattern suggests the SPY/QQQ will attempt to move into a Breakaway type of pattern. I believe that Breakaway may be to the downside, but I could be wrong.
Price has been struggling in a sideways consolidated range over the past 2+ weeks. I believe this range sets up an "Island" type of price formation that is indicative of a topping type of pattern.
Currently, I'm tracking layers of different TA techniques to try to see how price may react in the future. Right now, price appears to be trapped within a range, has recently broken below the STDDEV channel, and may be moving into a very volatile FAILURE/REJECTION phase.
This is where price may attempt to resume trending (up or down) and I believe the move logical move is to the downside at this point.
Gold/Silver had a HUGE MOVE yesterday and are not contracting a bit. I still believe Metals will rally higher and attempt to break to new ATH levels.
BTCUSD is trapped in a sideways price range after reaching new ATH levels recently. Many of you are aware I'm expecting a rollover-top pattern to setup in BTCUSD (and the US markets) and I believe it is just a matter of time to see how the markets react to policies, news, and economic function/data.
Should be an interesting (possibly sideways) day today.
Get some.
#trading #research #investing #tradingalgos #tradingsignals #cycles #fibonacci #elliotwave #modelingsystems #stocks #bitcoin #btcusd #cryptos #spy #gold #nq #investing #trading #spytrading #spymarket #tradingmarket #stockmarket #silver

SPY: Bullish Outlook Based on Market StructureETF Strategy: Still Buying for 2025 Growth
I'm continuing to buy SPY and adding other strong ETFs like VEA, QQQ, and TQQQ. The market structure looks solid after the recent bounce, and I’m positioning for continued growth through the rest of 2025. My goal is to close the year with a strong percentage gain.
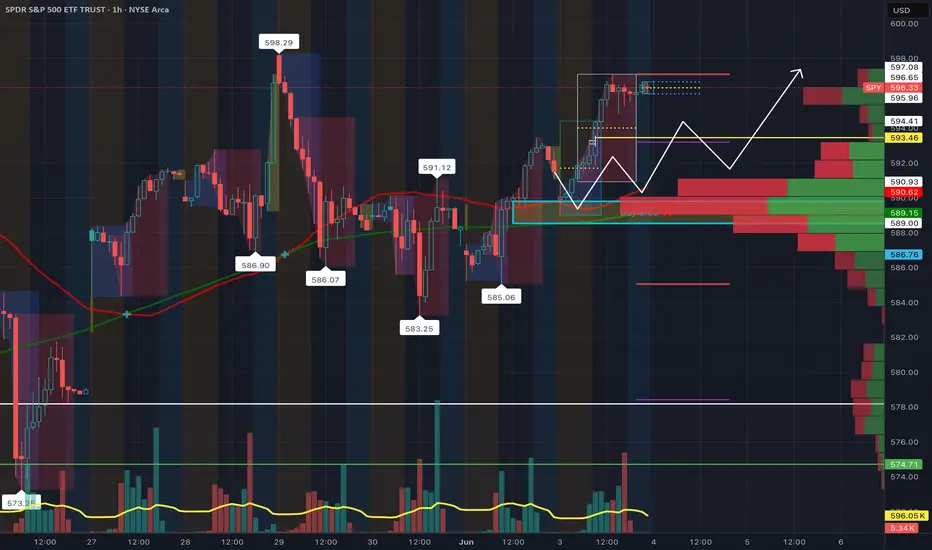
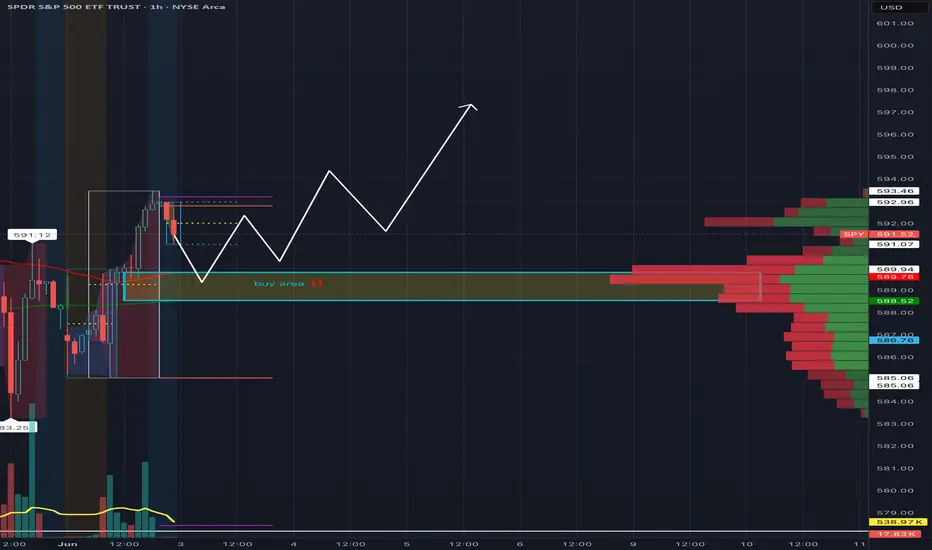
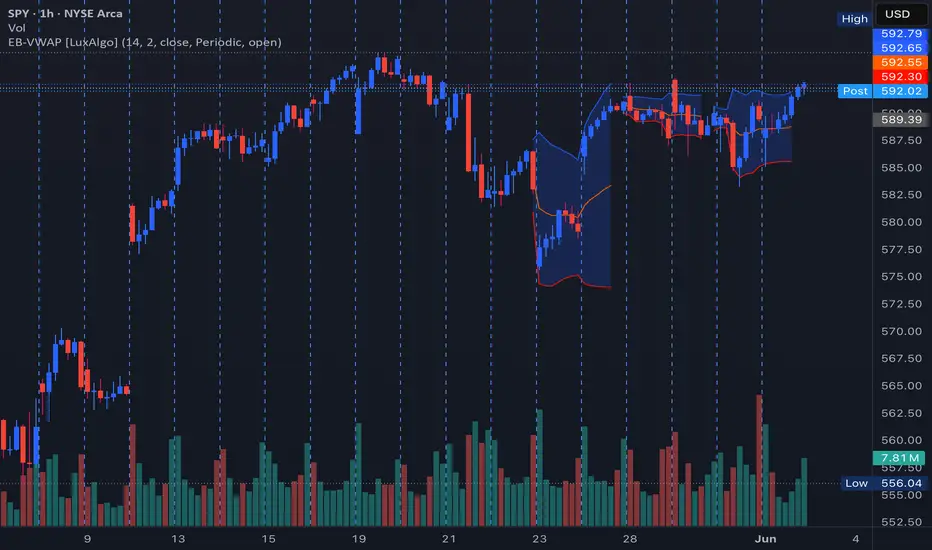
SPY 1HR Pullback to Volume Buy Zone Before Bullish ContinuationI’m watching the 588.52–589.94 range as a high-probability buy zone on the SPY 1-hour chart. This zone aligns with a strong volume shelf, indicating prior institutional accumulation and heavy transaction flow.
After a sharp move into the 591s, we’re seeing some hesitation and potential for a healthy pullback. The plan is to wait for price action to return to the buy zone, show signs of strength (e.g., hammer candle, strong bounce), and look for a continuation toward the previous high of 593.46 and possibly higher.
🔹 Buy Zone: 588.52–589.94
🔹 Volume Profile Support: High node at ~589
🔹 Resistance: 591.12 short-term, then 593.46
🔹 Stop Loss: Below 586.76 to avoid false breakouts
🔹 Target: 593.50+ with higher timeframe continuation in mind
SPY (S&P500 ETF) - Price Testing Resistance Trendline - DailySPY (S&P500 ETF) price is currently testing a resistance trendline above ($593 to $595 price levels).
SPY price in the medium-term has been uptrending since April and May 2025.
SPY price in the short-term has been consolidating sideways, and a large volume breakout or breakdown has not occurred yet.
The 12EMA (blue line) has been holding as support for 5 trading days. Resistance targets to the upside would be $598 to $600.
The grey gap and the 26EMA (purple line) are downside support targets if a rally does not occur this month ($576 to $567).
Breaking news and tariff trade deals are supposed to occur in June and July 2025.
600 before 580?, Jolts, Jobs Data, calling China🎮 What’s Happening Now:
1. The market trades like a simulation.
Levels get hit to the penny and reverse.
Fake breakouts, engineered sweeps, and chop-fests designed to trigger stops and crush premium.
It’s like trading inside a casino that reads your mind and moves the exit every five minutes.
2. AI + HFT firms front-run sentiment and order flow.
They scan Reddit, Discord, X, TradingView, and even order book imbalances in real time.
The second you find an edge, they’re already there—front-running or fading it.
3. Implied volatility and option decay weaponized.
They bait you in with movement, then nuke premiums before you can cash out.
If you're not closing green trades fast, they flip red—"correct trades, wrong time frame" syndrome.
⚖️ What Retail Is Up Against:
Smart order routers sniffing your orders.
Liquidity gaps intentionally created then filled.
Volume surges that mean nothing—just decoys.
AI-driven volume clusters that draw you in and dump you out.
💡 What some traders are doing to adapt:
Selling premium with iron condors, calendars, butterflies—less directional, more probability-based.
Trading futures or futures options, where fills are better and data is cleaner.
Sniping high-R:R setups, holding nothing overnight unless it's ironclad.
Using AI to fight AI—some build their own bots to scan volume shifts, OI skews, or gamma pins.
Nightly $SPY / $SPX Scenarios for June 3, 2025 🔮 Nightly AMEX:SPY / SP:SPX Scenarios for June 3, 2025 🔮
🌍 Market-Moving News 🌍
🏭 U.S. Manufacturing Slump Persists
U.S. manufacturing contracted for the third consecutive month in May, with new orders, backlogs, production, and employment all declining. Trade-war disruptions and elevated input costs continue to squeeze factory margins, setting the stage for today’s ISM Manufacturing PMI release
🌐 Global Trade Tensions Weigh on Stocks
Renewed U.S.–China tariff threats sent the S&P 500 lower overnight, as investors fear higher costs for exporters and slower global growth. Futures pointed to another rough open for $SPY/ SP:SPX
📈 China Caixin PMI Exceeds Expectations
China’s May Caixin Manufacturing PMI unexpectedly rose to 50.8, signaling stabilization in export-oriented factories despite ongoing trade uncertainty. That positive surprise may offer some support to Asian equities today
📊 Key Data Releases 📊
📅 Tuesday, June 3:
8:30 AM ET – ISM Manufacturing PMI (May) Measures U.S. factory-sector health; readings below 50 indicate contraction. Today’s survey will confirm if the May downturn persists.
10:00 AM ET – Construction Spending (April) Tracks monthly change in total construction outlays—an important gauge of housing and infrastructure investment trends.
1:00 PM ET – 10-Year Treasury Note Auction Benchmark auction that influences the yield curve. Weak demand or higher yields here can pressure equities, especially growth-oriented sectors.
⚠️ Disclaimer:
This information is for educational and informational purposes only and should not be construed as financial advice. Always consult a licensed financial advisor before making investment decisions.
📌 #trading #stockmarket #economy #news #trendtao #charting #technicalanalysis

Rally Maybe As of know we in n mans land
have to wait see we break 613 I think they do
why QE behind the scene
have a hedge in case we drop

SPY/QQQ Plan Your Trade For 6-2 : Post Market UpdateHuge move for metals today. Absolutely incredible.
Hope you GOT SOME.
BTCUSD and the SPY/QQQ stalled somewhat flat today. SPY was up 0.50% - nothing huge.
Going to be interesting to see how things play out in the Asian/European markets tonight.
Buckle up. Could be some very big moves hitting this week.
GET SOME.
#trading #research #investing #tradingalgos #tradingsignals #cycles #fibonacci #elliotwave #modelingsystems #stocks #bitcoin #btcusd #cryptos #spy #gold #nq #investing #trading #spytrading #spymarket #tradingmarket #stockmarket #silver
