Vanguard FTSE All World-Ex US ETF - Bearish HarmonicVanguard FTSE All World-Ex US ETF - Short Idea based on Bearish Harmonic.
Key stats
About VWORLDXUS CDI 1:1
Home page
Inception date
May 12, 2009
Replication method
Physical
Dividend treatment
Distributes
Income tax type
Capital Gains
Primary advisor
The Vanguard Group, Inc.
Distributor
Vanguard Marketing Corp.
ISIN
AU000000VEU9
Vanguard All-World ex-US Shares Index ETF seeks to track the return of the FTSE All-World ex US Index before taking into account fees, expenses and tax
Classification

Everyone Believes What They Want to BelieveRealty != Belief
The secret to this market is to lower your expectation continually.
Bulls do not realize they are sitting in the largest bull trap ever setup.
Macro bottom still pending... it's more of the same: drop, consolidate, drop.
A wise Bera once said:
Resistance is infinite and unbou

S&P 500 (SPX) vs Vanguard All-World ex-US (VEU)Comparing the US (SPX) vs the World. VEU seeks to track an index that consists of companies located in developed markets, including Europe, the Pacific, and Canada, and in emerging markets.

VEU - Market decision is comingI'm very interested in people opinion on this one. I'm not pro and still learning but this picture is clear to me...


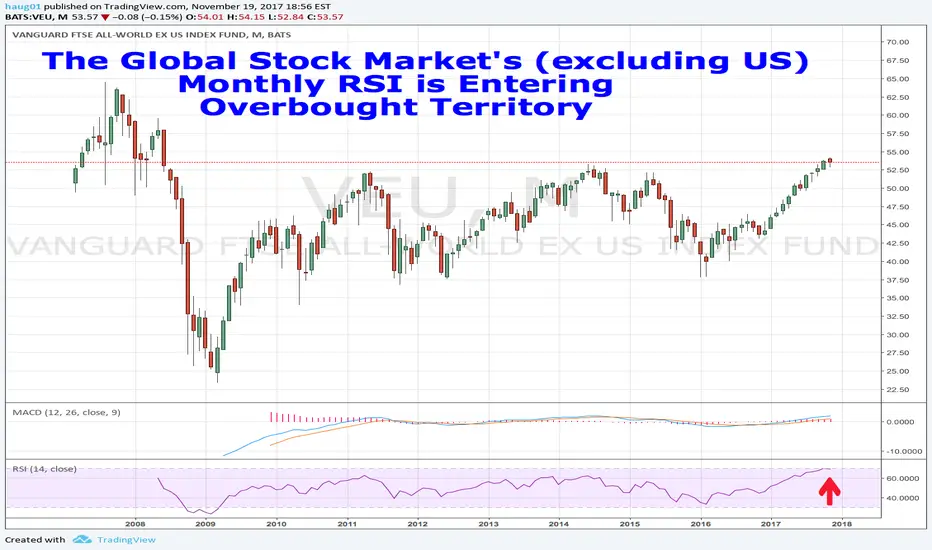
The Global Stock Market (excluding US) is OverboughtThe Global Stock Market's (excluding US) Monthly RSI is Entering Overbought Territory. While not as extreme as VT, I would be careful about going long here in developed markets or emerging markets. For a while longer, I expect it will outperform the US but I think it will for in upcoming months.
VEU, using most primitive line chartThe index includes approximately 2,200 stocks of companies in 46 countries, from both developed and emerging markets around the world
Frankly, i don't think the weakest in EEM stocks are enough to break this 2009 uptrend line, the developed markets do not fare very well which as a whole contributed
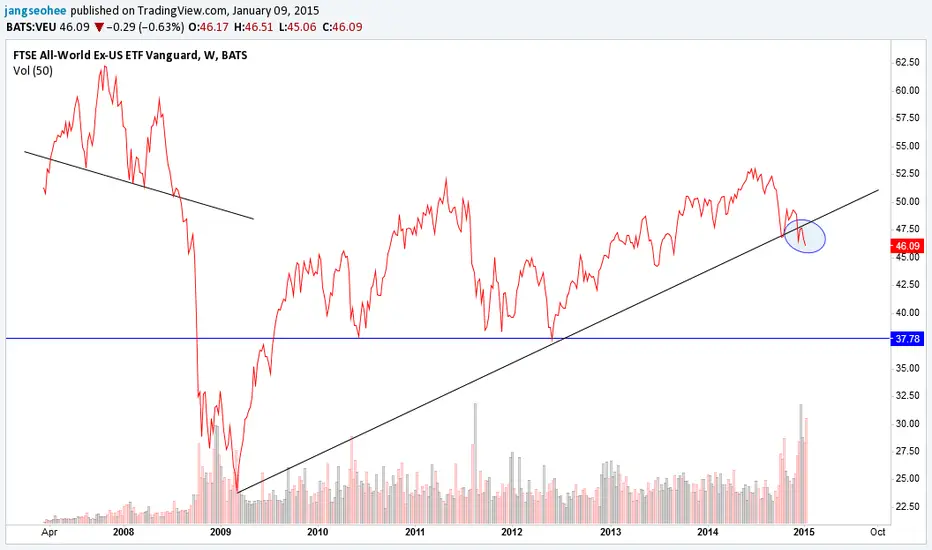
VEU finally shows signs of a bottom. VEU has been in a downtrend for a long time. Positive RSI divergence is finally forming. A breakout of the bull wedge would be bullish long term.

Will SPY follow world markets?With world markets making much lower lows, count on the recent lows in the SPY not holding.

See all ideas
Summarizing what the indicators are suggesting.
Oscillators
Neutral
SellBuy
Strong sellStrong buy
Strong sellSellNeutralBuyStrong buy
Oscillators
Neutral
SellBuy
Strong sellStrong buy
Strong sellSellNeutralBuyStrong buy
Summary
Neutral
SellBuy
Strong sellStrong buy
Strong sellSellNeutralBuyStrong buy
Summary
Neutral
SellBuy
Strong sellStrong buy
Strong sellSellNeutralBuyStrong buy
Summary
Neutral
SellBuy
Strong sellStrong buy
Strong sellSellNeutralBuyStrong buy
Moving Averages
Neutral
SellBuy
Strong sellStrong buy
Strong sellSellNeutralBuyStrong buy
Moving Averages
Neutral
SellBuy
Strong sellStrong buy
Strong sellSellNeutralBuyStrong buy
Displays a symbol's price movements over previous years to identify recurring trends.
Related funds
Frequently Asked Questions
An exchange-traded fund (ETF) is a collection of assets (stocks, bonds, commodities, etc.) that track an underlying index and can be bought on an exchange like individual stocks.
VEU trades at 101.22 AUD today, its price has fallen −0.47% in the past 24 hours. Track more dynamics on VEU price chart.
VEU net asset value is 100.99 today — it's fallen 0.51% over the past month. NAV represents the total value of the fund's assets less liabilities and serves as a gauge of the fund's performance.
VEU assets under management is 30.66 M AUD. AUM is an important metric as it reflects the fund's size and can serve as a gauge of how successful the fund is in attracting investors, which, in its turn, can influence decision-making.
VEU price has risen by 0.22% over the last month, and its yearly performance shows a 13.28% increase. See more dynamics on VEU price chart.
NAV returns, another gauge of an ETF dynamics, have risen by −0.51% over the last month, have fallen by −0.51% over the last month, showed a 5.44% increase in three-month performance and has increased by 16.46% in a year.
NAV returns, another gauge of an ETF dynamics, have risen by −0.51% over the last month, have fallen by −0.51% over the last month, showed a 5.44% increase in three-month performance and has increased by 16.46% in a year.
VEU fund flows account for 0.00 AUD (1 year). Many traders use this metric to get insight into investors' sentiment and evaluate whether it's time to buy or sell the fund.
Since ETFs work like an individual stock, they can be bought and sold on exchanges (e.g. NASDAQ, NYSE, EURONEXT). As it happens with stocks, you need to select a brokerage to access trading. Explore our list of available brokers to find the one to help execute your strategies. Don't forget to do your research before getting to trading. Explore ETFs metrics in our ETF screener to find a reliable opportunity.
VEU expense ratio is 0.08%. It's an important metric for helping traders understand the fund's operating costs relative to assets and how expensive it would be to hold the fund.
No, VEU isn't leveraged, meaning it doesn't use borrowings or financial derivatives to magnify the performance of the underlying assets or index it follows.
In some ways, ETFs are safe investments, but in a broader sense, they're not safer than any other asset, so it's crucial to analyze a fund before investing. But if your research gives a vague answer, you can always refer to technical analysis.
Today, VEU technical analysis shows the neutral rating and its 1-week rating is buy. Since market conditions are prone to changes, it's worth looking a bit further into the future — according to the 1-month rating VEU shows the buy signal. See more of VEU technicals for a more comprehensive analysis.
Today, VEU technical analysis shows the neutral rating and its 1-week rating is buy. Since market conditions are prone to changes, it's worth looking a bit further into the future — according to the 1-month rating VEU shows the buy signal. See more of VEU technicals for a more comprehensive analysis.
Yes, VEU pays dividends to its holders with the dividend yield of 2.37%.
VEU trades at a premium (0.71%).
Premium/discount to NAV expresses the difference between the ETF’s price and its NAV value. A positive percentage indicates a premium, meaning the ETF trades at a higher price than the calculated NAV. Conversely, a negative percentage indicates a discount, suggesting the ETF trades at a lower price than NAV.
Premium/discount to NAV expresses the difference between the ETF’s price and its NAV value. A positive percentage indicates a premium, meaning the ETF trades at a higher price than the calculated NAV. Conversely, a negative percentage indicates a discount, suggesting the ETF trades at a lower price than NAV.
VEU shares are issued by The Vanguard Group, Inc.
VEU follows the FTSE All-World ex US Index. ETFs usually track some benchmark seeking to replicate its performance and guide asset selection and objectives.
The fund started trading on May 12, 2009.
The fund's management style is passive, meaning it's aiming to replicate the performance of the underlying index by holding assets in the same proportions as the index. The goal is to match the index's returns.