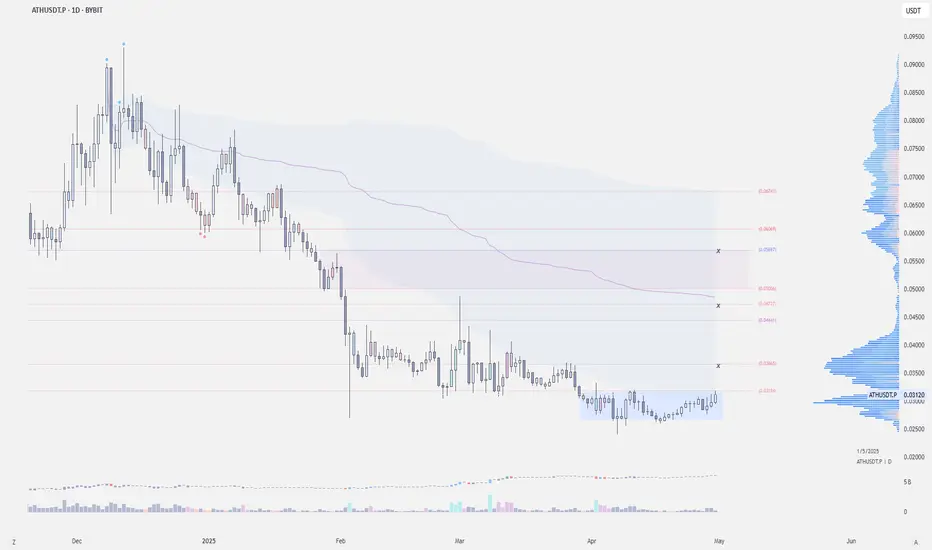
Check this update if you are holding ATH!Here’s a quick analysis of ATH on the daily timeframe:
ATH has been rejected from its resistance trendline and is currently holding support at $0.04. While it's uncertain whether this support will hold, the overall chart structure suggests a potential rejection is unfolding.
Bearish confirmation:

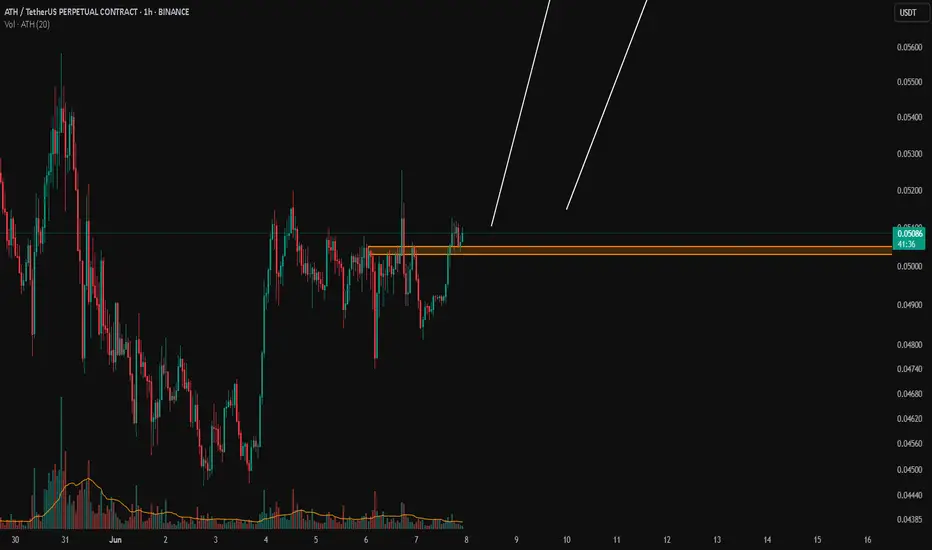
ATH/USDTKey Level Zone: 0.05030 - 0.05050
LMT v1.0 detected.
The setup looks promising—price previously trended upward with rising volume and momentum, then retested this zone cleanly. This presents an excellent reward-to-risk opportunity if momentum continues to align.
Introducing LMT (Levels & Momentum
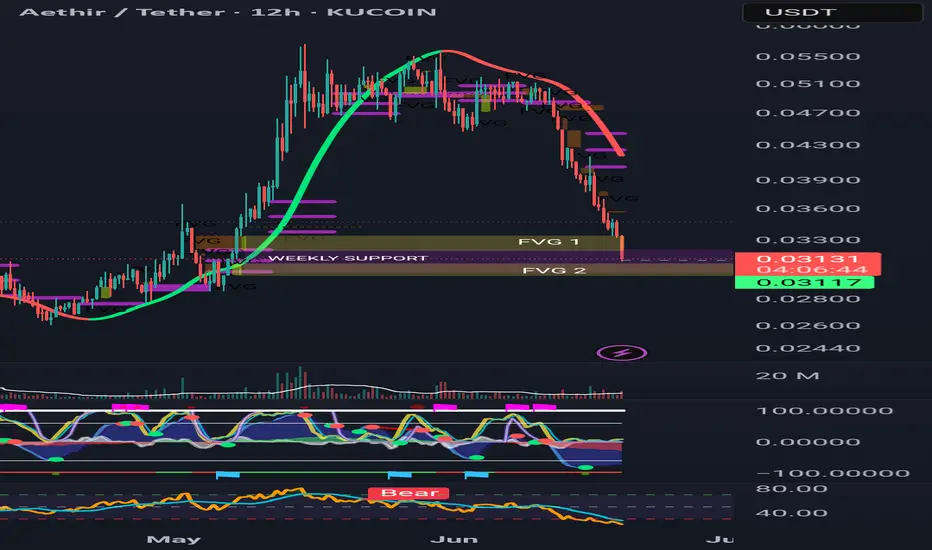
AETHIR Bought the DipATH filled Bart Simpson and is in weekly support area and has filled FVG 1(fair value gap). Another FVG yet to be filled but all in all good DCA + entering the Buy zone. Taking advantage of it and scaling in.
ATH Bias Structural Shift
- MSS Confirmed on 30min/15min charts – bullish trend ignition.
- SSL Sweep Finished (4H/2H) + Liquidity Grab Complete → reversal fuel.
• Entry Zone Confluence
- FVG Clusters** (2H/1H/30min) at current levels. - institutional accumulation.

ATHUSDT breakdown alertATHUSDT breakdown alert
ATHUSDT has broken down from a triangle pattern and seems to have completed a retest of the breakdown level. If the price continues to reject that zone, it could confirm bearish momentum and lead to further downside movement.
Key levels to watch:
– Retest zone acting as res

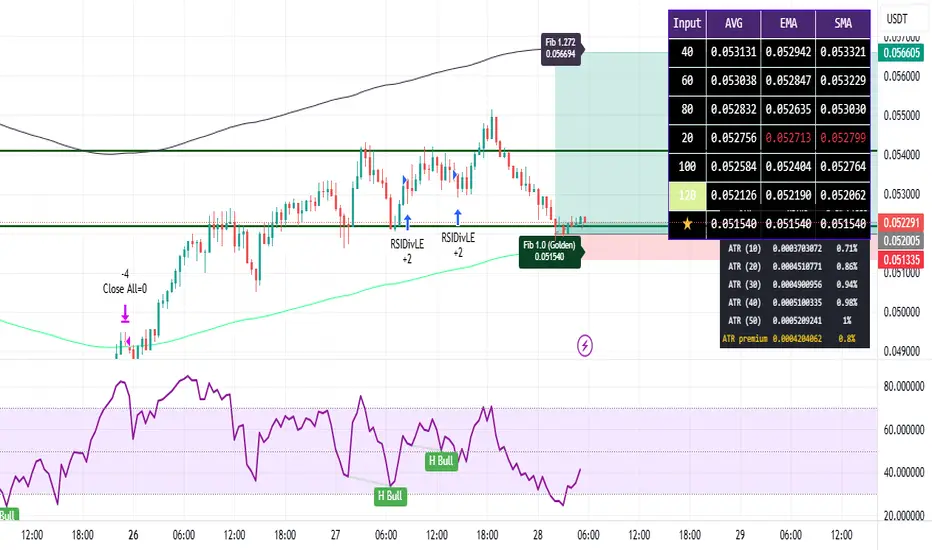
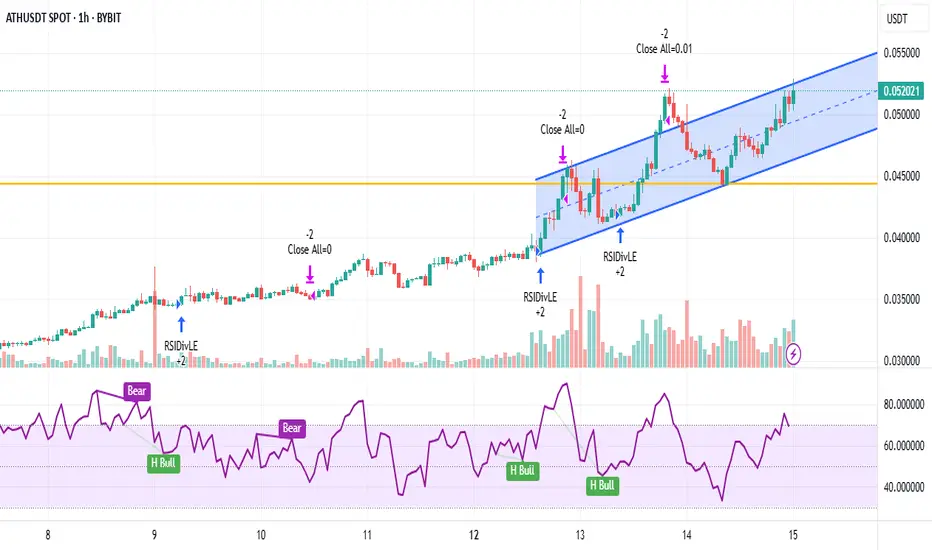
ATH (Range) Breakout - retest on Golden Fib
After forming a range on the 1h timeframe, ATH successfully broke out and sweeped the liquidity above, before retesting the Golden Fib level below perfectly.
Strong Support level at 0.052 held, and has shown us the initial reaction was a push upwards with momentum. Providing us with a clean entry
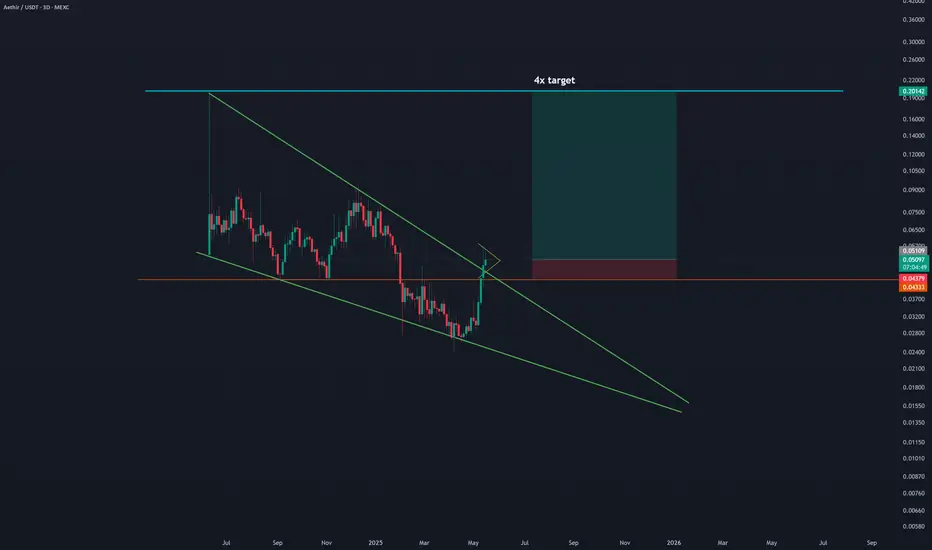
$ATH descending wedge breakoutBreakout in progress - has a 4x to reach the target of the descending wedge.
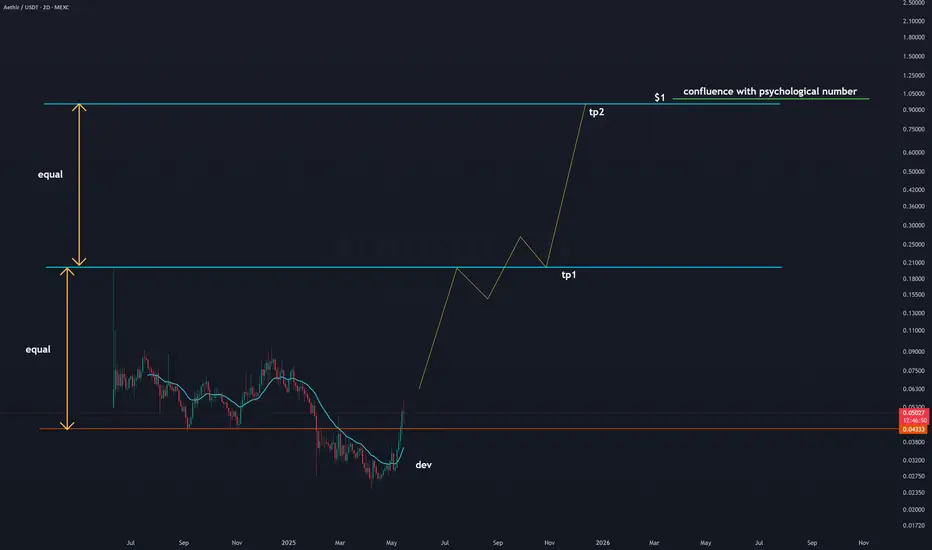
Aethir $ATH - Channel based TALooks like liquidity was taken from under the lower channel.
We should now see a swing to take out the liquidity at the top of
this channel. After consolidation, we'll push into the next channel
(Equal height of the first in LOG scale), and target the upper bounds
of this one. Athir has enormous pot
ATH Crossing 7 day High - Breakout on 1h chartConfirmed breakout on the 1h timeframe, successfully establishing a new 7-day high. With an daily volume increase of at least 10-20% - Market cap is rising fast, expenationally.
This is a legit project, ATH is like Google Cloud or Amazon Web Services - but takes payments in Cryptocurrency instead o
$ATH - Long Trade IdeaATHUSDT | 1D
Entry: .031 to .029
Stoploss: set below .025
Targets:
.0364-.042
.0473-.050
.0567-.060
See all ideas
Summarizing what the indicators are suggesting.
Oscillators
Neutral
SellBuy
Strong sellStrong buy
Strong sellSellNeutralBuyStrong buy
Oscillators
Neutral
SellBuy
Strong sellStrong buy
Strong sellSellNeutralBuyStrong buy
Summary
Neutral
SellBuy
Strong sellStrong buy
Strong sellSellNeutralBuyStrong buy
Summary
Neutral
SellBuy
Strong sellStrong buy
Strong sellSellNeutralBuyStrong buy
Summary
Neutral
SellBuy
Strong sellStrong buy
Strong sellSellNeutralBuyStrong buy
Moving Averages
Neutral
SellBuy
Strong sellStrong buy
Strong sellSellNeutralBuyStrong buy
Moving Averages
Neutral
SellBuy
Strong sellStrong buy
Strong sellSellNeutralBuyStrong buy
Displays a symbol's price movements over previous years to identify recurring trends.