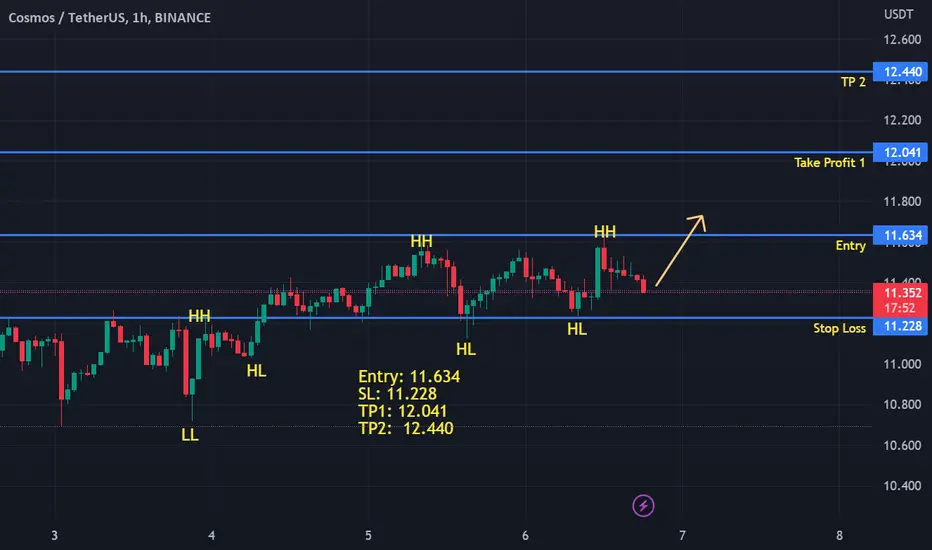
ATOMUSDT LONG SIGNALHello traders, ATOM is at a strong support and it can lead it to upward, and according to 18/jan ATOM has tested this support and it did a great pump... so I expect same thing to happen as its on this support for few days and it close daily candles above it.
enjoy, and have a great trading.
ATOMUSDT.P trade ideas
#ATOMUSDT #BTC #CRYPTO #Samin #hunterS/R zone
Divergence in RSI
Volume trading
Break out the major S/R and pullback
ATOM is not looking goodI am expecting higher high with bearish divergence or double top: we touched VWAP and there is some kind of diagonal resistance, filled monthly FVG. The daily is broken so v shaped top is in play too. I'd like to see retest to have a nice entry and down to 4.2. If that won't hold then lower to finish the pattern.
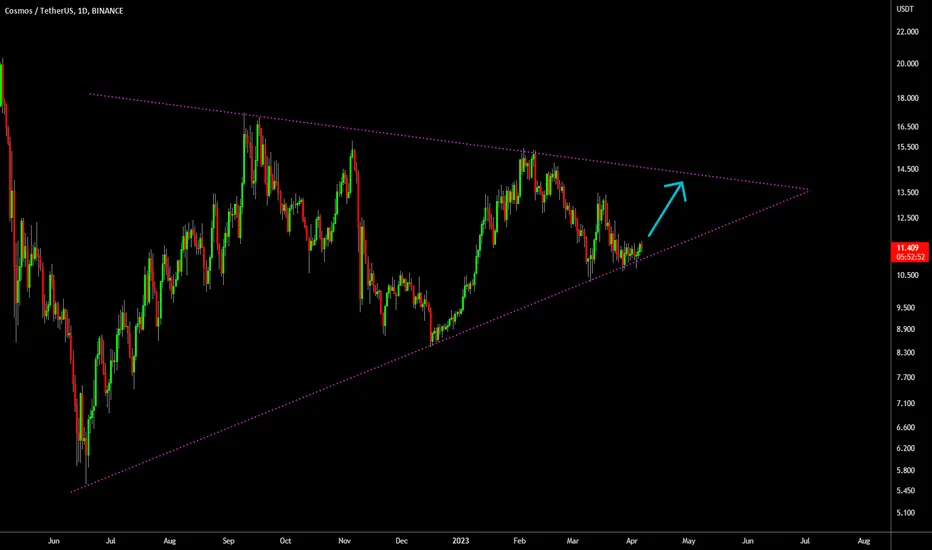
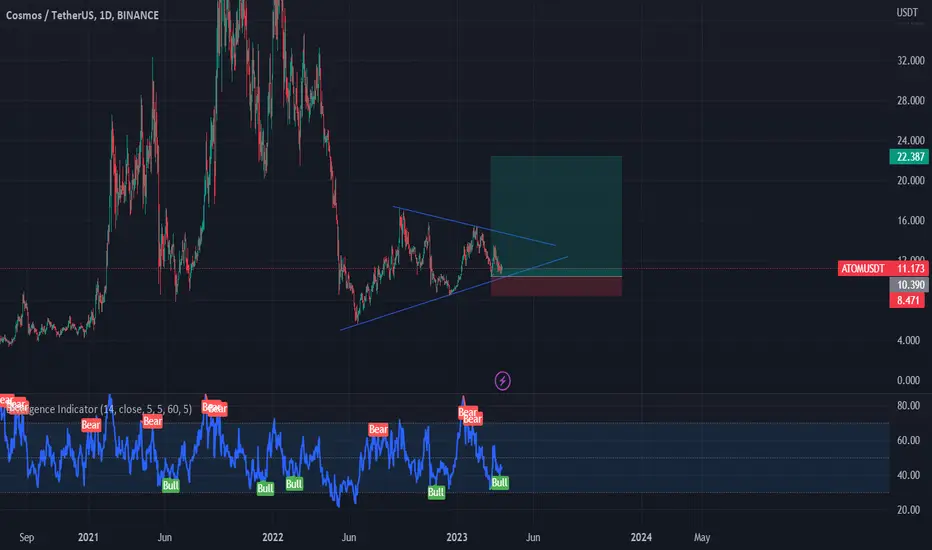
🔥 ATOM Massive Triangle ReversalI've made several analyses on ATOM and the massive triangle pattern it has been trading in since June 2022.
Since a couple of days, ATOM is finding support around the bottom support line of the triangle. In my view, there's a decent probability that ATOM will reverse from this point onwards and go back up.
I'm looking at the top resistance of the triangle as a potential target.
Home Work #3, 4 Part 2, Regular CandlesThe task was to polish the skill of charting trend channels with some of the most common patterns as double tops and bottoms, cup and handle, bear and bullish flags.

Home Work #3, 4 Part 2The task was to polish the skill of charting trend channels with some of the most common patterns as double tops and bottoms, cup and handle, bear and bullis flags.

✅TS ❕ ATOMUSD: downtrend✅✅ ATOM/USDT moves in a downtrend.
The chart has returned to the downtrend channel.
Price will continue to decline. ✅
🚀 SELL scenario: short to 10.591. 🚀
----------------------------------------------------------------------------
Remember, there is no place for luck in trading - only strategy!
Thanks for the likes and comments

COSMOS PUMPThe information and publications are not meant to be, and do not constitute, financial, investment, trading, or other types of advice or recommendations supplied or endorsed by TradingView.
Home Work #3, 4Finding double triple tops and bottoms as well as head and shoulders , cup and handle patterns. Also the task was setting the fib tool to consolidations.

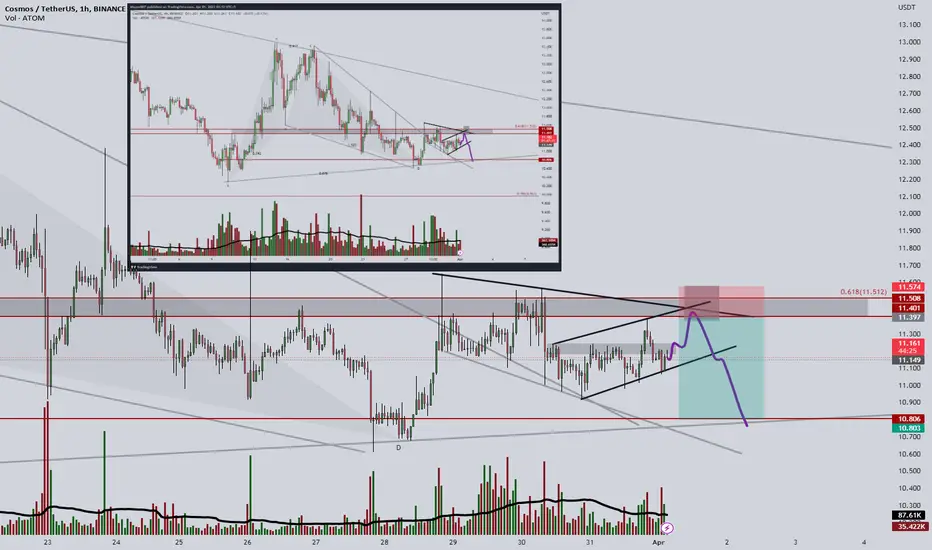
ATOM/USDT - SCALPING SHORT!analysis timeframe: 1d.4h.1h.
looking bearish from 11.400$.
target will be 10.800$.
stoploss 11.572$.
- falling wedge
- harmonics
- spread volume analysis
- support/resistance
- rsi
- channel
- short setup
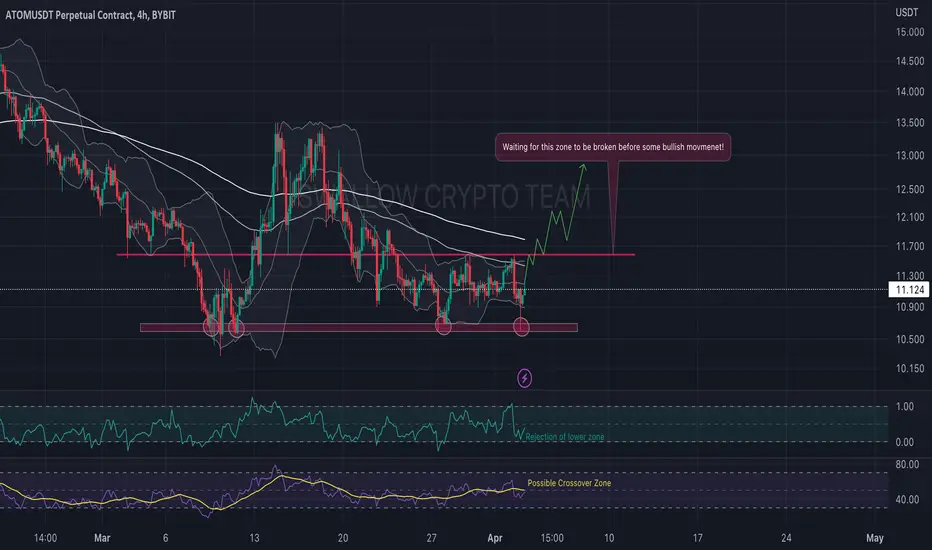
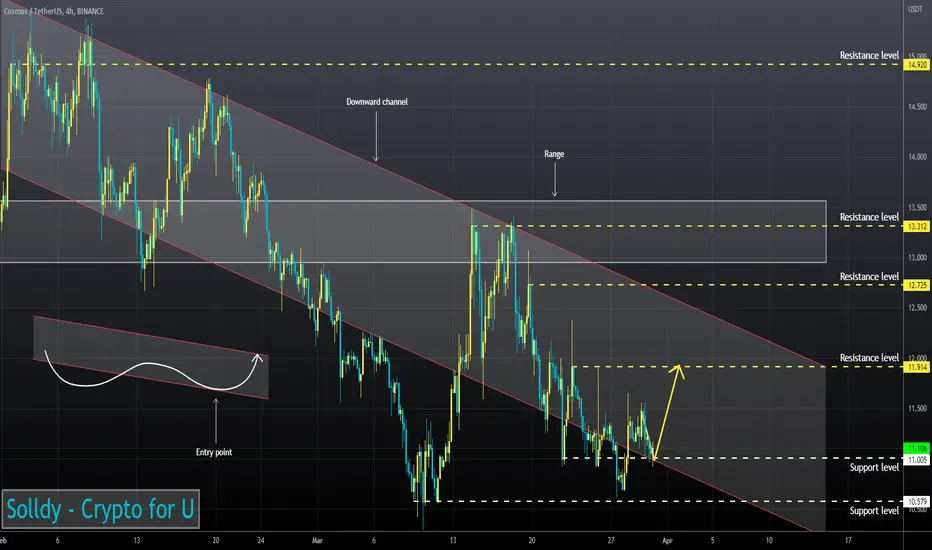
ATOM USDT 4HTo enter a trade, you need to wait for the formed and tested structure + confirmation of the indicators.
The asset may be of interest to buy in the region of $10
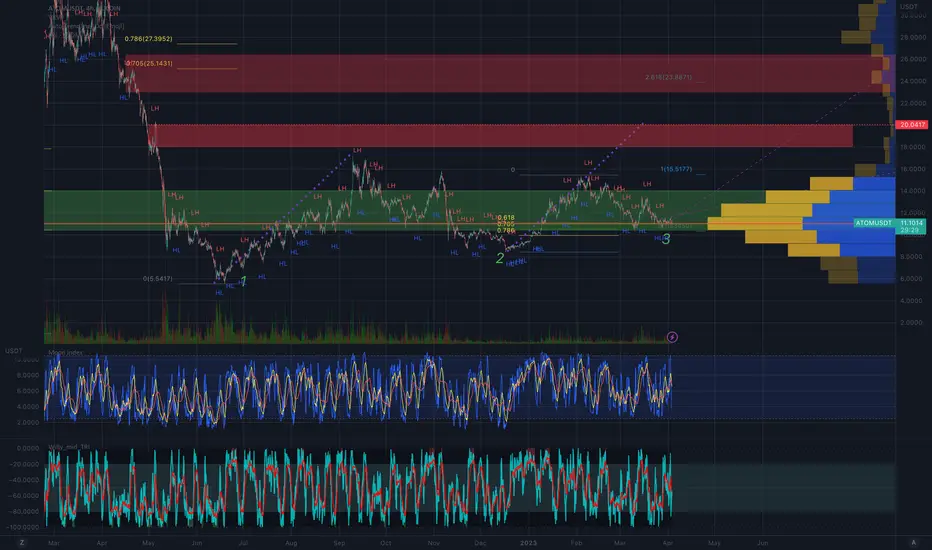
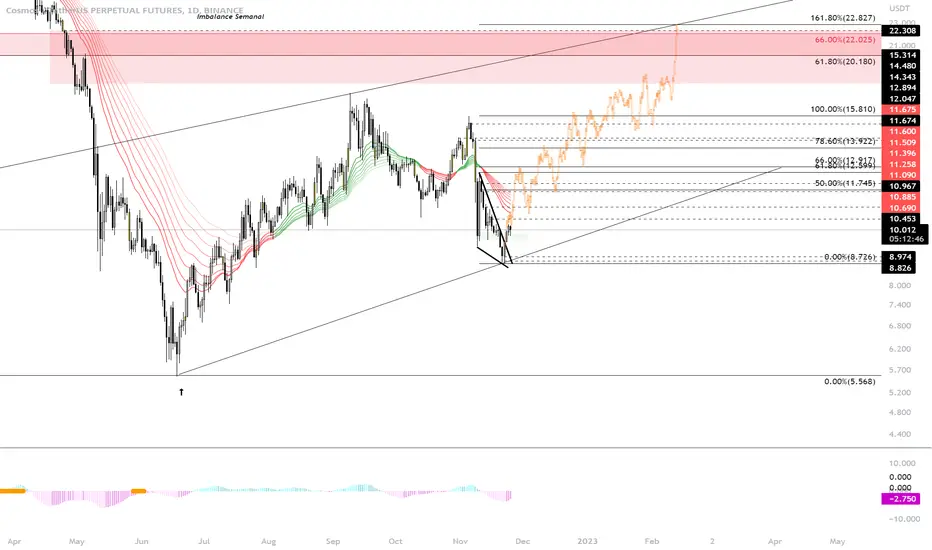
ATOMUSDTThe price has corrected to the Fibonacci retracement levels of 0.705-0.786 and currently at the point of control, where the most volume has been traded. This indicates that the asset is experiencing significant interest from traders and investors.
The ascending structure with three completed higher lows on the three-day chart implies a bullish signal, which may suggest a potential upward trend.
According to your indicator, the asset's momentum has almost reset. You believe that the price might need to experience some sideways movement before breaking out of the current range in the direction of the mentioned targets.
The first price target is $25 area, and the second price target is $35 area. These targets may provide potential profit-taking opportunities for traders and investors.
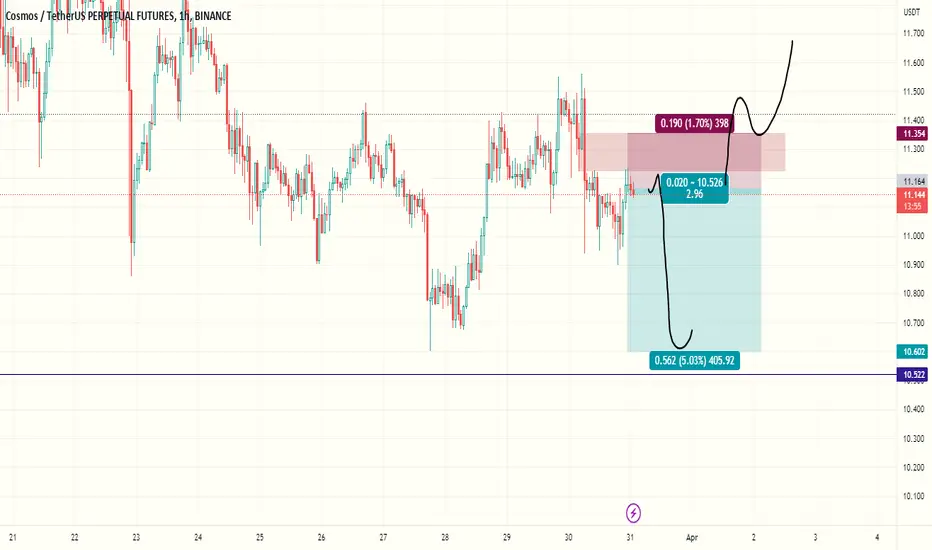
ATOM/USDT what do we see here? Hey guys 👋
ATOM coin has had a nice bounce from that lower support zone where currently it is going for those upper zone to claim them. We are going to wait for that upper zone to be secured by bulls before we enter the position but overall view should be seen here.
If you like ideas provided by our team you can show us your support by liking and commenting.
Yours Sincerely,
Swallow Team 🔱
Disclamer:
We are not financial advisors. The content that we share on this website are for educational purposes and are our own personal opinions.
ATOM HIGH RISKWe tested major breaker and lost minor breaker, liq grabbed and pair wants to go with volatility so shorting is not much problem I think. If this stops I will be in longs when pair test red box
good luck
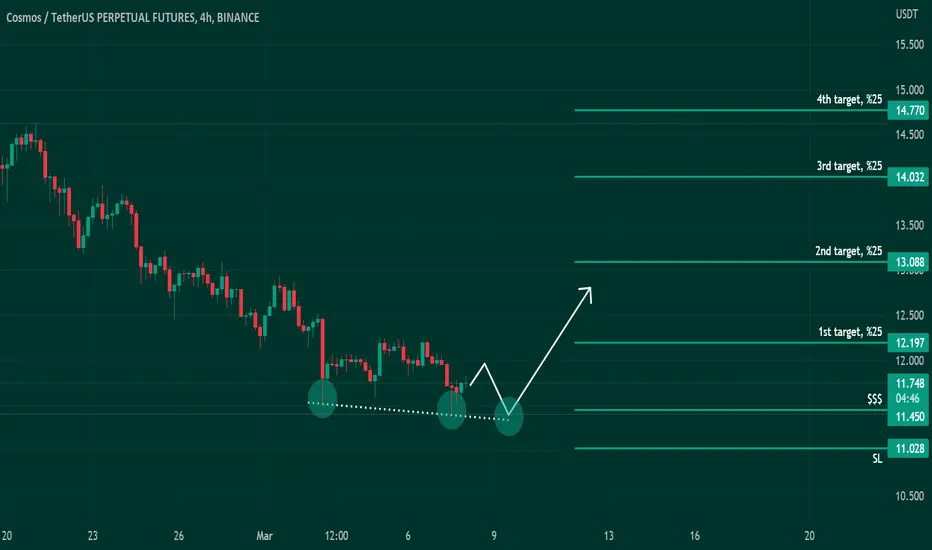
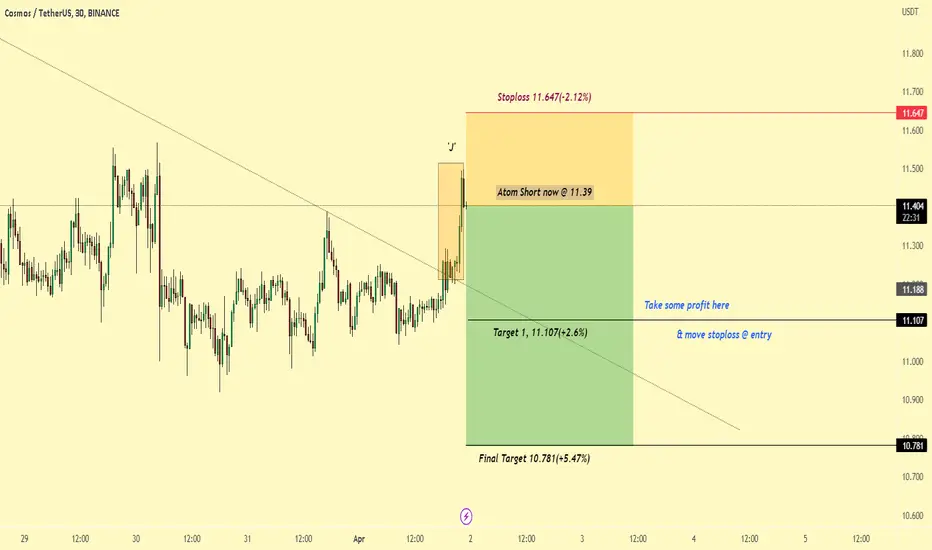
Atomusdt: Short this pumpHello Traders!
Welcome back to another trade with analyst Aadil1000x.
Today we are going to sell the atom as it has formed a 'J' pattern above the trendline which is a sign of a bearish move.
Atom Short now @ 11.39
Stoploss 11.647(-2.12%)
Target 1, 11.107(+2.6%)
Final Target 10.781(+5.47%)
Don't forget to hit the like button and follow to stay connected.
COMSOM USDT FThe information and publications are not meant to be and do not constitute financial, investment, trading, or other types of advice or recommendations supplied or endorsed by TradingView. Read more in the Terms of Use.
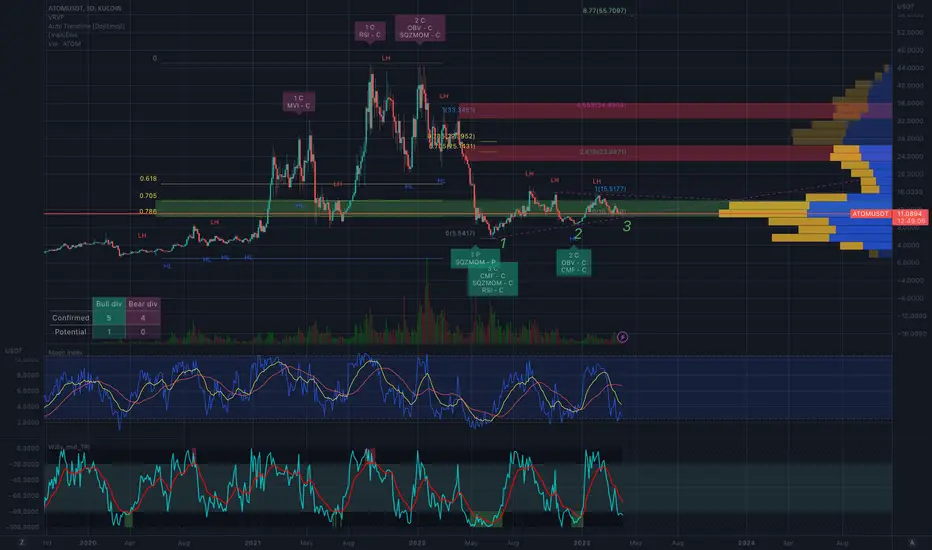
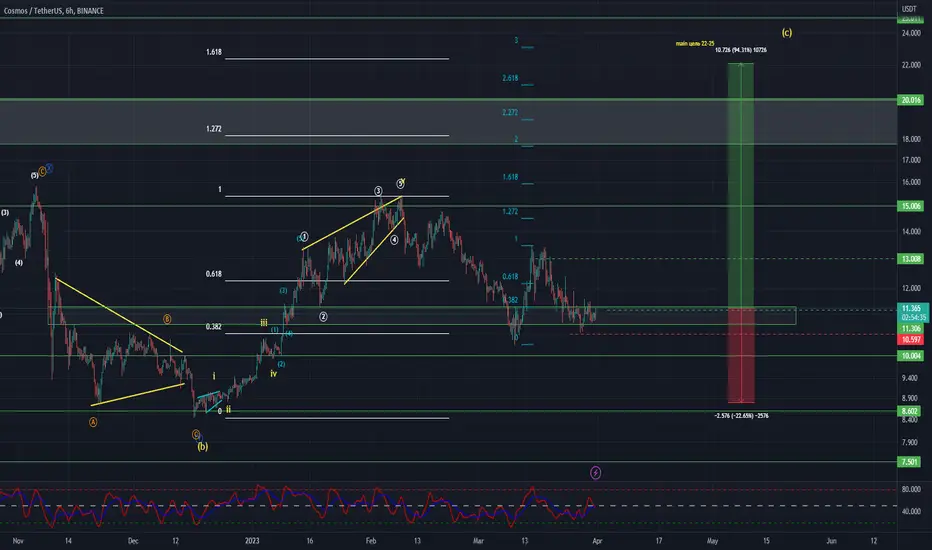
ATOMUSDT Elliott Waves AnalysisHello friends.
Please support my work by clicking the LIKE button👍(If you liked). Also i will appreciate for ur activity. Thank you!
Everything on the chart. (update)
Nothing has changed since my last idea, everything is relevant, still waiting for +-20$ zone.
Entry: market and lower
Targets: 16 - 18 - 20 and maybe ~22(not sure)
after first target reached move ur stop to breakeven
Stop: agressive 10.2, conservative 8.8 (depending of ur risk). ALWAYS follow ur RM .
RR: 1 to 4.5
risk is justified
Good luck everyone!
Follow me on TRADINGView, if you don't want to miss my next analysis or signals.
It's not financial advice.
Dont Forget, always make your own research before to trade my ideas!
Open to any questions and suggestions
ATOMUSD ❕ fixed in the channelATOM moves over liquidity.
Trading volumes are up.
The RSI chart on the 4H Timeframe indicates a shift of initiative to buyers.
I believe that the asset will continue to rise after the retest of the lower boundary of the channel.
Home Work #2 Part 2 ATOMThis is home work on ATOM as of 2022 - 2023. The goal is draw the channels with support and resistnace trend lines.

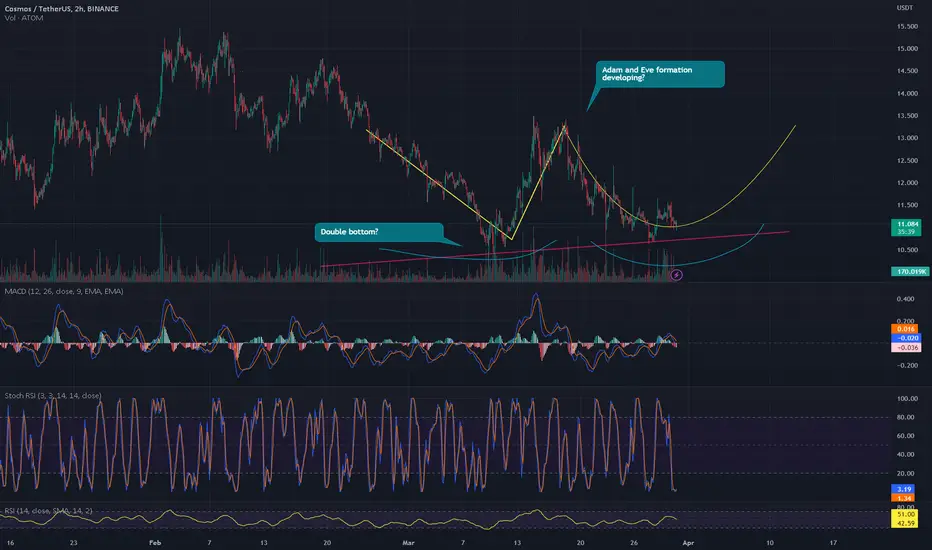
Cosmos possible adam and evePossible double bottom on trendline with an Adam and Eve formation.
Will take sometime to develop if correct.
$ATOM Risky long but long. The scenario is good for a pump in atom yet dangerous as BTC is on the verge of a crash.
But let's keep the SL and be patient.
Atom Long Fractal in play i think, expecting the price to be pushed up filling both the weekly imbalances, also confluent with a golden pocket btw swings.
Lvl holding pretty well so far, bb squeeze trigger, EMA ribbons trigger long small tf..
NFA