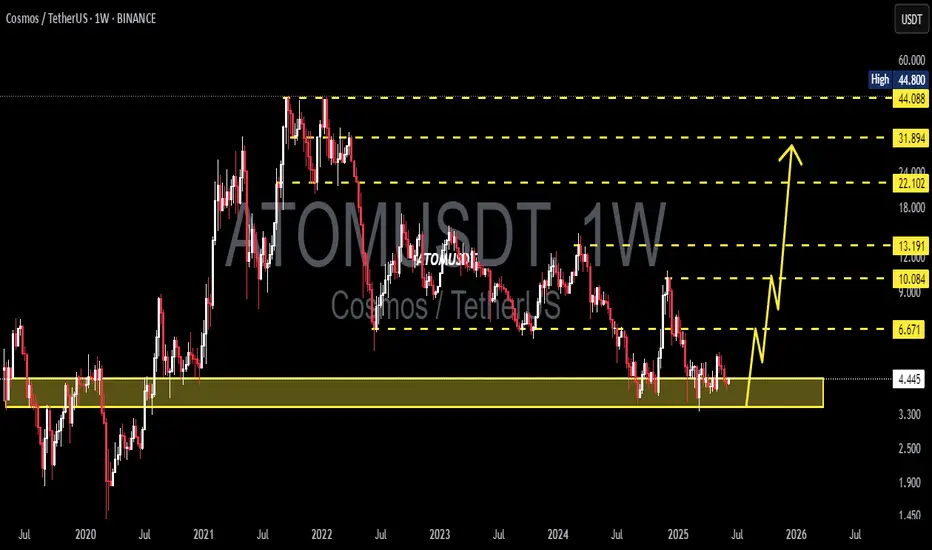
ATOMUSDT 1W Analysis ATOM ~ 1W Analysis
#ATOM Buy back gradually from here if you still have confidence in this coin with a short term target of at least 20%+ from here.
ATOMUSDT trade ideas
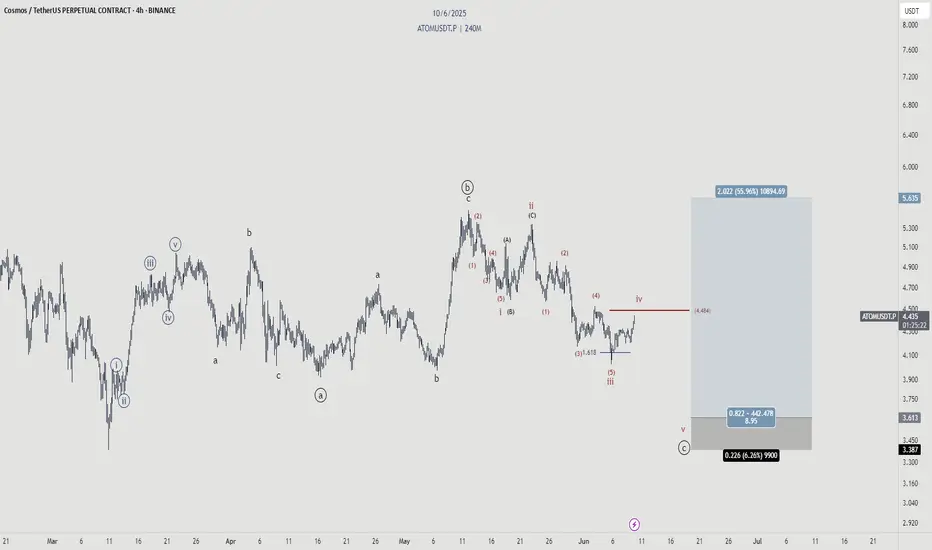
ATOM - Correction almost completeWe're approaching the completion of wave 4. Wave 5 will come down and take out liquidity below.
TradeCityPro | ATOM: Major Support Test in Cosmos Ecosystem Coin👋 Welcome to TradeCity Pro!
In this analysis, I’m going to review the ATOM coin for you. This project is part of the Osmosis network ecosystem.
🔍 ATOM, with a market cap of $1.68 billion, is currently ranked 51st on CoinMarketCap.
📅 Daily Timeframe
As you can see in the daily timeframe, ATOM is currently sitting on a very significant support zone. It has tested this area multiple times, and once again, it’s hovering around that level.
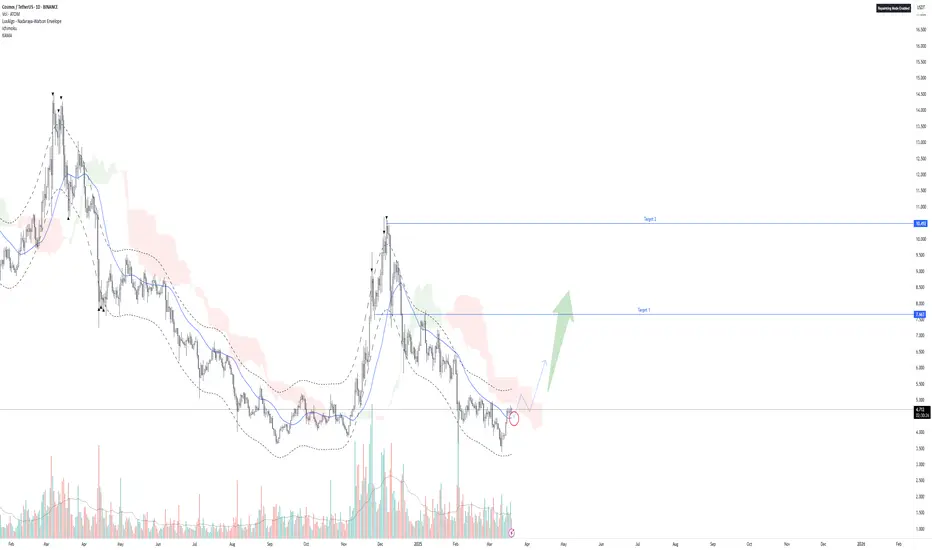
⭐ If the price finds support here and begins to move upward, we can consider entering a long position with a trigger at 4.588. The main bullish trigger will be the 5.380 level, and if that breaks, spot buying can also be considered.
✨ As I always mention with spot triggers on altcoins, it’s best to wait for Bitcoin dominance to start declining before entering. If that happens, ATOM could potentially move toward targets at 7.514 and 10.4.
⚡️ If the key support at 4.075 breaks, we can open a short position targeting 3.501. The 35.68 level on the RSI is a critical support, and a break below it would serve as a momentum confirmation.
📊 Also, keep an eye on market volume. It has been declining recently, and once volume starts flowing in on either side, we can prepare to act on the corresponding trigger.
📝 Final Thoughts
This analysis reflects our opinions and is not financial advice.
Share your thoughts in the comments, and don’t forget to share this analysis with your friends! ❤️

ATOM | Sleeping GIANT Altcoin Gem 1️⃣ATOM is probably one of my favorite altcoins at the moment.
If you look at ATOM from a macro timeframe such as the weekly, it seems like there is barely any hope and that it's just been one big liquidity run.
And although ATOM has retraced nearly 92% since it's ATH, we see a much brighter picture when we look at the daily, or 3D timeframe.
______________________
BINANCE:ATOMUSDT

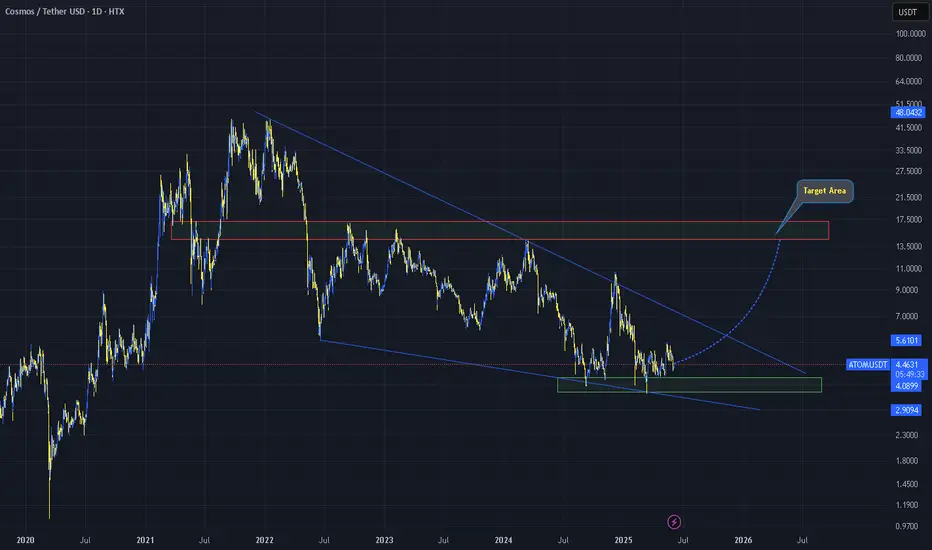
Atom... Falling wedge Pattern?A chart from my view. Not a prophecy, just a perspective. Risk is yours to carry. As always.
— TheChartMystic
CRYPTO TRADING: ATOM CAN GIVE 50-100% RETURN FROM HEREATOM can give us a good 100% return from here, risking only 18% of the invested amount.
Reason?
Weekly structure has turned bullish.
Daily is super bullish.
My stop loss is below the recent swing low on weekly time frame.
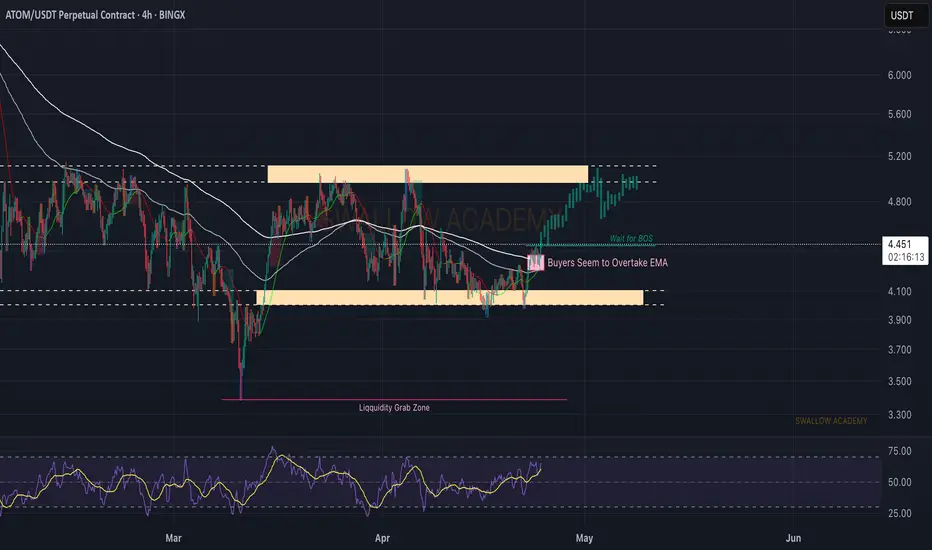
Cosmos (ATOM): Possible Break of Structure FormingCosmos coin is seeing a surge in buy volume where buyers have overtaken the zone at EMAs and now we are 1 step away from a light upward movement, which would fill the bullish CME gap at the upper resistance zone.
As soon as we see a proper break of structure, we will be looking for a buying entry there!
Swallow Academy
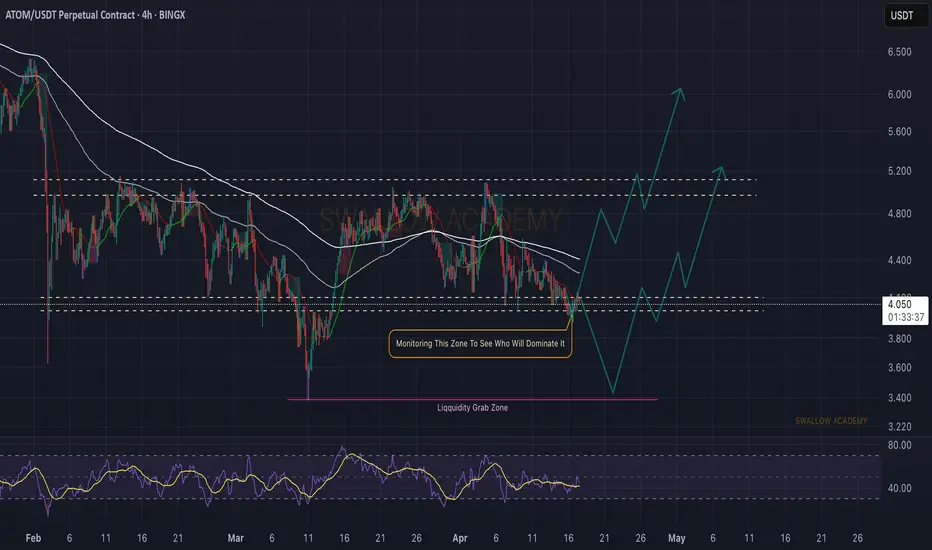
Cosmos (ATOM): Sellers Seem to Overtake Support SoonCosmos coin is at a very important support zone, which is one of the strongest support zones from where price has previously started its upward movement.
We can call it a perfect accumulation zone on bigger timeframes but currently, looking at smaller timeframes, we are seeing that after a recent touch to that zone where ideally we should have seen upward movement, we are seeing rather an overtake from sellers where dominance is going into their hands there.
We keep on monitoring for any significant break of structures there to determine in which way we will go but to be honest, we are looking now for that liquidity zone rather than the bullish CME on the upper side.
Swallow Academy
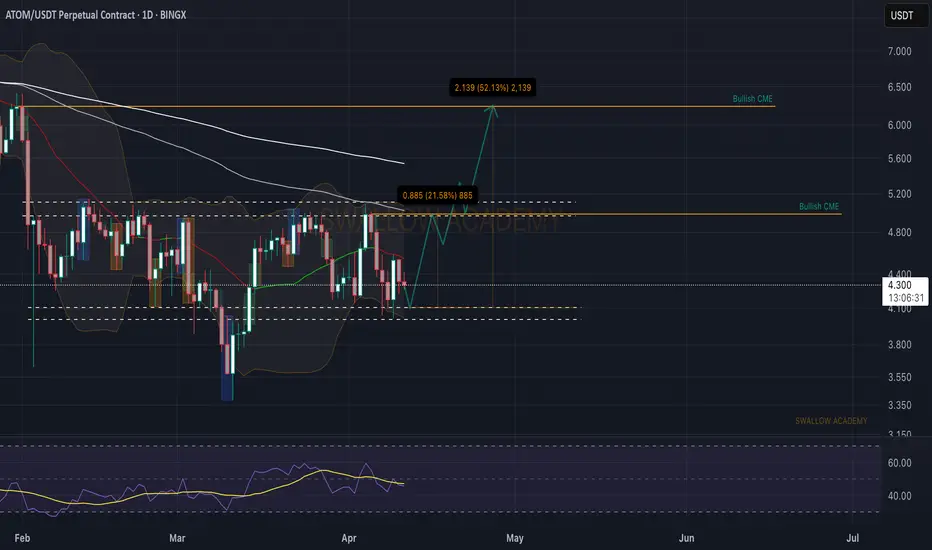
Cosmos (ATOM): Possible Bullish Momentum To Catch | +25% / +50%Cosmos coin is in a sideways channel where if we zoom in we are seeing some signs of a reversed head & shoulder pattern.
Now ideally we would look for the first CME gap to be filled here; once we see a bullish overtake of local resistance there, we will be looking for a fill of the upper CME as well.
Long way to go and for more confirmations, we need to see a proper MSB to form on 30m timeframes near the local support zone so we're watching it closely.
If we see the selling pressure continue below the support, then we will be looking for more dip!
Swallow Academy
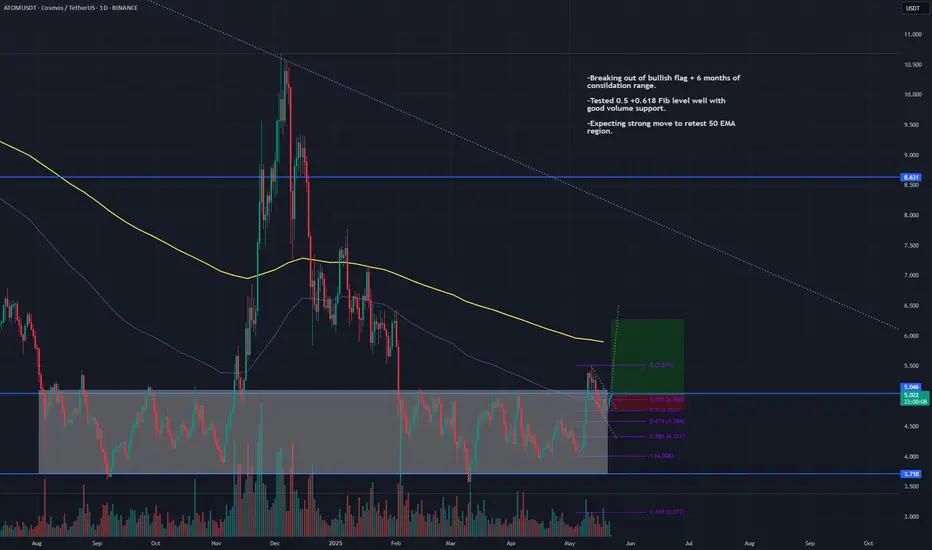
ATOMUSDT - LONG-Breaking out of bullish flag + 6 months of consildation range.
-Tested 0.5 +0.618 Fib level well with good volume support.
-Expecting strong move to retest 50 EMA region.
Don't Miss This Big Move on COSMOS (ATOMUSDT)Hello Everyone!
With Bitcoin on the rise and Ethereum likely to follow—as outlined in my recent ETHEREUM analysis idea —we continue to look for strong opportunities in the altcoin market. Right now, all eyes are on COSMOS ( BINANCE:ATOMUSDT ) as it shows promising signs of a potential breakout.
On Weekly timeframe
Price has swept the bottom of September 2024 liquidity zone.
On 4D timeframe
- On the OBV (On-Balance Volume) indicator , price has broken a downtrend—similar to the breakout seen in October 2024 , which was followed by a 170% rally.
- The previous 4-day candle closed above a key Fair Value Gap (FVG), indicating potential bullish momentum.
On 1D timeframe
- V shape inverse pattern.
- There’s significant liquidity in the $6.5–$7.5 range . After successfully breaking above the $5.1 level —just as I strongly anticipated—price is now likely targeting that liquidity zone.
To sum up, BINANCE:ATOMUSDT is demonstrating both fundamental strength and technical confirmation, making it a high-potential candidate in the current market environment.
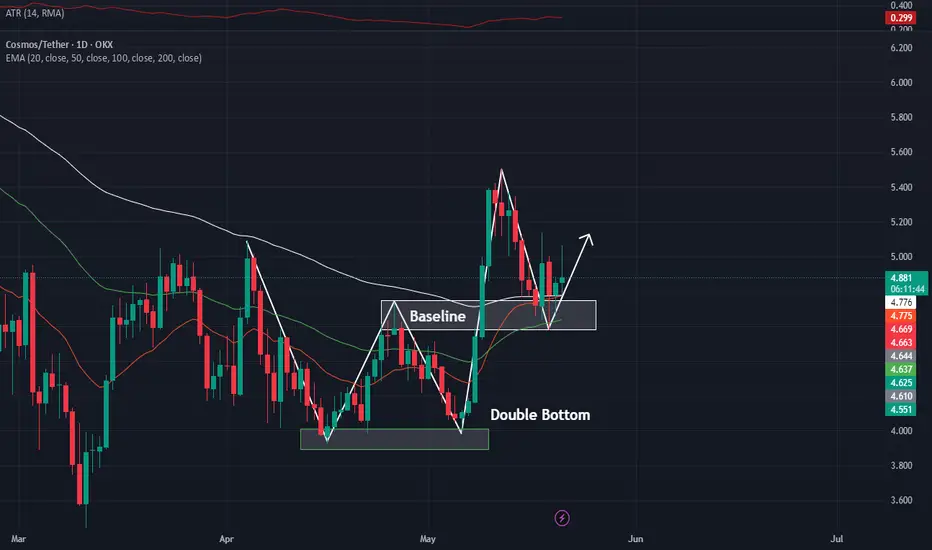
ATOMUSDT LongThis is not a signal but just my observation since I noticed some double bottom on this time frame 1D.
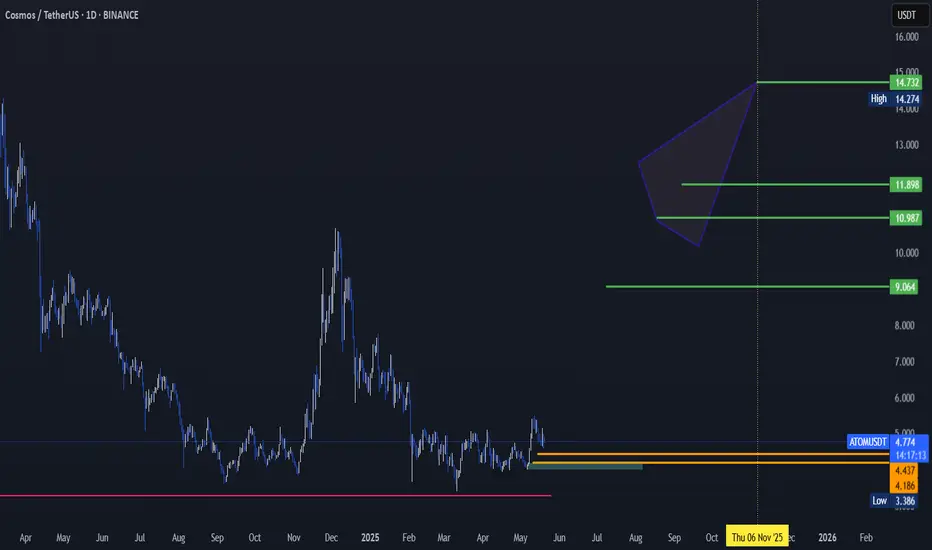
GANN ATOM Analysis
According to the temporal analysis, the targets highlighted in green are expected to be reached in the coming weeks.
TradeCityPro | Deep Search: In-Depth Of ATOM👋 Welcome to TradeCity Pro!
Today we have a deep research analysis of the ATOM project, and in this report, I’m going to review the project completely. Let’s first go over the project’s fundamentals and then analyze the ATOM chart technically.
🌌 What Is Cosmos?
Cosmos is a blockchain ecosystem designed to solve major challenges in the blockchain industry, such as low speed, high cost, lack of scalability, and the environmental impact of proof-of-work algorithms like Bitcoin. Cosmos enables cross-chain interaction (interoperability) by connecting independent blockchains through a protocol called Inter-Blockchain Communication (IBC).
Cosmos aims to simplify the development of blockchains and decentralized applications (dApps) using a modular framework known as Cosmos SDK, which makes it easier for developers to build blockchain networks.
🛠 How Does Cosmos Work?
The Cosmos network is composed of three main layers:
Application Layer: Handles transaction processing and updates the network state
Networking Layer: Manages communication between blockchains and their transactions
Consensus Layer: Establishes the final state of the blockchain using a consensus algorithm
At the core of this structure is the Tendermint BFT engine, which enables developers to build custom proof-of-stake (PoS) blockchains without coding from scratch.
🔗 Cosmos Hub and Zones
Cosmos Hub was the first blockchain created within the Cosmos network and serves as a central hub for other blockchains—called zones.
These zones are independent blockchains that can interact through Cosmos Hub.
Validators on Cosmos Hub are responsible for maintaining consensus across all zones and are compensated with transaction fees.
The native token of the network, ATOM, is used for transaction fees, governance participation, and staking.
🎯 Key Features of Cosmos
Interoperability: IBC allows blockchains to interact directly
High Scalability: Blockchains run in parallel without overloading a single chain
Ease of Blockchain Development: Cosmos SDK lets developers build customized networks
Decentralized Governance: Users participate in governance by staking ATOM
💡 Interchain Accounts Upgrade
In February 2022, the Interchain Foundation introduced the Interchain Accounts upgrade, allowing blockchains to control accounts on other chains. This enables remote actions like staking, voting, token swapping, and more—without needing full network upgrades.
This significantly enhances interoperability and composability within the IBC ecosystem.
👥 Founders of Cosmos
Jae Kwon
Zarko Milosevic
Ethan Buchman
Cosmos was initially developed by Tendermint Inc. In 2020, Jae Kwon stepped down as CEO and was replaced by Peng Zhong.
🔐 Network Security
Cosmos uses a proof-of-stake consensus algorithm with Byzantine Fault Tolerance (Tendermint BFT):
Validators are selected based on staked ATOM
Malicious behavior results in slashing (loss of tokens)
Rewards are distributed proportionally among validators and their delegators
📍 Where Can You Buy ATOM?
ATOM is available on most major exchanges, including:
Binance
Coinbase
OKX
Kraken
📈 ATOM Token Information
📊 Initial Token Distribution
In 2017, Cosmos raised approximately $16 million through public and private sales. The initial token distribution was as follows:
Public Fundraise:
Share: 44.1%
Unlocked: 35.6%
Block Rewards:
Share: 39.5%
Unlocked: 31.7%
Strategic Investors:
Share: 7.03%
Unlocked: Unknown (likely still locked)
All in Bits, Inc. (Tendermint):
Share: 6.53%
Unlocked: 5.26%
Interchain Foundation:
Share: 6.51%
Unlocked: 5.26%
Seed Investors:
Share: 3.31%
Unlocked: 2.67%
💰 Supply and Inflation
Initial supply: 236,198,958 ATOM
Current supply: ~292 million ATOM
Maximum supply: Unlimited
Inflation rate: Between 7% and 20%, targeting ~2/3 of total supply to be staked
The inflation rate is dynamically adjusted to incentivize staking. If the staking ratio drops below the target, inflation increases, and vice versa.
🔐 Staking and Rewards
Unbonding period: 21 days
Annual reward rate (APR): Between 14% and 20%, depending on network conditions and staking service provider
By staking ATOM, users help secure the network and earn rewards funded through inflation and transaction fees.
🧾 Economic Mechanisms
Burning: If a governance proposal is vetoed, the deposited tokens are burned
Slashing: Validators engaging in malicious or negligent behavior lose part of their staked tokens
🧠 ATOM Tokenomics Models: 1.0 vs 2.0
Recent analysis reveals different impacts of tokenomics models on network sustainability:
ATOM 1.0 with a 10% inflation cap has shown a 10% improvement in token price and treasury health
ATOM 2.0 suffers from stability issues and is often replaced by ATOM 1.0 to maintain network security
Community Treasury in ATOM 1.0: May face depletion within ~24 months due to limited token supply
🔚 Conclusion
Cosmos represents a significant advancement in blockchain infrastructure by addressing some of the core limitations of earlier networks—most notably, interoperability, scalability, and developer accessibility. Through its modular architecture, innovative Tendermint consensus engine, and the IBC protocol, Cosmos has laid the foundation for a truly interconnected web of blockchains.
The network’s native token, ATOM, not only fuels this ecosystem through staking and governance but also underpins its dynamic economic model. While challenges remain—especially around inflation control and treasury sustainability—Cosmos continues to evolve as a leading force in the multichain future of decentralized technologies.
Now that we’ve reviewed the project, let’s move on to the chart for a technical analysis.
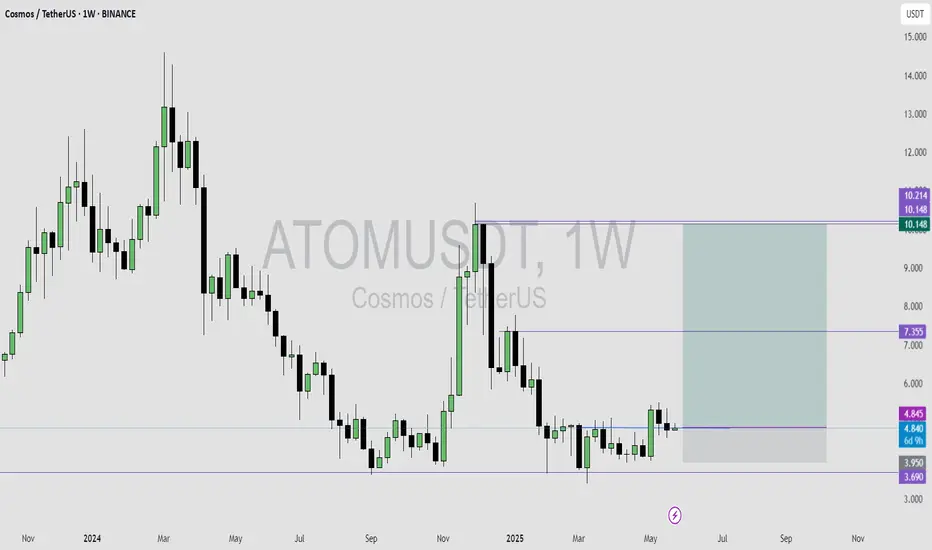
📅 Weekly Timeframe
In the weekly timeframe, as you can see, the price has formed a support bottom at the 3.812 level and has tested it multiple times.
✨ This support is very important because if it’s lost, the price could move down toward the 1.863 bottom.
💥 On the other hand, if the price is supported at this level, a bullish cycle could begin. The resistance levels ahead are 6.602 and 10.135.
🔍 The 6.602 zone isn’t very strong, and if the price gets rejected there, it signals that sellers are much stronger than buyers.
✔️ But if the price breaks through this level and moves upward, the 10.135 zone becomes very significant, because if that level is broken, a Double Bottom pattern will be activated and we can get confirmation of a trend reversal.
💫 If this pattern is confirmed, the first target will be 15.704.
📊 Right now, it’s better to pay attention to oscillators like volume and RSI. Volume is currently decreasing, and we need to wait for volume confirmation alongside price movement. If the price starts to move with volume convergence, the likelihood of continuation increases.
🔔 The RSI oscillator also has a small bullish divergence with price. The reason it’s considered small is that the price made an equal low while the RSI made a higher low. If RSI makes a new higher low again, we may start to see the effect of the divergence in the chart.
🎲 A breakout above the 50 level on RSI could also be a confirmation of bullish momentum.
📅 Daily Timeframe
In the daily timeframe, we can see more details of the price action.
🧩 As observed, the price has formed a range box between 3.989 and 5.380, and within this range, RSI has shown a strong divergence.
📈 I think if RSI doesn’t stabilize below the 50 level, and if the price sets a new higher low above 4.588, the chance of breaking the 5.380 resistance on the next test will be much higher.
🔑 If 5.380 is broken, the price could rally to 7.514. The next target after that would be 10.135, a level I also emphasized in the weekly timeframe.
🔽 For a bearish scenario and short positions, the first trigger is a break below 4.588, which can act as a lead-in to a possible break of 3.989. The main short trigger will be the confirmed break of 3.989.
❌ Disclaimer ❌
Trading futures is highly risky and dangerous. If you're not an expert, these triggers may not be suitable for you. You should first learn risk and capital management. You can also use the educational content from this channel.
Finally, these triggers reflect my personal opinions on price action, and the market may move completely against this analysis. So, do your own research before opening any position.
WARNING For ATOM Holders: -50% Crash Incoming!Hello, Skyrexians!
As you know I was not sure last couple of days if altseason started or not and finally decided that not. Bitcoin dominance will reach 67% and large altcoin like BINANCE:ATOMUSDT gives me the hint that altcoins can drop 50% in the upcoming 2-3 weeks!
Let's take a look at the 2 days time frame. To measure the impulse this is valid now. We can see that after reaching the wave 3 target price bounced in the wave 4. Wave 4 has reached the 0.38 Fibonacci and started to go down after red dot on Bullish/Bearish Reversal Bar Indicator . Moreover Awesome Oscillator crossed the zero line signaling that wave 4 could be finished. Now price is in wave 5. The target is $2-3.5. I think it will reach slightly lower low at $3 in this bear market which is almost 50% crash from the current price.
Best regards,
Ivan Skyrexio
___________________________________________________________
Please, boost this article and subscribe our page if you like analysis!

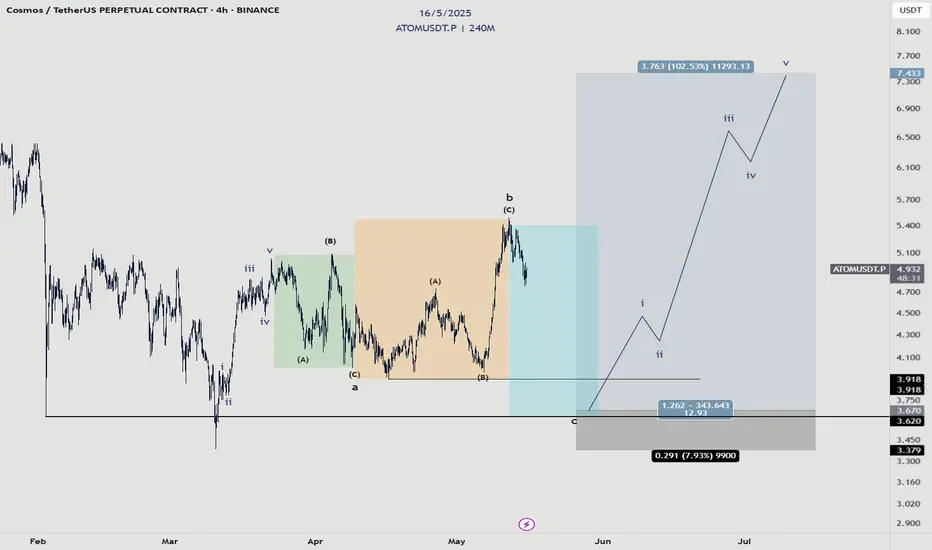
Cosmos - Manipulation?This idea is valid as long as the structure in the orange box maintains its three wave structure.
To prepare for a big run, it goes without saying that there must be some sort of accumulation and manipulation to occur.
In this case, I propose this expanded flat structure where we took the high out to kill the shorts and also trap buyers. Then, terminate that low to take out the buyers and trap sellers.. where we will enter a long into the big move.
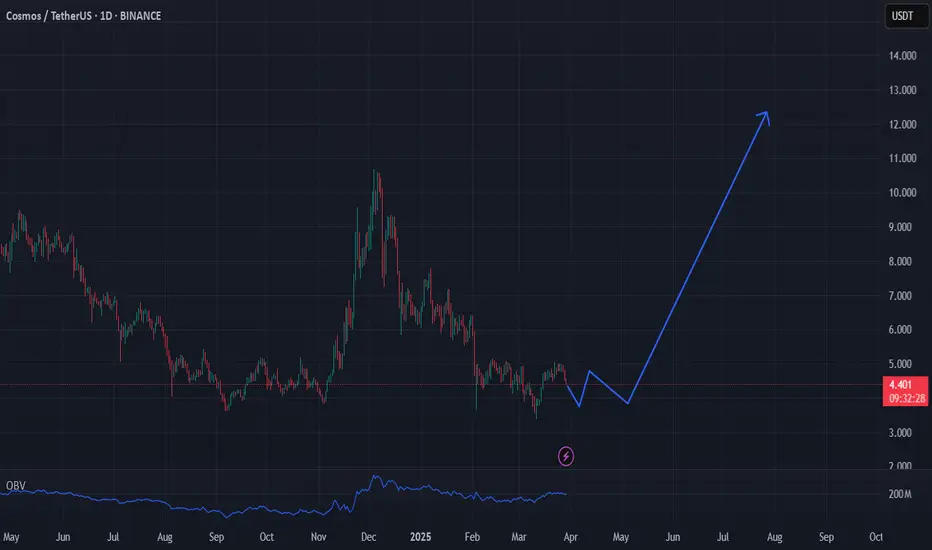
My thoughts on this asset im hoping it does something similar to what i have drawn up i feel some harmony in the way this chart is playing out , dont have any techical mumbo jumbo to support my idea but i have been accumulating at the 4$ range and put into staking and i would be pleased if it got a nice pump to at least 12-14 if a bullrun on alts will happen , maybe one last bear trap could be in the cards after forming inverse h&s on daily . just my thoughts not financial advice always do your own research
Stay safe everyone
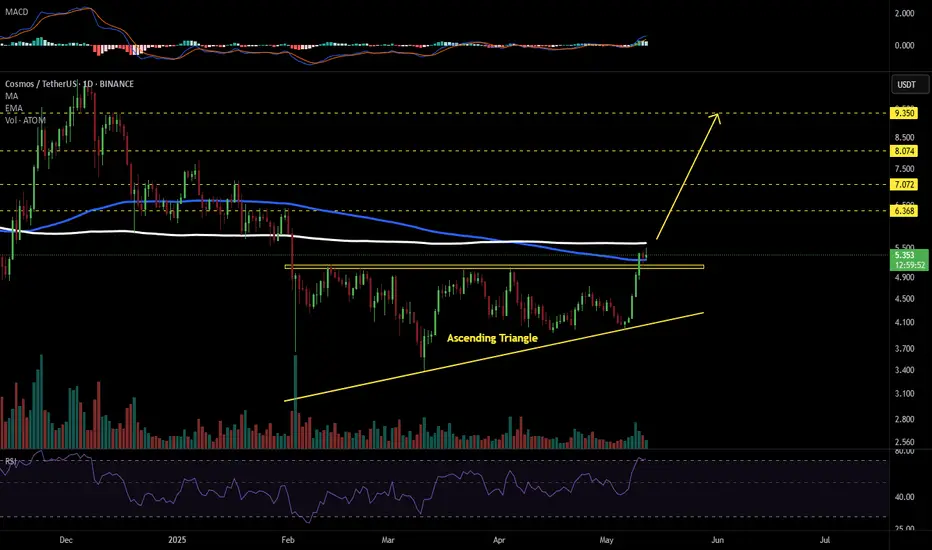
ATOMUSDT 1D#ATOM has broken above the ascending triangle and the EMA200 on the daily chart. If it manages to break above the MA200, the targets are:
🎯 $6.368
🎯 $7.072
🎯 $8.074
🎯 $9.350
⚠️ Use a tight stop-loss.
ATOM at a Crossroads: Breakout or Rejection?ATOM just pulled off a little victory, sneaking past the moving average—but the real show starts if it can break through that thick red Ichimoku cloud. The big question: will it act as a resistance wall or a launchpad for a move up? That all depends on us holding above that circled area. The market’s a bloodbath right now, but if we’re gonna see a turnaround, this looks like a prime spot. Targets marked on the chart—now we wait. Fingers crossed! 🤞🔥
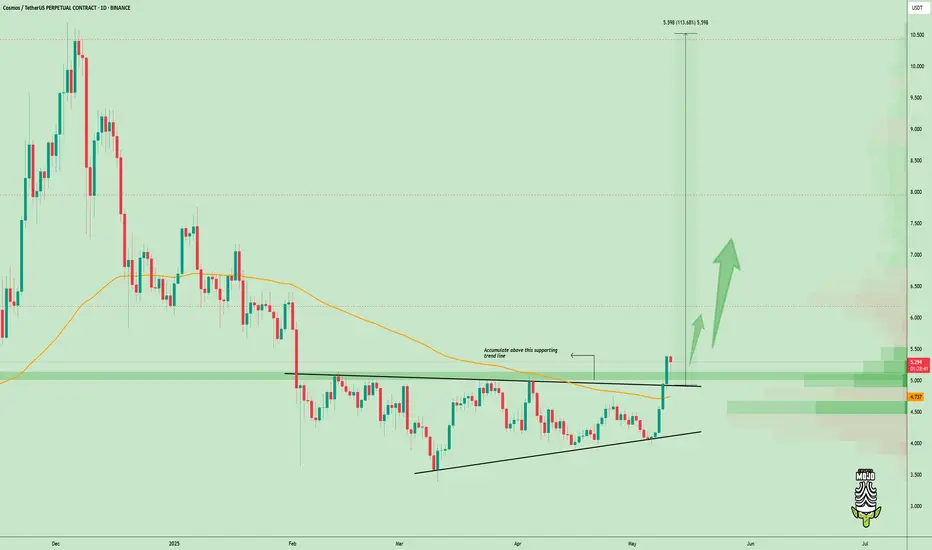
$ATOM Ready for Liftoff – 100%+ Move on the TableNASDAQ:ATOM has just broken out of the trendline and is converting the major resistance into support.
This breakout could be the start of something huge - the chart shows potential 100 %+ movement ahead of it.
Looking forward to a retest around the $4.73 mark before the next move upwards towards $10+.
Momentum looks solid, this could take off soon 🚀
Retweet if you are bullish!
#ATOM #Altseason2025
$ATOM Breakout Above Key Resistance – Bullish ReversalNASDAQ:ATOM has just broken through a key resistance zone, reclaiming the 100 EMA with confidence and confirming a strong trend reversal.
This move has triggered a powerful breakout, backed by volume and bullish price structure.
DYOR, NFA

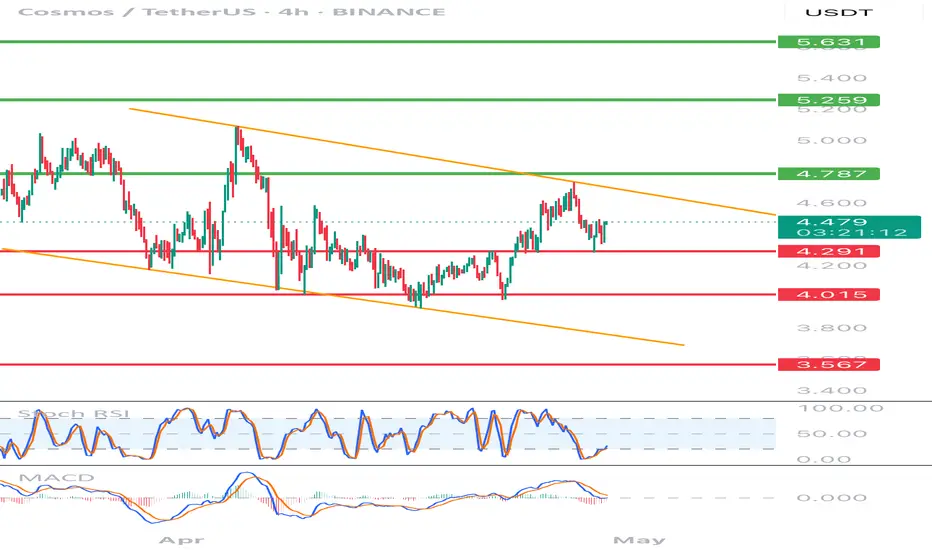
ATOM/USDT review chart 4HHello everyone, let's look at the 4H ATOM chart for USDT, in this situation we can see how the price has affected from the upper limit of the downward trend channel, however, staying in the upper part of the channel. Going further, let's check the places of potential target for the price:
T1 = $ 4.79
T2 = $ 5,26
Т3 = 5.63 $
Let's go to Stop-Loss now in case of further declines on the market:
SL1 = $ 4.29
SL2 = $ 4.02
SL3 = $ 3,57
Looking at the RSI indicator, you can see a healthy relaxation crossing the lower limit, which produces space for a potentially new growth movement. The MacD indicator that has returned to the center of the range, which also creates potential for upward movement.
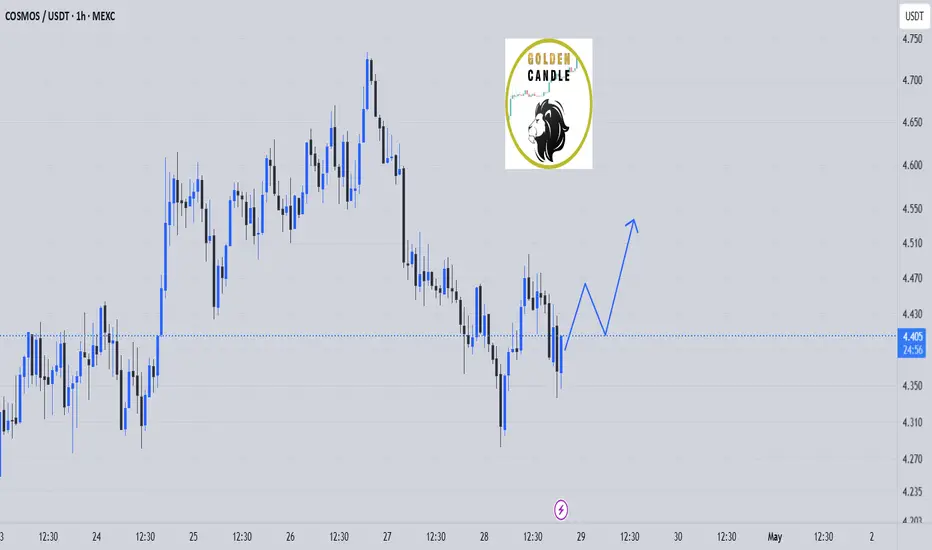
atom buy midterm "🌟 Welcome to Golden Candle! 🌟
We're a team of 📈 passionate traders 📉 who love sharing our 🔍 technical analysis insights 🔎 with the TradingView community. 🌎
Our goal is to provide 💡 valuable perspectives 💡 on market trends and patterns, but 🚫 please note that our analyses are not intended as buy or sell recommendations. 🚫
Instead, they reflect our own 💭 personal attitudes and thoughts. 💭
Follow along and 📚 learn 📚 from our analyses! 📊💡"